Quick Answer
A 10 kWp system with 22,000 USD landed cost and a 30 percent margin target prices at 31,400 USD. A system that saves the customer 60,000 USD over 25 years prices at 25,000 to 40,000 USD regardless of underlying cost. Best for: Most growing residential installers above 30 to 50 installs per month.
Solar installation pricing is the single most important financial decision an installer makes. Get it right and your business compounds margins year over year. Get it wrong and you grow revenue while shrinking profit, which is the most common path to bankruptcy in this industry. The 2026 market punishes pricing mistakes faster than ever because lead costs have risen, equipment margins have compressed, and customers comparison shop more aggressively. See our guide on Agricultural Solar Case Study for more. See our guide on Floating Solar Farms France for more.
A 10 kWp system with 22,000 USD landed cost and a 30 percent margin target prices at 31,400 USD. A system that saves the customer 60,000 USD over 25 years prices at 25,000 to 40,000 USD regardless of underlying cost. Best for: Most growing residential installers above 30 to 50 installs per month.
TL;DR — Solar Installation Pricing
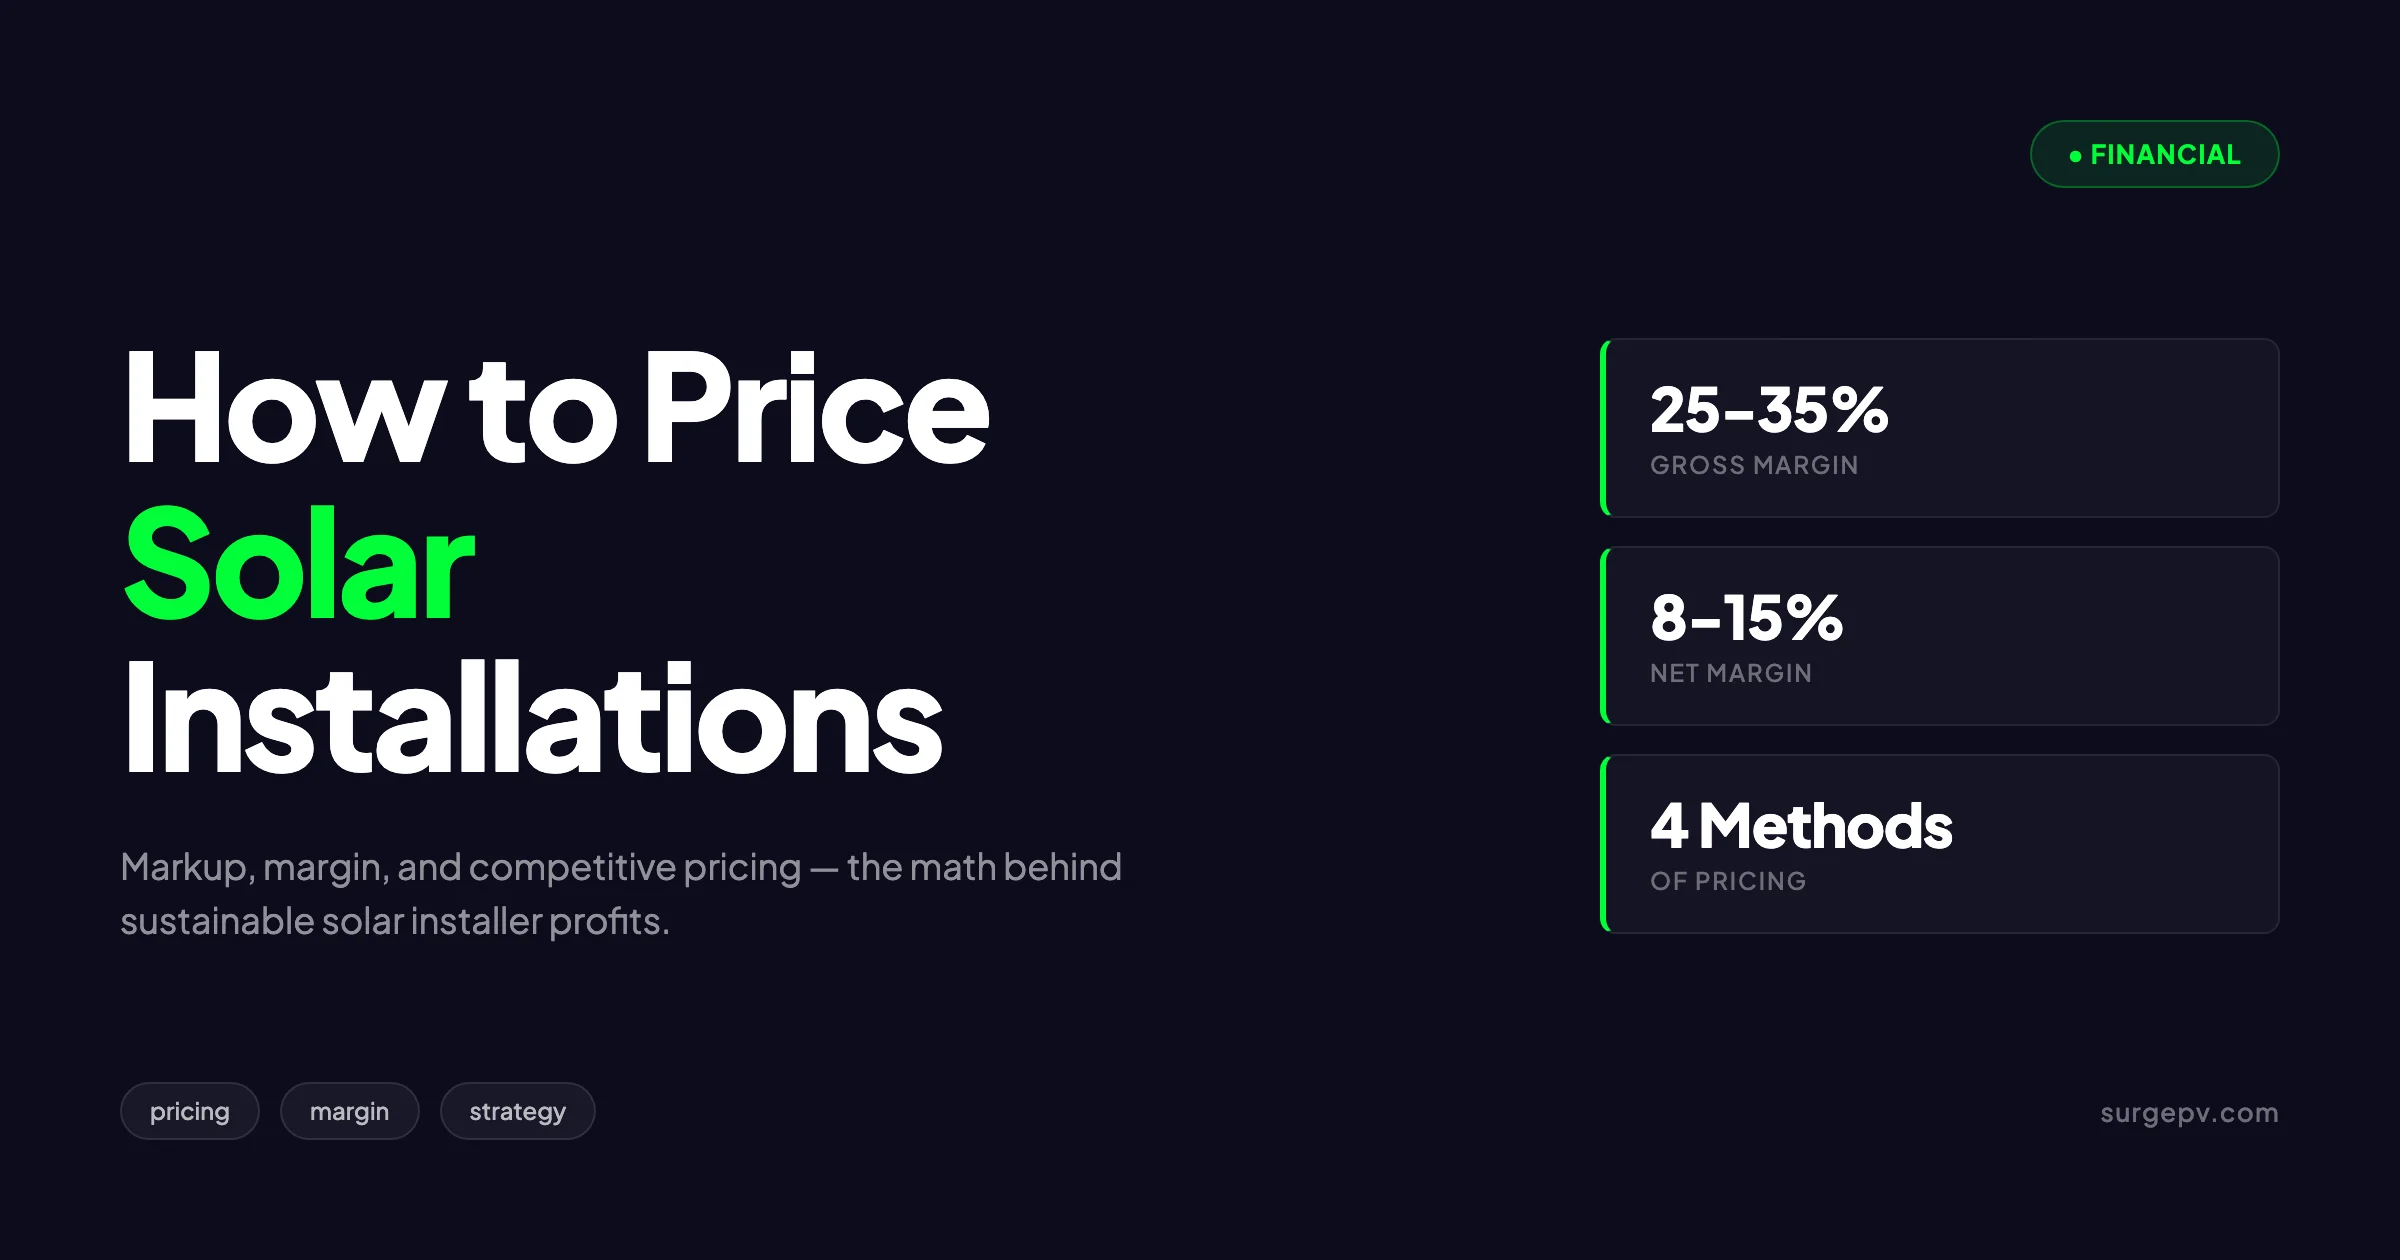
Healthy residential solar gross margins run 25 to 35 percent. Cost per watt landed runs 2.20 to 2.80 USD; sale prices run 2.80 to 4.00 USD. Top installers use hybrid pricing combining cost-plus floors with value-based premium tiers. Pricing decisions made without rigorous unit economics analysis are the leading cause of installer bankruptcy.
This guide covers the four pricing methods used by solar installers, the cost components that drive your floor price, the regional pricing benchmarks that define market reality, and the implementation frameworks that turn pricing from guesswork into a managed business process.
The Four Pricing Methods
Solar installers use four distinct pricing methods. Each has advantages, limitations, and a typical fit by market segment.
Method 1: Cost-Plus Pricing
Cost-plus pricing computes total project cost and adds a target margin percentage. A 10 kWp system with 22,000 USD landed cost and a 30 percent margin target prices at 31,400 USD.
Strengths: transparent, predictable margins, easy to train sales reps, hard to lose money on individual deals.
Limitations: ignores customer willingness to pay, leaves money on the table for premium customers, makes it hard to compete on simple deals.
Best for: Mid-market residential installers with high deal volume and limited differentiation.
Method 2: Value-Based Pricing
Value-based pricing sets the price based on the value delivered to the customer rather than the cost to the installer. A system that saves the customer 60,000 USD over 25 years prices at 25,000 to 40,000 USD regardless of underlying cost.
Strengths: captures maximum margin on premium customers, encourages customer-centric design, supports differentiated brands.
Limitations: requires sophisticated sales training, struggles in price-shopping markets, harder to scale with high-volume sales teams.
Best for: Premium installers with strong brand and customer experience differentiation.
Method 3: Hybrid Pricing
Hybrid pricing uses cost-plus as the floor and adds value-based premium tiers. The base tier targets cost-plus margin; premium tiers (better warranty, premium panels, faster install) capture additional margin from customers who value those features.
Strengths: captures both volume and premium margin, provides natural upsell paths, manageable sales training.
Limitations: more complex pricing model, requires good tier-fit analysis, salespeople sometimes default to base tier under pressure.
Best for: Most growing residential installers above 30 to 50 installs per month.
Method 4: Competitive-Reference Pricing
Competitive-reference pricing benchmarks against known competitor prices and positions slightly above, at, or below depending on differentiation. The price is set by market position rather than cost or value.
Strengths: maintains market position, simple to communicate, responsive to competitive pressure.
Limitations: vulnerable to competitive races to the bottom, ignores cost and value, difficult to maintain margins if competitors price below cost.
Best for: Mature markets with established price points and limited differentiation opportunities.
Cost Components: What Goes Into Your Price Floor
Before you can price, you must know your costs. Most installers underestimate at least one major cost category, which means their “30 percent margin” calculations actually deliver 15 to 20 percent net margin in practice.
Equipment Costs
Direct equipment costs include panels, inverters, racking, wiring, conduit, disconnects, monitoring equipment, and balance of system components. Read Solar Racking Design Guide for a complete walkthrough.
| Component | Cost per Watt (USD) |
|---|---|
| Panels | 0.30 to 0.55 |
| Inverters | 0.10 to 0.25 |
| Racking and mounting | 0.10 to 0.20 |
| DC/AC wiring and BOS | 0.15 to 0.25 |
| Monitoring | 0.02 to 0.05 |
| Equipment subtotal | 0.67 to 1.30 |
Equipment costs vary by region, supplier, and bulk purchasing power. National installers buying in container quantities pay 15 to 25 percent less than regional installers buying through distributors.
Labor Costs
Labor includes installation crew wages, supervision, project management, and ancillary labor (electrical inspection, drywall patching, roofing repair).
| Component | Cost per Watt (USD) |
|---|---|
| Installation crew | 0.30 to 0.50 |
| Supervision | 0.05 to 0.10 |
| Project management | 0.05 to 0.10 |
| Ancillary labor | 0.05 to 0.15 |
| Labor subtotal | 0.45 to 0.85 |
Labor costs increase 5 to 10 percent annually in most US markets. Installers without scheduled price reviews see margins erode silently.
Permitting and Soft Costs
Soft costs include permits, interconnection fees, engineering stamps, plan sets, and AHJ-specific requirements.
| Component | Cost per Watt (USD) |
|---|---|
| Permitting fees | 0.05 to 0.20 |
| Engineering stamp | 0.02 to 0.10 |
| Plan set generation | 0.02 to 0.05 |
| Interconnection | 0.05 to 0.15 |
| Permitting subtotal | 0.14 to 0.50 |
Permitting costs vary 10x between jurisdictions. Texas residential permits can cost 50 USD; some California jurisdictions exceed 1,500 USD per project. Pricing must account for jurisdictional variance.
Sales and Marketing
Customer acquisition cost is the biggest cost most installers underprice. The full CAC includes paid media, sales rep commission, lead qualification labor, and proposal generation overhead. For more on this topic, see Solar Sales Commission Structure.
| Component | Cost per Project (USD) |
|---|---|
| Paid media spend | 200 to 600 |
| Sales rep commission | 800 to 2,500 |
| Lead qualification | 100 to 300 |
| Proposal and design | 100 to 300 |
| Sales subtotal | 1,200 to 3,700 |
Per watt, this adds 0.15 to 0.45 USD on a typical residential system. Many installers ignore this cost in pricing models, which is why they “make money” on every deal but cannot pay overhead.
Overhead Allocation
Overhead includes office rent, insurance, accounting, leadership salaries, software subscriptions, vehicles, and warehousing.
For a typical residential installer, overhead allocation runs 0.10 to 0.25 USD per watt. Larger installers achieve scale and drop to 0.08 to 0.15 USD per watt. Smaller installers operate at 0.20 to 0.35 USD per watt because the fixed costs spread over fewer projects.
Warranty and Service Reserves
Warranty reserves cover the cost of fulfilling 25-year warranties. Industry data suggests 0.05 to 0.15 USD per watt is appropriate, but most installers reserve nothing or far too little.
The reserve is needed because panels fail, inverters fail more often, monitoring drops out, and customers expect responsive service. Companies that skip reserves face cash crunches when warranty obligations come due 5 to 10 years after install.
Total Landed Cost
| Category | Cost per Watt (USD) |
|---|---|
| Equipment | 0.67 to 1.30 |
| Labor | 0.45 to 0.85 |
| Permitting | 0.14 to 0.50 |
| Sales and marketing | 0.15 to 0.45 |
| Overhead | 0.10 to 0.25 |
| Warranty reserves | 0.05 to 0.15 |
| Total landed cost | 1.56 to 3.50 |
The wide range reflects regional and operational variation. Disciplined installers know their actual landed cost to within 5 percent. Most installers know it to within 25 percent, which is why pricing decisions feel arbitrary.
Regional Pricing Benchmarks
Solar installation prices vary significantly by region, driven by local labor costs, permitting overhead, market competition, and customer willingness to pay.
US Residential Pricing (2026)
| Region | Average Price per Watt (USD) | Typical Range |
|---|---|---|
| California | 3.20 to 4.00 | 2.80 to 4.50 |
| Northeast | 3.00 to 3.80 | 2.70 to 4.20 |
| Texas | 2.50 to 3.20 | 2.20 to 3.80 |
| Florida | 2.40 to 3.10 | 2.10 to 3.60 |
| Southwest | 2.60 to 3.30 | 2.30 to 3.90 |
| Mountain West | 2.70 to 3.40 | 2.40 to 4.00 |
| Midwest | 2.40 to 3.10 | 2.10 to 3.70 |
The regional variation reflects labor costs (highest in California and the Northeast), permitting complexity, and competitive intensity. Texas and Florida see lower prices because of lower regulatory overhead and high installer competition.
European Residential Pricing (2026)
European pricing follows different patterns. VAT inclusion, national subsidy structures, and labor costs create wide variation. Also see: European Solar Incentives. For Europe-specific compliance details, see Europe solar compliance.
| Country | Average Price per Watt (EUR, ex-VAT) |
|---|---|
| Germany | 1.30 to 1.80 |
| Netherlands | 1.20 to 1.70 |
| Italy | 1.40 to 1.90 |
| Spain | 1.20 to 1.60 |
| France | 1.50 to 2.00 |
| UK | 1.40 to 1.90 |
For more on European pricing context, see solar installation cost per kWp in European countries and solar VAT rates in Europe.
Commercial Pricing
Commercial pricing varies more widely than residential because project scale, complexity, and customer sophistication change the dynamics.
| Project Size | US Average per Watt (USD) |
|---|---|
| 25 to 100 kWp | 2.00 to 2.80 |
| 100 to 500 kWp | 1.60 to 2.30 |
| 500 kWp to 2 MW | 1.30 to 1.90 |
| 2 MW+ | 1.00 to 1.50 |
Larger commercial projects face thinner margins because customers run competitive RFPs and have sophisticated procurement teams. Specialization in a vertical (warehouses, schools, hospitals) helps maintain margins.
For deeper commercial design context, see [warehouse rooftop solar design](/blog/warehouse-rooftop-solar-design) and hospital solar system design.
Build Better Proposals That Justify Your Pricing
Pricing alone does not close deals. The proposal does. SurgePV creates branded interactive proposals with 3D renderings, year-by-year savings, and financial models that justify premium pricing.
Book a DemoNo commitment required · 20 minutes · Live project walkthrough
For a direct comparison, see Arka 360 vs SurgePV.
Margin Targets That Build Sustainable Businesses
Pricing without explicit margin targets produces erratic profitability. The targets below reflect what well-run residential and commercial installers achieve consistently.
Residential Margin Targets
| Metric | Target Range | Median Performer | Top Performer |
|---|---|---|---|
| Gross margin | 25-35% | 22% | 38% |
| Sales and marketing | 12-18% | 20% | 10% |
| Operating overhead | 8-12% | 14% | 7% |
| Net margin | 8-15% | 5% | 18% |
The median performer makes 5 percent net margin. The top performer makes 18 percent. The gap is almost entirely operational discipline and pricing strategy, not equipment cost or labor cost.
Commercial Margin Targets
| Metric | Target Range | Median Performer | Top Performer |
|---|---|---|---|
| Gross margin | 15-25% | 12% | 28% |
| Sales and marketing | 6-10% | 12% | 5% |
| Operating overhead | 5-9% | 10% | 4% |
| Net margin | 4-10% | 2% | 14% |
Commercial margins are thinner because deals are larger and customers more sophisticated. The trade-off is per-project gross profit dollars are higher, so a smaller margin percentage produces meaningful absolute profit.
Why the Margin Gaps Are Large
The variation between median and top performers comes from a few specific operational habits:
- Top performers track unit economics per project and adjust pricing monthly
- They have disciplined sales training that reduces commission inflation
- They invest in software (solar design software, CRM, project management) that reduces labor per project
- They have differentiated value propositions that command premium pricing
- They prune unprofitable customer segments rather than chasing all volume
For more on the financial metrics, see solar installer profit margins.
Pricing Implementation: From Theory to Practice
Knowing the theory of pricing is different from operationalizing it. Implementation failures kill pricing strategies more often than the strategy itself.
Step 1: Build a Pricing Calculator
Create a calculator that captures all cost inputs and produces price recommendations. The calculator should include:
- Equipment costs by component with current supplier pricing
- Labor costs by region and project complexity
- Permitting costs by jurisdiction
- Soft cost allocations
- Margin tiers (basic, standard, premium)
Update the calculator monthly with current cost data. Cost data that is 6 months old produces consistently underpriced bids.
Step 2: Establish Pricing Authority
Define who can approve pricing exceptions. The standard structure:
- Sales rep: 3 percent below standard pricing
- Sales manager: up to 7 percent discount
- Sales VP: up to 10 percent discount
- CFO/CEO: above 10 percent discount
Track exceptions weekly. Repeated exceptions in the same direction signal that standard pricing is wrong, not that customers need discounts.
Step 3: Train Sales on Pricing Logic
Sales reps need to understand why pricing is what it is, not just what to quote. Training topics:
- Cost components and where margin comes from
- Customer types that pay premium versus discount
- Trade-offs between price and other terms (warranty, payment schedule, panel brand)
- How to handle competitor price comparisons
- When to walk away from a deal
The training is ongoing, not one-time. New tactics emerge quarterly as the market evolves.
Step 4: Track Pricing Performance
Pricing performance monitoring requires three reports:
| Report | Purpose | Frequency |
|---|---|---|
| Average price per watt by month | Trend tracking | Weekly |
| Margin by project | Outlier identification | Per project |
| Win rate by price tier | Tier optimization | Monthly |
| Discount frequency by rep | Sales discipline | Monthly |
The reports surface problems before they become structural. A trend toward lower prices over 3 months requires investigation and intervention.
Step 5: Run Quarterly Pricing Reviews
Pricing should be reviewed quarterly with formal updates. Review topics:
- Current cost data and recommended adjustments
- Competitive pricing intelligence
- Win/loss analysis by price tier
- Margin trends versus targets
- Exception patterns and recommended changes
Without scheduled reviews, pricing drifts. With them, pricing stays current and defensible.
Common Pricing Mistakes to Avoid
These mistakes appear repeatedly across installer bankruptcies and margin compressions.
Mistake 1: Pricing Without Knowing Your CAC
Customer acquisition cost is the most underestimated cost in solar. Installers who price without including full CAC sell deals at apparent profit but actual loss.
The fix: calculate full CAC including paid media, sales commission, and proposal labor. Add it to your price floor explicitly.
Mistake 2: Matching Every Competitor Quote
Customers report competitor quotes that are sometimes accurate, sometimes inflated, sometimes inaccurate. Installers who reflexively match competitor prices subsidize competitors who price below cost.
The fix: match selectively. Only match when you have verified the competitor quote and the deal is high-margin enough to absorb the discount.
Mistake 3: Discounting at the End of the Month
Sales managers under quota pressure discount aggressively in the last 5 days of the month. The discounts pull forward demand from next month at lower margins.
The fix: structured discounting only. End-of-month discounts must be approved at the executive level and tracked separately from standard discounting.
Mistake 4: Ignoring Warranty Reserves
Warranty obligations come due 5 to 10 years after install. Installers who do not reserve face cash crunches when claims arrive at scale.
The fix: reserve 0.05 to 0.15 USD per watt installed in a separate account. Use only for warranty service. Treat it as untouchable for operating cash flow.
Mistake 5: Pricing as a Single Number
A single price number does not capture the trade-offs customers make. Some customers want lower price; others want premium panels; others want longer warranty.
The fix: offer 3 to 4 tiers with explicit trade-offs. Customers self-select the tier matching their priorities, and the average revenue per project rises versus single-tier pricing.
When to Raise Prices
Most installers under-raise prices. The market raises labor costs, equipment costs, and permitting costs annually. Installers who do not raise prices in step see margins erode.
Signal 1: Win Rate Above 60 Percent
If you win more than 60 percent of qualified leads, you are pricing too low. Optimal win rate is typically 30 to 45 percent depending on market.
Signal 2: Customers Do Not Comparison Shop
If most customers accept the first quote without comparing competitors, your price is too low for the value you deliver.
Signal 3: Sales Reps Sell Without Effort
If reps close deals without negotiation or objection handling, the price leaves money on the table. Some friction is normal and healthy.
Signal 4: Margins Below Industry Median
Compare your gross margin to industry benchmarks. If you are below the median, raise prices systematically until you reach at least median performance.
How to Raise Prices Without Losing Customers
Raise prices in 3 to 5 percent increments quarterly rather than 15 percent at once. Pair price increases with feature additions (longer warranty, premium panels, faster install). Communicate increases to your team with the rationale so they sell the change confidently.
Conclusion: Pricing as Strategic Decision
Solar installation pricing is the strategic decision that most determines long-term profitability. Equipment cost, labor cost, and lead cost are all inputs. Pricing is the lever you control most directly.
Three action items for installers reviewing their pricing strategy:
- Calculate full landed cost per watt including all overhead, sales, and warranty reserves. Compare to your sale price to identify true gross margin.
- Audit your pricing for the last 90 days. Group projects by margin tier and identify patterns in low-margin work.
- Implement quarterly pricing reviews with explicit margin targets. Pricing without review erodes silently.
For broader business strategy context, see solar business profitability guide and scale solar installation business.
Frequently Asked Questions
What is a healthy gross margin for solar installations?
Healthy residential solar gross margins run 25 to 35 percent. Commercial margins run 15 to 25 percent due to higher competitive pressure. Net margins after sales, marketing, and overhead typically land at 8 to 15 percent for well-run installers.
How do I calculate solar installation cost per watt?
Total cost per watt includes equipment, labor, permitting, soft costs, and overhead allocation. US residential averages 2.20 to 2.80 USD per watt installed cost, with sale prices of 2.80 to 4.00 USD per watt. The gap is your gross margin.
What is the typical markup on solar equipment?
Equipment markup runs 15 to 30 percent on panels and inverters, and 30 to 60 percent on balance-of-system components like racking and wiring. Higher markup compensates for the labor and overhead not directly billed to the customer.
Should I price by cost-plus or value-based?
Cost-plus pricing works for commodity-style installs where customers comparison shop on price. Value-based pricing works for premium installers selling on quality, design, and customer experience. Most successful installers use a hybrid: cost-plus floor with value-based premium tiers. For France-specific information, see France Solar Policy.
How do I handle competitive pressure on price?
Match price only on the bottom 20 percent of leads who buy on price alone. Differentiate on the other 80 percent by value, warranty, design quality, and customer experience. Trying to win every deal on price destroys margins faster than losing some deals.
What costs do most installers underestimate?
Soft costs (sales, marketing, customer acquisition) and warranty reserves. Industry data shows installers consistently underbudget customer acquisition by 30 to 50 percent and warranty service by 50 to 100 percent. These hidden costs erode margins below sustainable levels.
Is dynamic pricing possible for solar?
Yes. Modern solar software supports dynamic pricing based on roof complexity, system size, geography, and competitive intensity. The challenge is operationalizing it without losing sales rep autonomy or customer trust. Solar proposal software generates professional quotes in minutes.


