Quick Answer
The market has grown from a niche program in Minnesota to a 6.2 GW national segment with projects in 44 states and DC. The 2026 rebound to roughly 1.6 GWdc is driven by New York pipeline completions and Illinois Shines program year rollouts. NREL's Sharing the Sun dataset found that roughly 75% of cumulative community solar capacity is concentrated in just four states.
Maria Gonzalez opened her Con Edison bill in February 2026 the same way she had every month for fifteen years — with a sense of dread. Her two-bedroom apartment in the Bronx ran $187 in January, up from $143 the year before. She had looked into rooftop solar once, but her building was a rental, her roof faced north, and the installer told her it would never pencil out.
The market has grown from a niche program in Minnesota to a 6.2 GW national segment with projects in 44 states and DC. The 2026 rebound to roughly 1.6 GWdc is driven by New York pipeline completions and Illinois Shines program year rollouts.
Then her cousin mentioned community solar. Maria signed up online in ten minutes, picked a 7 kW share of a project in Orange County, and received her first bill credit in March. Her April Con Edison bill dropped to $163. The community solar provider charged her $152 for the credits. Net savings: $11 that month. By July, with longer days and higher production, her savings hit $28. Annualized, she is on track to save roughly $220 in year one — about 12% off her electricity costs — with no panels on her roof, no credit check, and the ability to cancel with 60 days notice. See Community Solar Business Model for detailed guidance.
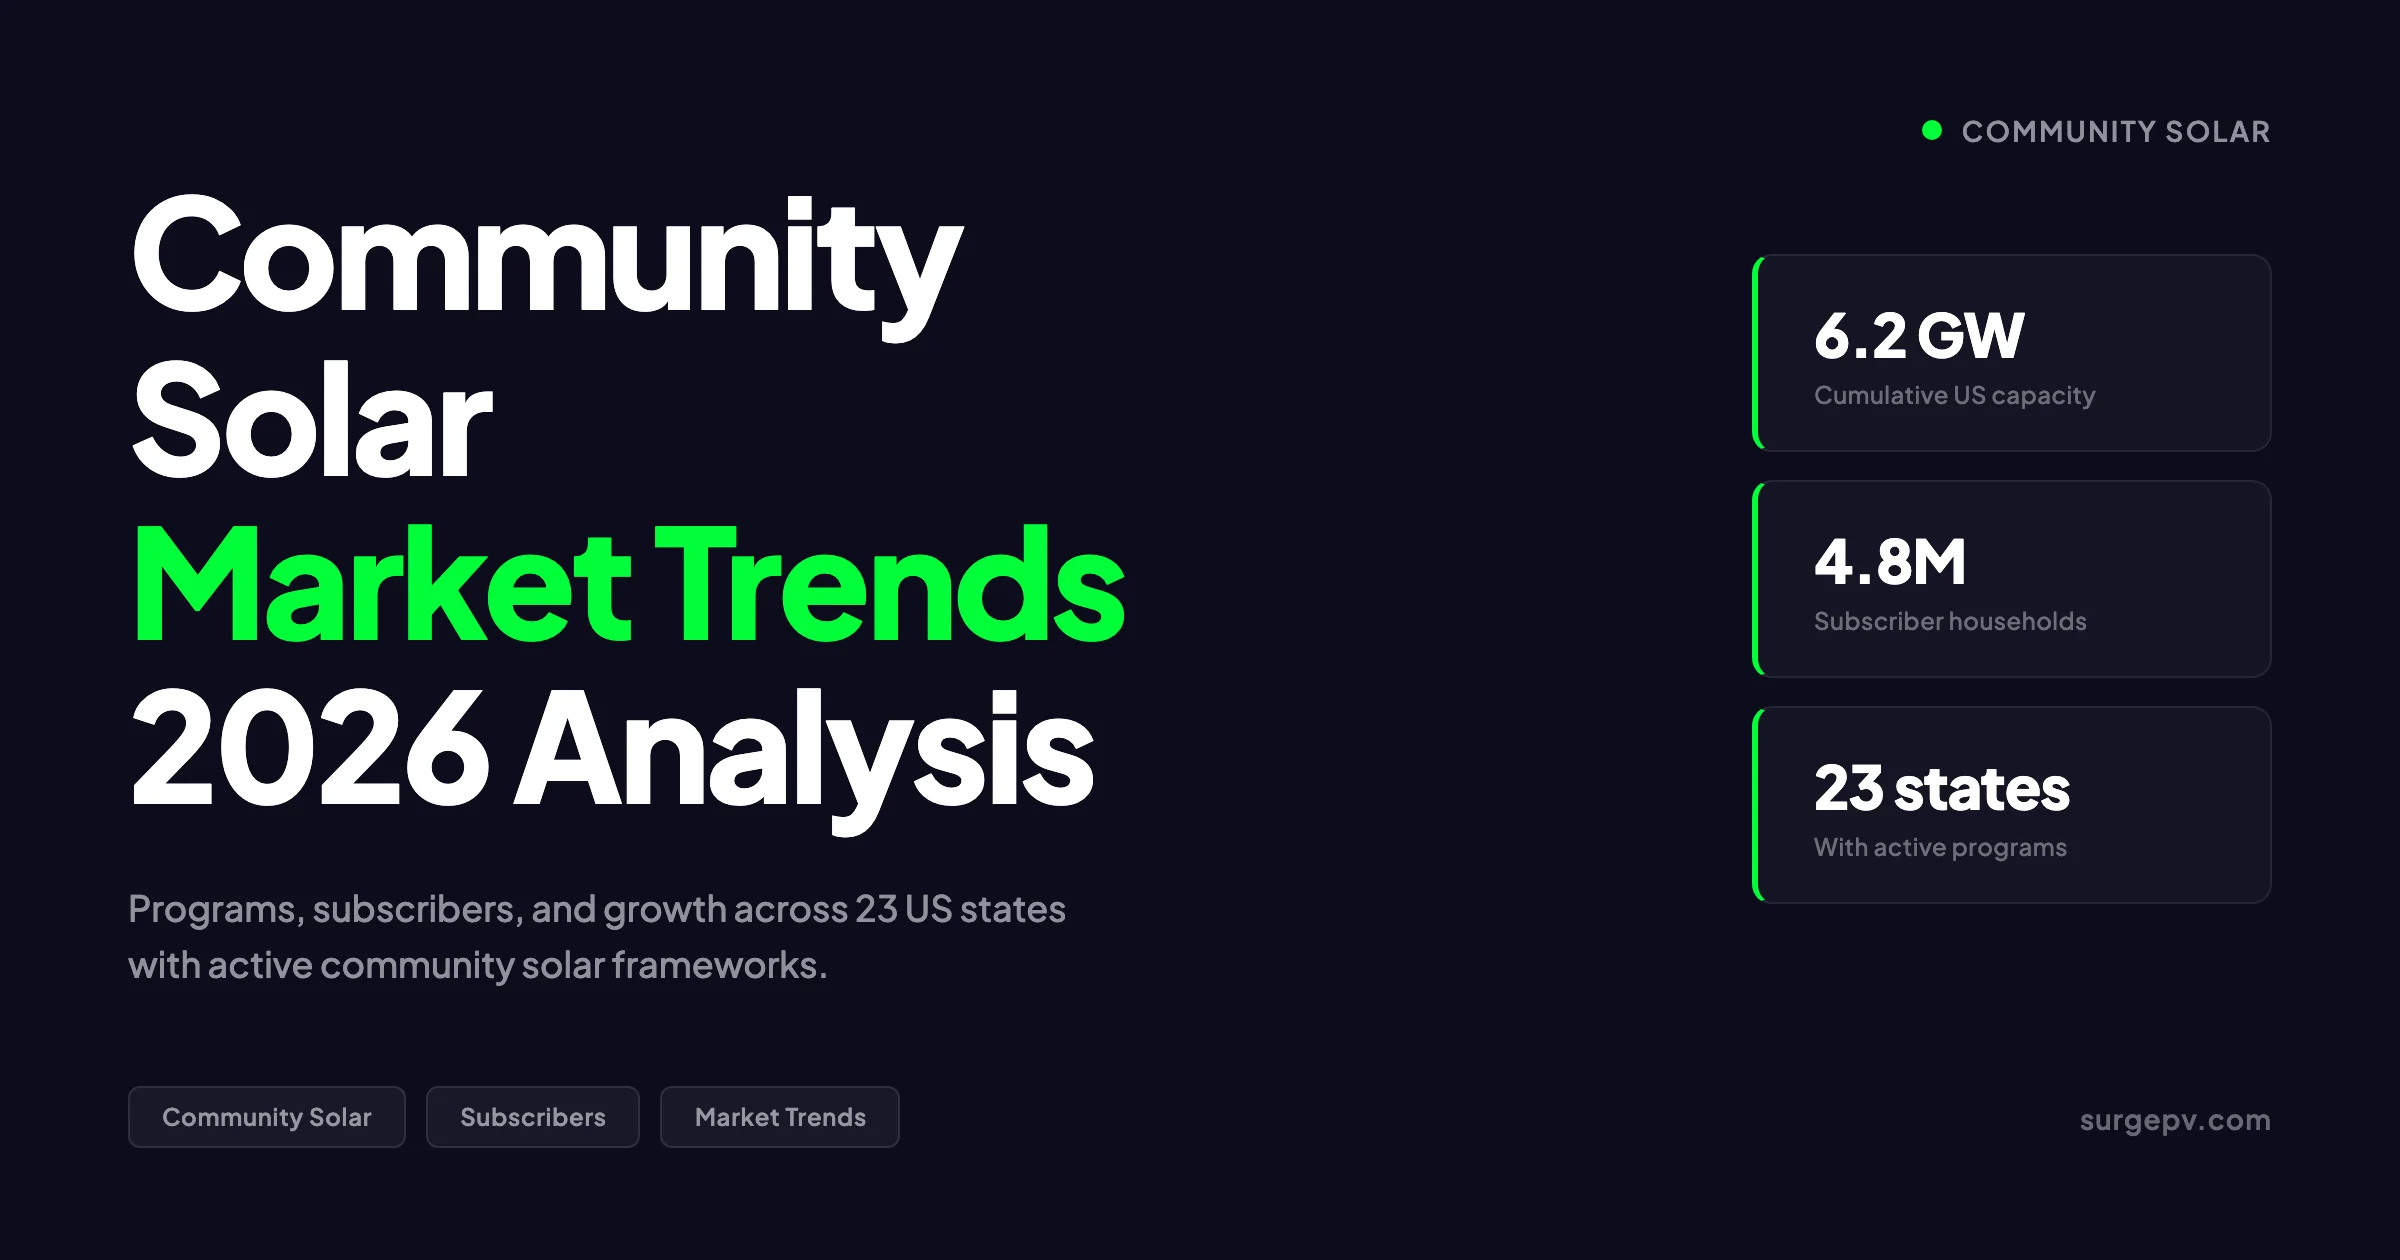
Maria is one of roughly 4.8 million US households subscribed to community solar in 2026. The market has grown from a niche program in Minnesota to a 6.2 GW national segment with projects in 44 states and DC. This guide covers the full community solar market trends 2026 landscape: how the subscription model works, which states lead, what subscribers actually save, how developers make money, where the equity programs are working, and what most published reports get wrong about where this market is heading.
TL;DR — Community Solar Market Trends 2026
US community solar reached 6.2 GW cumulative capacity and 4.8M subscriber households by early 2026. SEIA projects 12% installation growth in 2026 after a 25% contraction in 2025. New York and Illinois represent 68% of national volume. Subscribers save 5–20% on electricity bills through virtual net metering credits. Twenty-four states plus DC have enabling legislation; 20 include low-income provisions. Developer margins range 8–15% on subscription models. The market faces a 5% annual contraction risk through 2030 without new state programs.
In this guide:
- Community solar market snapshot 2026 — capacity, subscribers, and state concentration
- How community solar works: the subscription model, virtual net metering, and billing
- State-by-state program landscape 2026 with active capacity and subscriber data
- Subscriber economics: savings, contract terms, credit programs, and real examples
- What most community solar reports get wrong (the contrarian take)
- Developer economics: margins, risk, and business models
- Equity and low-income access programs
- 2027 to 2030 outlook: where community solar grows next
- Practical implications for installers, developers, and subscribers
Community Solar Market Snapshot 2026
The US community solar market crossed two milestones in late 2025: cumulative capacity exceeded 6 GWdc, and subscriber households passed 4.5 million. Both numbers continued climbing into 2026, though the growth rate has shifted dramatically from the boom years of 2021 to 2023.
Cumulative Capacity and Subscriber Trajectory
| Year | Cumulative Capacity (GWdc) | Annual Additions (GWdc) | Subscriber Households (M) | YoY Growth |
|---|---|---|---|---|
| 2021 | 3.4 | 0.95 | 1.8 | +38% |
| 2022 | 4.2 | 0.80 | 2.4 | +21% |
| 2023 | 5.1 | 0.90 | 3.1 | +29% |
| 2024 | 5.9 | 0.80 | 3.8 | +16% |
| 2025 (actual) | 6.2 | 1.44 | 4.5 | +18% |
| 2026 (forecast) | 7.0 | 1.6 | 4.8 | +12% |
| 2027 (forecast) | 7.8 | 0.8 | 5.2 | +5% |
| 2028 (forecast) | 8.5 | 0.7 | 5.6 | +4% |
Sources: SEIA/Wood Mackenzie US Solar Market Insight Q4 2025 and Q1 2026; NREL Sharing the Sun dataset (June 2024 baseline); Coalition for Community Solar Access market tracking. Subscriber household estimates derived from average subscription size and capacity data.
The 2025 installation figure of 1,435 MWdc looks strong on paper but represents a 25% decline from 2024’s volume when adjusted for program timing. The 2026 rebound to roughly 1.6 GWdc is driven by New York pipeline completions and Illinois Shines program year rollouts. The longer-term trajectory is flatter: SEIA’s base case shows average annual contraction of 5% through 2030 without new state enabling legislation.
Market Concentration: Four States, Three-Quarters of Capacity
NREL’s Sharing the Sun dataset found that roughly 75% of cumulative community solar capacity is concentrated in just four states. Expand to the top ten, and you capture 93% of all capacity. This concentration is the defining structural feature of the US community solar market — and its biggest vulnerability.
| State | Cumulative Capacity (MWdc) | 2025 Additions (MWdc) | Market Share | Program Status |
|---|---|---|---|---|
| New York | ~2,100 | 624 | 43% | Active; pipeline constraints emerging |
| Florida | ~1,400 | Minimal | 23% | Utility-led; limited new subscriber access |
| Massachusetts | ~850 | ~45 | 14% | SMART 3.0; mature program |
| Minnesota | ~750 | ~30 | 12% | Xcel Energy program; stable |
| Illinois | ~550 | 349 | 9% | Illinois Shines; strong growth |
| Colorado | ~280 | ~20 | 5% | Community Solar Gardens; established |
| Maryland | ~220 | 76 | 4% | Record year; up 13% YoY |
| New Jersey | ~180 | 46 | 3% | CSEP; up 31% YoY |
| California | ~150 | Minimal | 2% | Limited program; CPUC reform pending |
| Maine | ~120 | Minimal | 2% | Contracted 87% due to policy changes |
Sources: SEIA/Wood Mackenzie Q4 2025; NREL Sharing the Sun (2024); state program administrator reports. Figures approximate due to varying reporting timelines.
New York’s dominance is striking: the state alone accounted for 52% of national capacity additions in Q1 2025. But New York’s community solar pipeline is approaching saturation in certain utility territories. Con Edison’s territory has seen interconnection queue times extend to 18–24 months for new community solar projects. The next wave of growth must come from other states — or from program expansion in existing markets.
Key Takeaway — Concentration Risk
A market where two states drive 68% of volume and four states hold 75% of capacity is fragile. Policy changes in Albany or Springfield can move national installation numbers by double-digit percentages. Maine’s 87% contraction in 2025 — caused by a single legislative adjustment to net metering credits — is a preview of what happens when concentrated markets face policy headwinds.
How Community Solar Works — The Subscription Model
Community solar is often described as “solar for people who cannot install panels.” That is accurate but incomplete. The model is a financial subscription to a remote solar asset, mediated by virtual net metering, with savings delivered as bill credits. Understanding each layer matters for subscribers evaluating offers and developers structuring projects.
The Three-Party Structure
Every community solar project involves three parties: the developer (who builds and operates the solar farm), the utility (which delivers electricity and administers credits), and the subscriber (who receives bill credits and pays the developer).
Step 1: Project development. A developer identifies land, secures interconnection, obtains permits, and constructs a solar array — typically 1–5 MWdc for community solar. The project is sized based on anticipated subscriber demand and utility program caps.
Step 2: Subscription sales. The developer sells subscriptions representing a share of the project’s output. A typical residential subscription is 5–10 kW of capacity, producing roughly 6,500–13,000 kWh annually depending on location. Subscribers sign a contract — typically 10–20 years with escalation clauses — and provide their utility account number.
Step 3: Virtual net metering. The solar farm generates electricity and feeds it into the grid. The utility tracks production and assigns virtual credits to subscribers’ accounts based on their subscription share. These credits appear on the subscriber’s regular utility bill, reducing the amount owed.
Step 4: Billing. The subscriber pays two bills: the reduced utility bill (minus solar credits) and a separate bill to the community solar provider for the credits at a discounted rate. The discount is where subscriber savings come from.
Virtual Net Metering Explained
Virtual net metering is the policy mechanism that makes community solar economically viable. Without VNM, a subscriber to a remote solar farm would receive no financial benefit — the electricity goes to the grid, and the subscriber pays full retail rates.
Under VNM, the utility treats the subscriber as if they had net-metered solar on their own roof. Credits are calculated based on the subscriber’s share of production and applied to their bill. The credit rate varies by state and program:
| Credit Mechanism | States Using It | How It Works |
|---|---|---|
| Full retail rate credit | NY, MA (legacy), MN | Credits valued at full retail electricity rate |
| Avoided cost credit | CA, some CO | Credits valued at utility’s avoided cost (~$0.04–0.06/kWh) |
| Fixed VNM credit rate | IL, MD, NJ | Credits at a fixed rate set by program administrator |
| Floating market-based | ME (prior to reform) | Credits tied to wholesale market prices |
Source: NREL State Policies and Programs for Community Solar dataset (updated March 2026); state public utility commission orders.
The credit mechanism determines subscriber economics. A full retail credit in New York (where Con Edison rates average $0.28/kWh) produces far more savings than an avoided-cost credit in California (where PG&E credits community solar at roughly $0.05/kWh). This is why community solar thrives in high-retail-rate states with generous VNM policies — and struggles where credit values are low.
Subscriber Billing Walkthrough
Here is how a typical month looks for a community solar subscriber in Illinois:
| Line Item | Amount |
|---|---|
| Monthly electricity consumption | 850 kWh |
| Regular utility bill (before solar) | $119.00 |
| Community solar production (8 kW share) | 950 kWh |
| Solar credits applied to utility bill | −$104.50 |
| Utility bill after credits | $14.50 |
| Payment to community solar provider (90% of credit value) | $94.05 |
| Net monthly cost | $108.55 |
| Monthly savings | $10.45 |
| Annual savings (estimated) | ~$125 |
Illustrative example based on ComEd residential rates and Illinois Shines community solar program terms. Actual savings vary by subscriber consumption, project production, and contract terms.
The key insight: savings are modest on a monthly basis but accumulate meaningfully over time. A household saving $125/year over a 15-year contract accumulates $1,875 in total savings — with zero upfront investment. For a low-income household, that is real money.
Pro Tip — Evaluating a Community Solar Offer
Before signing, check four things: (1) the credit rate — is it fixed or variable, and what is the escalation clause? (2) cancellation terms — can you exit without penalty, and what is the notice period? (3) credit rollover — do excess summer credits carry forward to winter months? (4) the developer’s track record — how many projects have they completed, and are they registered with the state program administrator? Offers with 20-year terms and 3% annual escalation often look attractive in year one but erode savings by year ten.
State-by-State Program Landscape 2026
Community solar is not a single national market. It is 24 distinct state markets (plus DC), each with its own program design, credit mechanism, capacity cap, and low-income provisions. Understanding the state-level variation is essential for developers choosing where to build and subscribers evaluating whether community solar is available to them.
Active Community Solar Programs by State — 2026
| State | Program Name | Capacity Cap | Credit Type | LMI Provision | 2025 Additions |
|---|---|---|---|---|---|
| New York | NY-Sun Community Solar | 6 GW by 2025 | Retail rate | 40% LMI carve-out | 624 MW |
| Illinois | Illinois Shines | No hard cap | Fixed VNM | 25% equity eligible | 349 MW |
| Massachusetts | SMART 3.0 | 3,200 MW solar total | Retail + adders | Low-income adder | ~45 MW |
| Minnesota | Xcel Community Solar | 1,000 MW | Retail rate | 30% LMI preference | ~30 MW |
| Maryland | Community Solar Pilot | 1,500 MW pilot | Fixed VNM | 30% LMI carve-out | 76 MW |
| New Jersey | CSEP | 375 MW pilot | Retail rate | LMI dedicated projects | 46 MW |
| Colorado | Community Solar Gardens | Various by utility | Retail rate | 5% low-income minimum | ~20 MW |
| Maine | Net Energy Billing | No cap (reformed) | Market-based | LMI pilot | Minimal |
| DC | Solar for All | No cap | Retail rate | 100% LMI target | ~15 MW |
| Connecticut | Shared Clean Energy | 300 MW | Retail rate | 20% LMI | ~12 MW |
| Rhode Island | Renewable Energy Growth | 200 MW | Retail rate | LMI adder | ~8 MW |
| Delaware | Community Solar | 150 MW pilot | Avoided cost | LMI provision | ~5 MW |
| Hawaii | Community-Based RE | 50 MW per island | Retail rate | LMI preference | Minimal |
| Oregon | Community Solar | Various | Retail rate | 10% LMI | Minimal |
| California | SCE/SDG&E programs | Limited pilots | Avoided cost | LMI pilots | Minimal |
Sources: NREL State Policies and Programs for Community Solar (updated March 2026); SEIA/Wood Mackenzie Q4 2025; state program administrator annual reports. Capacity caps and provisions vary by utility territory within states.
Program Design Patterns
Three distinct program archetypes have emerged across the 24 active states:
Retail credit states (NY, MA, MN, HI): Subscribers receive credits at the full retail electricity rate. This produces the highest savings (10–20% after the developer discount) but also the highest cost to the utility, which must credit subscribers at rates above wholesale. These programs tend to have capacity caps and competitive queue management.
Fixed VNM states (IL, MD, NJ): A program administrator sets a fixed credit rate, typically below retail but above wholesale. This balances subscriber savings with utility cost recovery. Illinois Shines uses this model, with credit rates set through the Adjustable Block Program.
Avoided cost states (CA, parts of CO, DE): Credits are valued at the utility’s avoided cost — roughly the wholesale rate the utility would pay for替代 generation. At $0.04–0.06/kWh, this barely covers the developer discount, leaving subscribers with minimal or no savings. Community solar in these states is effectively limited to subscribers motivated by environmental values rather than economics.
Emerging State Markets
Several states have proposed enabling legislation that could significantly expand the addressable market:
- Pennsylvania: House Bill 1840 would create a 500 MW community solar program with retail credits and 30% LMI carve-out. SEIA estimates this could add 200 MW annually if enacted.
- Michigan: Senate Bill 519 proposes a community solar framework with 1 GW capacity cap. The bill is in committee as of Q1 2026.
- Wisconsin: Assembly Bill 258 would authorize community solar gardens with retail rate credits. Facing utility opposition.
- Virginia: Dominion Energy’s shared solar program expanded in 2025 but remains constrained by credit rate disputes.
SEIA’s conservative base-case forecast excludes these proposed programs. If even half are enacted, the 2027–2030 outlook improves materially.
Subscriber Economics — Savings, Terms, and Credit Programs
The subscriber value proposition is simple on the surface — save money on electricity with no upfront cost — but the details vary significantly by state, developer, and contract structure.
Typical Subscriber Savings by State
| State | Avg Retail Rate ($/kWh) | Credit Rate ($/kWh) | Developer Discount | Est. Annual Savings (6 kW share) |
|---|---|---|---|---|
| New York | $0.26–0.32 | $0.26–0.32 (retail) | 10% | $180–$280 |
| Massachusetts | $0.28–0.34 | $0.28–0.34 (retail) | 10–12% | $200–$320 |
| Illinois | $0.13–0.16 | $0.10–0.12 (fixed VNM) | 10–15% | $80–$150 |
| Maryland | $0.14–0.17 | $0.12–0.14 (fixed VNM) | 10% | $90–$140 |
| Minnesota | $0.13–0.15 | $0.13–0.15 (retail) | 10% | $100–$160 |
| Colorado | $0.13–0.16 | $0.13–0.16 (retail) | 10–15% | $80–$140 |
| Maine | $0.18–0.22 | $0.08–0.12 (market) | 10% | $40–$100 |
| California | $0.28–0.36 | $0.04–0.06 (avoided cost) | 0–5% | $0–$40 |
Sources: EIA Electric Power Monthly (January 2026); state program administrator credit rate schedules; EnergySage Marketplace data. Savings are estimates for a typical residential subscriber with 750–900 kWh monthly consumption and a 6–8 kW community solar share.
The savings range is wide. A subscriber in Massachusetts with high retail rates and a retail credit can save $250+ annually. A subscriber in California with avoided-cost credits might save nothing. This divergence is the single most important factor explaining why community solar thrives in some states and barely exists in others.
Contract Terms and Subscriber Protections
Community solar contracts vary in ways that materially affect long-term subscriber value:
| Term | Typical Range | What to Watch |
|---|---|---|
| Contract length | 10–25 years | Longer terms lock in savings but reduce flexibility |
| Annual escalation | 0–3% | Escalation above 2% can erase savings by year 10+ |
| Cancellation | 60–90 days notice | Some contracts charge exit fees; verify before signing |
| Credit rollover | Yes (most states) | Ensures summer overproduction offsets winter shortfall |
| Minimum bill | $0–$15/month | Some utilities charge a minimum even with full credit offset |
| Subscription transfer | Varies | Important if you move within the same utility territory |
| Developer default | State-dependent | Some states guarantee credit continuity if developer fails |
Source: EnergySage Community Solar Marketplace contract review; state consumer protection regulations.
Low-Income Subscriber Programs
Low-income access is where community solar delivers its most consequential impact. A 2024 Lawrence Berkeley National Lab study found community solar subscribers earn 23% less annual income than rooftop solar adopters and are 6x more likely to live in multifamily housing. The Coalition for Community Solar Access reported that the share of community solar serving LMI subscribers grew from 2% to 10% in a single year (2022 to 2023), with costs to subscribe LMI customers declining 30% year-over-year.
| State | LMI Mechanism | Savings Guarantee |
|---|---|---|
| New York | 40% LMI carve-out | 20% bill reduction guaranteed |
| Massachusetts | Low-income adder (+$0.03/kWh) | Varies by project |
| Illinois | 25% equity-eligible priority | Sliding scale based on income |
| Maryland | 30% LMI carve-out | 25% savings for LMI subscribers |
| DC | 100% LMI target | Free subscription for eligible households |
| Colorado | 5% low-income minimum | Varies by project |
Sources: NREL Review of Equitable Access and Household Savings (2024); CCSA policy tracking; state program administrator reports.
The DC Solar for All program is the most aggressive: it targets 100% LMI participation, offering free community solar subscriptions to households at or below 80% of area median income. The program is funded through the Renewable Energy Development Fund and administered by the DC Department of Energy and Environment.
Key Takeaway — LMI Access Is Growing Fast
The share of community solar serving low-income subscribers jumped from 2% to 10% in one year. The $7 billion EPA Solar for All competition, awarded in 2024, is now funding state-level programs that will expand this further. For developers, LMI subscriber acquisition is cheaper than it was (costs fell 30% YoY) and increasingly mandated by program rules. For subscribers, community solar is becoming a genuine energy affordability tool, not just a green option for environmentally minded homeowners.
What Most Community Solar Reports Get Wrong
Industry coverage of community solar tends to repeat three narratives that do not match the reality on the ground. Here is what I see from working with developers and subscribers that contradicts the published outlook.
Misconception 1: “Community Solar and Rooftop Solar Are Substitutes”
They are not. They serve completely different customer segments with minimal overlap.
Rooftop solar adopters are homeowners with suitable roofs, sufficient tax appetite to monetize the ITC, and the creditworthiness to secure financing. Community solar subscribers are disproportionately renters, apartment dwellers, households with shaded roofs, and those who cannot or will not take on debt for solar. The Lawrence Berkeley National Lab data is unambiguous: community solar subscribers are 4x more likely to rent, 6x more likely to live in multifamily housing, and earn 23% less than rooftop solar adopters. Shadow analysis software identifies shading issues before installation.
The implication: community solar does not cannibalize rooftop solar. It expands the addressable market. A state with strong community solar and strong rooftop solar programs will see higher total solar penetration than a state with only rooftop solar. Treating them as competitors in policy design is a category error.
Misconception 2: “Community Solar Saves Subscribers Significant Money”
The savings are real but modest. A typical subscriber saves $100–$250 annually — meaningful for a low-income household, but not life-changing. The 10–20% savings figures cited by developers and marketplaces are accurate but often presented without context about annual dollar amounts.
The more honest framing: community solar provides predictable, low-risk electricity savings with zero upfront cost. It is not a wealth-building instrument like rooftop solar (which can add $15,000–$30,000 in home equity and deliver $20,000+ in lifetime savings). It is an energy affordability tool that reduces monthly bills by a manageable amount without requiring capital or credit.
Misconception 3: “The Market Will Keep Growing at Historical Rates”
It will not — not without new state programs. SEIA’s base case shows 5% average annual contraction through 2030. The 2025 contraction of 25% was masked by New York’s Q1 surge, but the underlying trend is clear: existing state markets are maturing, pipeline constraints are emerging, and no new state generated meaningful growth in 2025.
The growth case for community solar depends entirely on legislative action in Pennsylvania, Michigan, Wisconsin, Virginia, and other states considering enabling laws. Without that expansion, the market plateaus at 8–10 GW cumulative by 2030.
Tradeoff: Short-Term Savings vs. Long-Term Contract Lock-In
The unspoken tradeoff in community solar is between immediate savings and long-term flexibility. A 20-year contract with 2% annual escalation might deliver $150 in year-one savings but erode to near-zero by year fifteen if retail rates grow slower than the escalation clause. A 10-year contract with no escalation delivers lower initial savings but preserves the subscriber’s ability to switch providers or exit if better options emerge.
For developers, the 20-year contract is attractive — it locks in revenue and improves project financing. For subscribers, it is often the wrong choice. The best community solar offers combine 10-year terms with fixed discounts and easy cancellation.
“Community solar is not a substitute for rooftop solar. It is a complement that opens solar access to households excluded from ownership. The policy mistake is treating them as competing programs rather than parallel pathways to the same goal.” — Coalition for Community Solar Access, 2024 market analysis.
Model Community Solar Economics for Your Clients
SurgePV’s solar design and proposal platform handles virtual net metering credit calculations, subscriber savings modeling, and multi-scenario financial analysis for community solar developers and installers. Built for projects from 1 MW community gardens to 50 MW shared solar farms.
Book a DemoNo commitment required · 20 minutes · Live project walkthrough
Read Design Commercial Solar System 1MW for a complete walkthrough.
Developer Economics — Margins, Risk, and Business Models
Community solar development is a different business than utility-scale solar. Subscriber acquisition replaces PPA origination. Virtual net metering policy replaces wholesale market exposure. And the capital stack must accommodate smaller project sizes and higher customer acquisition costs.
Project Economics Overview
A typical 3 MWdc community solar project in New York or Illinois has the following economics:
| Parameter | Value |
|---|---|
| Project size | 3 MWdc |
| Total capex | $3.6–$4.5M ($1.20–$1.50/W) |
| Subscriber revenue (20-year contract) | $5.5–$7.5M |
| Tax equity (ITC + depreciation) | $1.1–$1.4M |
| SREC/value of solar revenue | $0.6–$1.2M (state-dependent) |
| O&M (20-year NPV) | $0.8–$1.0M |
| Subscriber acquisition cost | $300–$600 per subscriber |
| Developer margin | 8–15% |
| Project IRR (levered) | 10–16% |
Source: Author analysis based on disclosed developer financials, SEIA cost benchmarks, and state program administrator data. Figures illustrative for NY/IL market conditions.
The subscriber acquisition cost is the variable that most distinguishes community solar from utility-scale. A 3 MW project serving 400–600 households might spend $150,000–$300,000 on customer acquisition — marketing, sales, credit checks, contract management, and ongoing subscriber services. This cost is minimal in utility-scale solar (one counterparty, one contract) but significant in community solar.
Three Business Models
Model 1: Pure Subscription (Nexamp, Arcadia, Clearway)
The developer sells individual household subscriptions at a fixed discount to utility rates. Revenue comes from subscriber payments. Tax credits and SRECs are retained by the developer or monetized through tax equity. This is the most common model and the one with the highest subscriber acquisition burden.
| Metric | Typical Range |
|---|---|
| Developer margin | 8–12% |
| Subscriber acquisition cost | $400–$600 per subscriber |
| Churn rate | 3–8% annually |
| Break-even subscribers | 60–70% of capacity |
Model 2: Anchor Tenant (Summit Ridge Energy, Nautilus Solar)
The developer pre-sells 60–80% of project capacity to a large commercial, municipal, or institutional buyer (the “anchor tenant”). The remaining capacity is sold to residential subscribers. The anchor tenant reduces subscriber acquisition risk and improves project bankability.
| Metric | Typical Range |
|---|---|
| Developer margin | 12–18% |
| Anchor tenant share | 60–80% of capacity |
| Residential subscriber share | 20–40% of capacity |
| Reduced acquisition cost | $150–$300 per residential subscriber |
Model 3: Utility Partnership (Xcel Energy, Con Edison pilots)
The utility itself offers community solar as a green tariff or add-on service. The utility manages subscriber enrollment, billing, and credit application. The developer builds and operates the project under a build-transfer or long-term service agreement.
| Metric | Typical Range |
|---|---|
| Developer margin | 6–10% |
| Subscriber acquisition cost | $0 (utility handles enrollment) |
| Contract structure | EPC + O&M or BTA |
| Risk profile | Lower margin, lower risk |
Leading Community Solar Developers 2026
| Company | Market Position | Key 2025–2026 Activity |
|---|---|---|
| Nexamp | Leading community solar developer; 7% TPO market share | 300+ projects in 2024; $1B valuation; Microsoft partnership for ~300 MW |
| Summit Ridge Energy | Second-largest; 6.5% TPO share | 3+ GW nationwide; $290M MUFG facility; 553+ MW in Illinois |
| Clearway Energy Group | Major developer; utility + community solar | Active in solar + agrivoltaic projects; expanding community solar portfolio |
| Arcadia | Customer-facing platform + developer | Community solar subscription management; competing on pricing and technology |
| Nautilus Solar | Mid-size developer; Northeast focus | Projects in NY, MA, NJ; anchor tenant model specialist |
Sources: Solar Power World rankings; company press releases; SEIA market data.
Key Developer Risks
Subscriber churn: Community solar contracts allow cancellation with 60–90 days notice. Annual churn rates of 3–8% mean a project must continuously acquire new subscribers to maintain capacity utilization. High churn can destroy project economics.
Credit rate changes: When states reform VNM policies — as Maine did in 2025, cutting credit rates and triggering an 87% market contraction — existing subscriber savings evaporate and new subscriptions stall. Policy risk is the single biggest threat to community solar developers.
Interconnection delays: Community solar projects connect at the distribution level, but queue times have lengthened in saturated markets. Con Edison’s territory now sees 18–24 month interconnection timelines for new community solar projects.
Subscriber acquisition cost inflation: As community solar becomes more competitive, customer acquisition costs have risen. Digital marketing costs for solar leads increased 15–25% in 2024–2025 per industry estimates.
Equity and Low-Income Access Programs
Community solar’s most important social function is extending solar economics to households excluded from rooftop ownership. The equity programs built into state community solar frameworks are where this happens — and where the data shows both progress and gaps.
Low-Income Subscriber Growth
The share of community solar capacity serving low-to-moderate income households grew from 2% to 10% between 2022 and 2023 according to Wood Mackenzie data cited by CCSA. Costs to acquire LMI subscribers fell 30% in the same period, as developers refined outreach strategies and state programs added dedicated funding.
| Year | LMI Share of Community Solar | LMI Subscriber Acquisition Cost Trend |
|---|---|---|
| 2021 | ~1% | Baseline |
| 2022 | 2% | High (pilot programs) |
| 2023 | 10% | −30% YoY |
| 2024 | 12–15% | Stable |
| 2025 (est.) | 15–18% | Slight decline |
| 2026 (target) | 20%+ | Continued improvement |
Sources: Wood Mackenzie Community Solar Market Outlook (2024); CCSA policy analysis; NREL equitable access review.
EPA Solar for All Competition
The $7 billion EPA Solar for All competition, awarded in 2024, is the single largest investment in low-income solar access in US history. Sixty state, tribal, and local recipients received awards ranging from $25 million to $500 million to expand community solar and rooftop solar access for LMI households.
Key program features:
- 100% LMI targeting: All projects funded under Solar for All must serve LMI households
- Subscription assistance: Funds can cover subscription fees, reducing or eliminating subscriber costs
- Technical assistance: Grants support community-based organizations in outreach and enrollment
- Grid resilience: Priority for projects that improve grid resilience in disadvantaged communities
The first Solar for All projects are expected to come online in 2026–2027, with peak deployment in 2028–2029. CCSA estimates Solar for All could add 2–3 GW of LMI-focused community solar capacity by 2030.
State LMI Program Comparison
| State | LMI Target | Mechanism | Annual Household Savings (LMI) |
|---|---|---|---|
| DC | 100% | Free subscriptions for eligible households | $200–$400 |
| New York | 40% carve-out | Guaranteed 20% bill reduction | $200–$350 |
| Maryland | 30% carve-out | 25% savings guarantee | $150–$250 |
| Massachusetts | Low-income adder | Enhanced credit rate | $250–$400 |
| Illinois | 25% equity-eligible | Sliding scale | $100–$200 |
| Colorado | 5% minimum | Low-income dedicated projects | $100–$180 |
Sources: State program administrator reports; EPA Solar for All award documentation; NREL equitable access dataset.
The Equity Gap That Remains
Despite progress, significant gaps remain. Community solar subscribers are still disproportionately white, college-educated, and English-speaking. A 2024 NREL review found that LMI participation rates vary dramatically by outreach method: projects marketed through community-based organizations achieve 3–5x higher LMI enrollment than projects marketed through digital channels alone.
The implication for developers: LMI subscriber acquisition is not a marketing problem solved by Facebook ads. It is a trust problem solved by community partnerships, multilingual outreach, and enrollment processes that do not require credit scores or long-term contracts.
Pro Tip — Designing for LMI Subscriber Success
Developers targeting LMI subscribers should partner with community-based organizations (CBOs) rather than relying on digital marketing alone. CBO partnerships increase LMI enrollment 3–5x. Eliminate credit checks where possible — many LMI households have thin credit files. Offer prepaid subscription options rather than monthly billing for households without bank accounts. And provide materials in Spanish, Mandarin, and other languages spoken in the project community. The developers who get this right will have a structural advantage as LMI carve-outs increase.
For Spain-specific information, see Hotel Solar + EV Charging Case Study.
2027–2030 Outlook — Where Community Solar Grows
The community solar outlook for 2027–2030 depends on a single variable: whether new states enact enabling legislation. The existing market is maturing. Growth must come from expansion.
Base Case: Modest Contraction Without New Programs
SEIA and Wood Mackenzie’s base case projects 5% average annual contraction through 2030. Under this scenario:
- Cumulative capacity reaches 8.5–9.5 GW by 2030
- Annual additions fall to 500–700 MW
- Subscriber households plateau at 5.5–6 million
- New York and Illinois continue to dominate but with slowing growth
This is not a collapse. It is a maturation. Community solar becomes a steady-state segment serving 5–6 million households with predictable, modest savings.
Upside Case: New State Programs + Solar for All
If proposed legislation passes in Pennsylvania, Michigan, Wisconsin, and Virginia — and if Solar for All deploys 2–3 GW of LMI-focused capacity — the outlook improves materially:
- Cumulative capacity reaches 12–15 GW by 2030
- Annual additions stabilize at 800–1,200 MW
- Subscriber households reach 7–8 million
- LMI share of subscribers rises to 25–30%
Key Variables to Watch
| Variable | Bullish Signal | Bearish Signal |
|---|---|---|
| State legislation | PA, MI, WI enact community solar laws | No new states pass enabling legislation in 2026–2027 |
| Federal policy | Solar for All funding expands | EPA funding is reduced or reallocated |
| Utility rates | Retail rates rise 4–6% annually | Rate growth stalls or regulators cap increases |
| Credit mechanisms | More states adopt retail VNM | Existing states switch to avoided-cost credits |
| Interconnection | Queue times improve | Queue times extend beyond 24 months |
| Subscriber acquisition | CBO partnerships reduce CAC | Digital CAC inflation continues |
The European Comparison
For perspective on where US community solar could evolve, Germany’s Bürgerenergie and Mieterstrom models offer a glimpse. Germany’s 800–900 energy cooperatives manage over €2 billion in citizen-owned renewable assets. The Mieterstrom program allows landlords to supply solar power directly to tenants at discounted rates. These models achieve deeper market penetration than US community solar because they integrate ownership, supply, and consumption in a single legal framework. Also see: Germany solar subsidies. For Germany-specific information, see Multi-Family Residential Solar Case Study.
The US is unlikely to replicate Germany’s cooperative model — the legal and financial infrastructure differs too much. But the principle of integrating community solar with local economic participation is transferable. Programs that give subscribers an ownership stake, rather than just a subscription, may be the next evolution. For Germany-specific information, see Residential Solar ROI Case Study Germany.
For the European context, see our guides to community solar projects in Germany and European solar incentives. Also see: European Solar Tax Credits.
Conclusion
Community solar in 2026 is a maturing market with a clear value proposition and significant structural challenges. The 6.2 GW of cumulative capacity and 4.8 million subscriber households represent real progress in democratizing solar access. But the market’s heavy concentration in two states, the modest absolute savings for subscribers, and the 5% annual contraction risk through 2030 are realities that bullish coverage often obscures.
The most important insight: community solar is not a substitute for rooftop solar. It is a parallel pathway that serves a different, larger customer base. Renters, apartment dwellers, and low-income households — households that rooftop solar will never reach at scale — are the core market. Policy design should treat community solar and rooftop solar as complementary programs with complementary customer segments.
Three actions for 2026:
-
For subscribers: Check whether your state has an active community solar program with retail-rate credits. If you are in NY, MA, IL, MD, or MN, community solar likely offers genuine savings. If you are in CA or a state with avoided-cost credits, the economics are marginal — verify the numbers before signing.
-
For developers: Diversify beyond New York and Illinois. The pipeline constraints in saturated markets will compress margins. Pennsylvania, Michigan, and Wisconsin represent the next expansion wave if legislation passes. Build CBO partnerships now for LMI subscriber acquisition — the carve-out requirements are only increasing.
-
For policymakers: Treat community solar and rooftop solar as complementary, not competing. Retail-rate virtual net metering is the policy mechanism that makes community solar work. Avoided-cost credits produce programs that exist on paper but attract no subscribers. And mandate LMI carve-outs — the data shows they work, and the cost to serve LMI subscribers is falling.
For solar professionals designing proposals across market segments, solar design software with integrated financial modeling for both rooftop and community solar projects streamlines the multi-scenario analysis that wins deals. For the broader commercial solar context, see our commercial solar market outlook 2026 analysis.
For developers managing multiple projects, solar software with community solar-specific financial modeling simplifies subscriber credit tracking and scenario planning across state programs.
Frequently Asked Questions
How big is the US community solar market in 2026?
The US community solar market reached approximately 6.2 GW of cumulative installed capacity by early 2026, with over 4.8 million subscriber households across 44 states and DC. SEIA and Wood Mackenzie project 12% growth in 2026 installations versus 2025, with the market expected to reach 15 GW cumulative by 2029. New York and Illinois together represent 68% of national installation volume.
How much can community solar subscribers save on electricity bills?
Community solar subscribers typically save 5–20% on their annual electricity costs, with most programs offering fixed discounts of 10–15% off the value of solar bill credits. A typical residential subscriber in New York or Illinois saves $100–$300 annually. Low-income subscribers in programs with dedicated carve-outs often see higher savings rates of 15–25%, with some state programs guaranteeing 20% bill reductions for LMI households. Savings are realized through virtual net metering credits that appear on the regular utility bill.
Which states have the best community solar programs in 2026?
New York leads with 52% of national capacity additions in Q1 2025 and the largest cumulative fleet. Illinois ranks second with strong growth under the Illinois Shines program. Massachusetts has one of the most mature programs via SMART 3.0 with robust LMI provisions. Maryland posted record growth in 2025 (up 13% year-over-year). Minnesota and Colorado have well-established programs with high subscriber participation. Maine’s program contracted 87% in 2025 due to policy changes. New Jersey grew 31% under CSEP. Twenty-four states plus DC have enabling legislation; 20 of those include low-income provisions.
What is virtual net metering and how does community solar billing work?
Virtual net metering (VNM) is the billing mechanism that allows community solar subscribers to receive credits for energy produced by their share of an off-site solar farm. Subscribers receive two bills monthly: one from their utility and one from their community solar provider. The utility bill shows reduced charges due to solar credits. The subscriber pays the community solar provider for those credits at a discounted rate — typically 90–95 cents on the dollar. If production exceeds consumption in a given month, excess credits roll over. Savings are realized annually rather than monthly due to seasonal production variation.
Can renters participate in community solar?
Yes — renters are a primary target market for community solar. Unlike rooftop solar, community solar requires no property ownership, no roof access, no installation, and no upfront cost. A 2024 Lawrence Berkeley National Lab study found community solar subscribers are 4x more likely to rent than rooftop solar adopters and earn 23% less annual income. Renters sign a subscription agreement with a community solar provider, receive bill credits on their existing utility account, and can typically cancel with 60–90 days notice.
What are the main business models for community solar developers?
Community solar developers operate under three primary business models. The subscription model (most common) sells individual household subscriptions at a fixed discount to utility rates, with the developer retaining tax credits and SREC revenue. The anchor tenant model pre-sells 60–80% of project capacity to a large commercial or municipal buyer, reducing subscriber acquisition risk. The utility partnership model works directly with the utility to offer community solar as a green tariff or add-on service. Developer margins range from 8–15% on subscription models, 12–18% on anchor tenant structures, and 6–10% on utility partnerships.
How does community solar differ from rooftop solar?
Community solar and rooftop solar serve different customer segments and operate on different economics. Rooftop solar requires property ownership, suitable roof space, and upfront capital or financing. Community solar requires none of these — it is available to renters, apartment dwellers, and those with shaded or unsuitable roofs. Rooftop solar typically delivers higher absolute savings (20–40% of electricity costs) but requires a 6–10 year payback period. Community solar delivers lower per-kWh savings (5–20%) but with zero upfront cost and no payback period. The two are complements, not substitutes — community solar expands the addressable market to households excluded from rooftop ownership.
What is the community solar outlook for 2027 to 2030?
SEIA and Wood Mackenzie project US community solar will reach 15 GW cumulative by 2029, with an average annual contraction of 5% through 2030 in the base case. However, this conservative forecast excludes proposed legislation in multiple states, creating significant upside potential. Key growth drivers include the $7 billion EPA Solar for All competition expanding LMI access, new state enabling laws, and the four-year construction window for safe-harbored equipment. The development pipeline exceeds 9 GWdc. Risks include slowing growth in top markets, interconnection delays, and the absence of new statewide programs in 2025.
Sources:
- SEIA / Wood Mackenzie US Solar Market Insight Q4 2025 and Q1 2026
- NREL Sharing the Sun: Community Solar Deployment Dataset
- Coalition for Community Solar Access (CCSA) Market Analysis
- EnergySage Community Solar Marketplace
- Lawrence Berkeley National Lab — Review of Equitable Access and Household Savings (2024)
- US Department of Energy — Community Solar Market Trends
- EPA Solar for All Competition
- Wood Mackenzie US Solar Market Insight Solar proposal software generates professional quotes in minutes.


