A 500 kWp commercial solar system generating 480,000 kWh per year should be generating exactly that - not 390,000 kWh because a combiner fuse failed in month three, a string inverter tripped on over-temperature in summer, and soiling on the east wing went uncleaned for nine months. Without monitoring, all of those losses are invisible until the annual yield report arrives. By then, the revenue gap is permanent. This chapter covers everything needed to monitor a commercial solar system properly: what to measure, how the data flows, which protocols connect the devices, what SCADA adds beyond basic logging, and how to select the right platform for the scale of project you're managing.
What you'll learn in this chapter
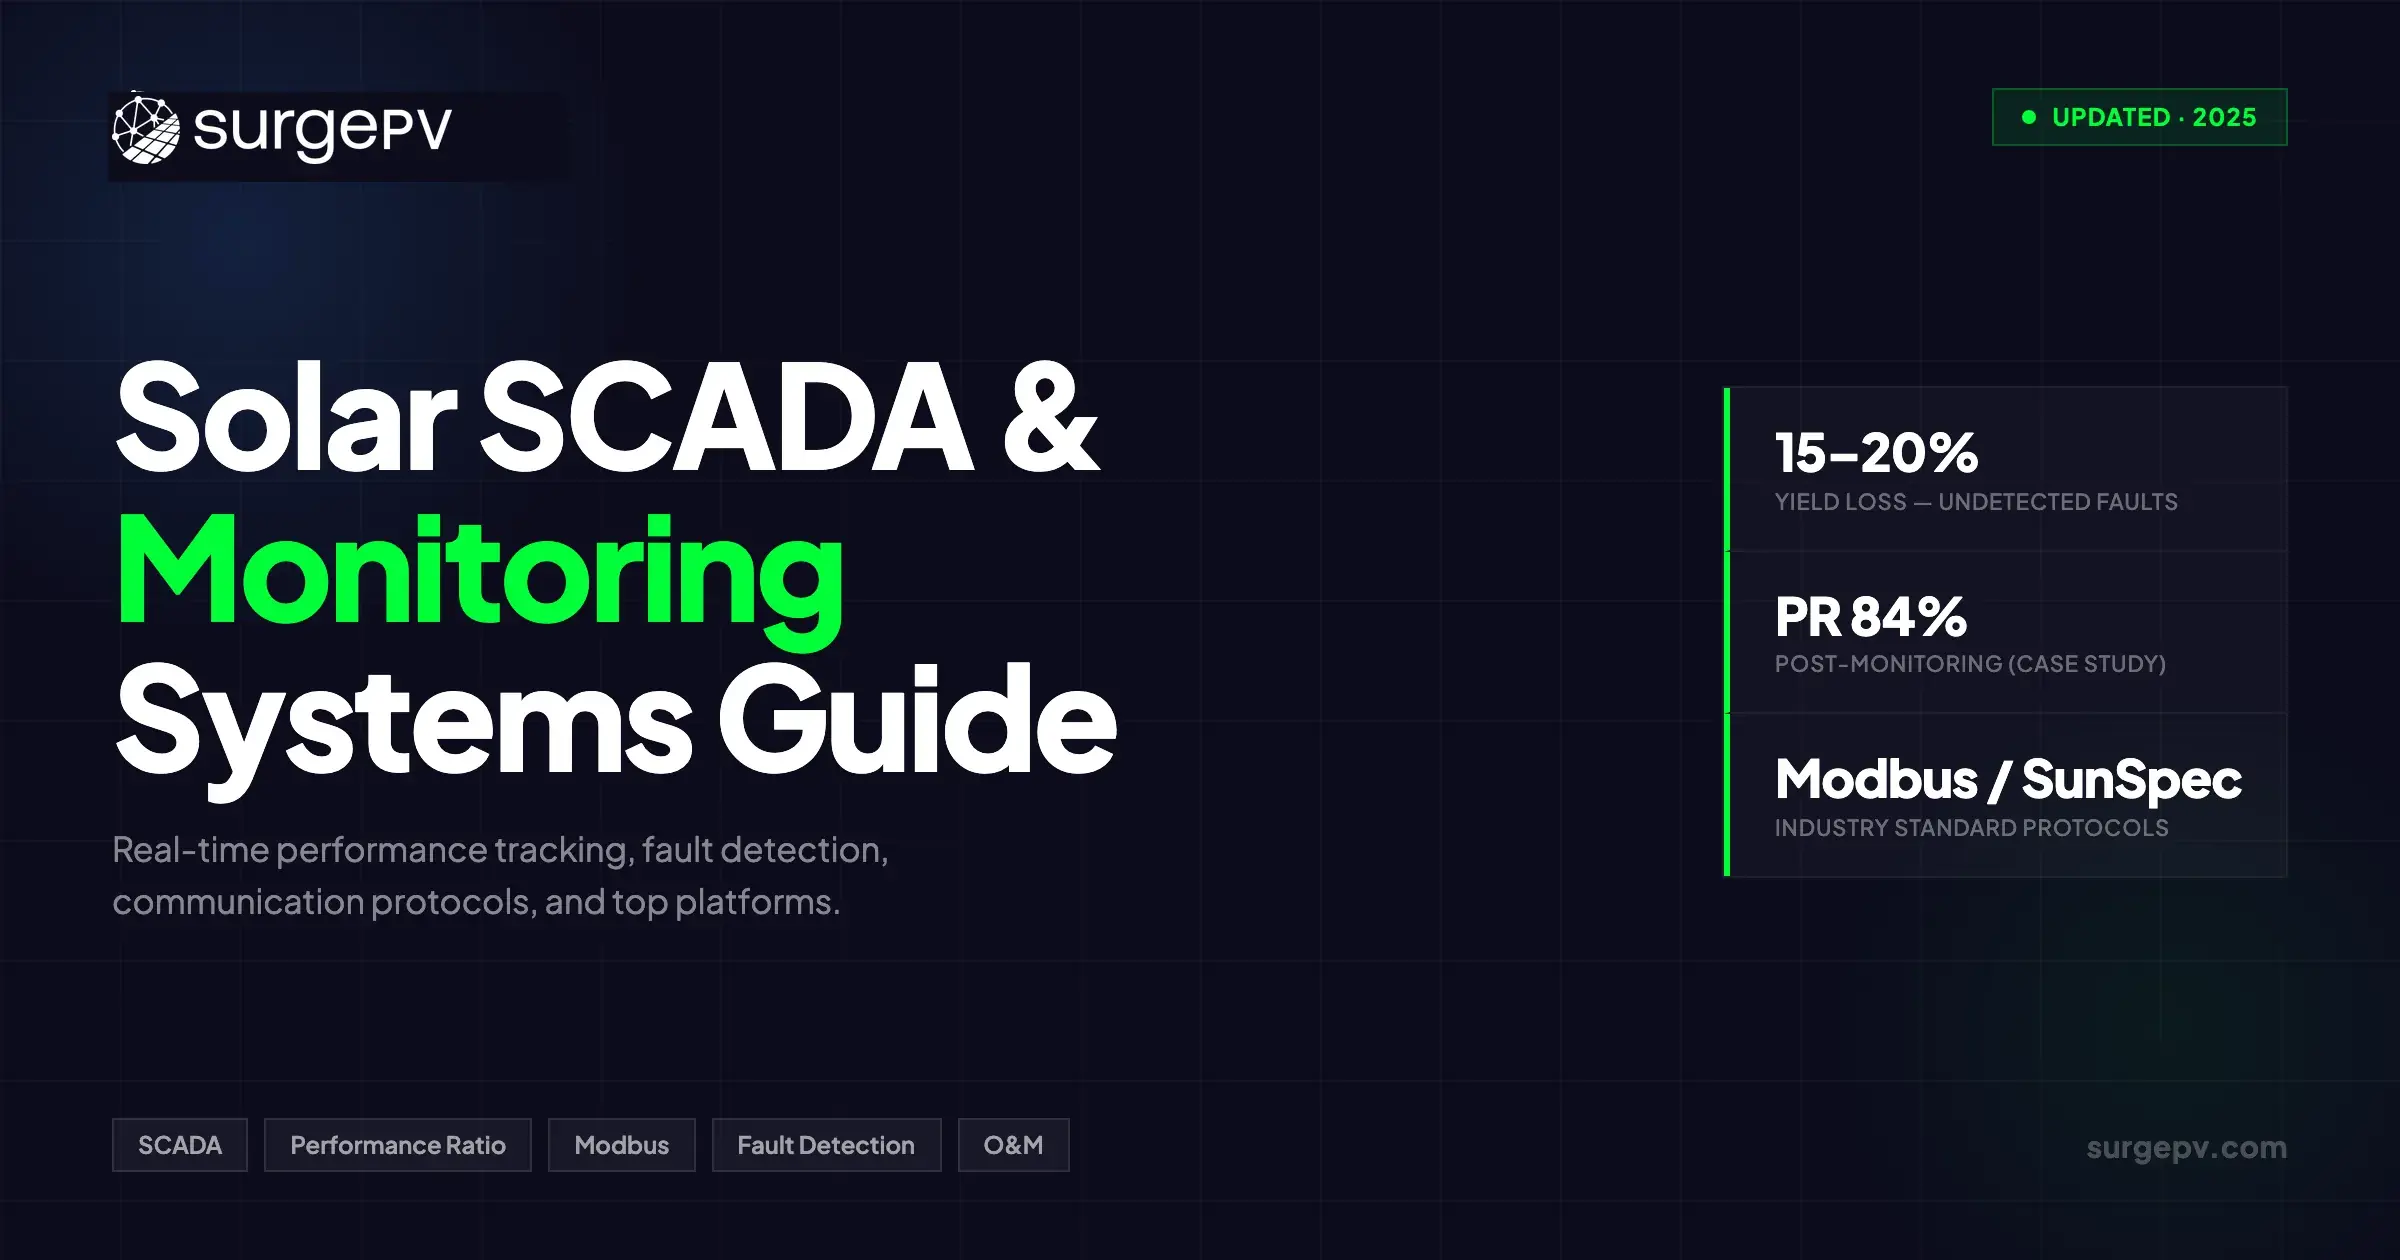
- Why monitoring matters and what yield losses undetected faults cause
- The four-layer monitoring architecture from sensors to cloud
- What parameters to monitor and at what frequency
- Communication protocols: Modbus RTU/TCP, SunSpec, RS-485, cellular, LoRaWAN
- What SCADA adds beyond basic monitoring
- Performance metrics: PR, CUF, Specific Yield, Availability, and TLPF
- Fault detection categories and typical alarm thresholds
- Top monitoring platforms compared: SolarEdge, iSolarCloud, AlsoEnergy, open-source
- Data logger hardware options
- How monitoring integrates with O&M and EPC yield obligations
Why Commercial Solar Monitoring Matters
The financial case for monitoring is straightforward. Commercial solar systems are capital assets costing €400–900 per kWp, with 20–25 year design lives and yield guarantees attached to EPC contracts and project finance debt. A system that underperforms by 15% annually on a 500 kWp plant at €0.28/kWh electricity displacement loses approximately €20,000 per year. Over 25 years, that's €500,000 in unrecovered value - from faults that continuous monitoring would have caught within hours.
Industry data from O&M service providers consistently shows that unmonitored commercial PV systems suffer 15–20% higher yield losses than continuously monitored systems. The losses come from predictable fault categories: string disconnections, inverter faults, soiling, inverter clipping from poor configuration, and AC-side issues at the point of connection. None of these are visible without data.
The Cost of Not Monitoring
- String fault (1 string of 20 down): 5% yield loss per month, undetected for 3 months = 1.25% annual yield loss
- Inverter over-temperature derating (summer): 8–12% clipping during peak generation hours
- Soiling on 30% of array (no cleaning schedule): 3–7% annual yield reduction depending on location
- Combiner fuse failure (half the array offline): 50% yield loss on affected zone - potentially undetected for weeks without string-level monitoring
- Grid curtailment at 100% without visibility: Operator cannot verify losses or dispute DNO billing
Monitoring also fulfils contractual obligations. EPC yield guarantees require verified performance data - typically from revenue-grade meters (IEC 62053-22 class 0.5S or better) and irradiance sensors - to calculate Performance Ratio against which any guarantee claim is assessed. Without certified monitoring data, neither the client nor the EPC can quantify shortfalls or trigger guarantee remediation.
What to Monitor: Key Parameters
Commercial PV monitoring systems measure parameters across three domains: DC generation (string and array level), AC output (inverter and grid connection), and environmental (irradiance, temperature, wind). The table below lists the critical parameters, measurement source, and recommended sampling interval.
| Parameter | Source Device | Sampling Interval | Why It Matters |
|---|---|---|---|
| DC string current (per string) | String combiner box / inverter MPPT | 5 min | Identifies individual string faults, mismatch, partial shading anomalies |
| DC string voltage | Inverter MPPT input | 5 min | Detects open-circuit conditions, ground faults, module degradation |
| AC power output (kW) | Inverter / AC meter | 1–5 min | Primary generation metric; basis for PR calculation |
| AC energy yield (kWh) | Revenue-grade meter | 15 min (cumulative) | Financial settlement, yield guarantee verification |
| Inverter internal temperature | Inverter sensor | 5 min | Identifies over-temperature derating; ventilation issues |
| Module temperature | PT100 sensor on module rear | 5 min | Temperature coefficient correction for PR calculation |
| Plane-of-array irradiance (W/m²) | Class A pyranometer or Si reference cell | 1–5 min | Core input to PR and yield loss analysis; IEC 61724 requirement |
| Ambient temperature | Weather station | 5 min | NOCT module temperature correction; site weather correlation |
| Wind speed | Anemometer | 5 min | Correlates with soiling events; structural load monitoring |
| Grid voltage / frequency | Inverter or meter | 5 min | Grid compliance, under/over-voltage trips, power quality |
| Reactive power (kVAr) | Grid meter | 5 min | Grid operator compliance for cos φ obligations above 250 kWp |
Pro Tip
For EPC yield guarantee compliance, use a Class A thermopile pyranometer (Kipp & Zonen CMP-series or equivalent) rather than a silicon reference cell. Reference cells are faster to install but their spectral response characteristics mean they measure inaccurately under diffuse irradiance conditions - which can bias PR calculations by 1–3% in cloudy northern European climates.
Monitoring System Architecture
Commercial PV monitoring systems follow a four-layer architecture: sensors and measurement devices at field level, data loggers that aggregate device data, a communication layer that transmits data to a central platform, and a cloud or on-premise platform for storage, visualisation, and analysis.
Layer 1 - Sensors and Field Devices
This layer includes inverters (which self-report via Modbus), string combiner boxes with integrated current measurement, module temperature sensors (typically PT100 or NTC thermistors), irradiance sensors, and grid meters. In micro-inverter or module-level power electronics (MLPE) systems, each panel or pair of panels has its own monitoring point - approximately 1,200 data streams for a 500 kWp system with 500W panels and MLPEs.
Layer 2 - Data Loggers
Data loggers sit between field devices and the communication network. They poll inverters and sensors on short intervals (1–5 minutes), store data locally (typically 90 days of onboard storage as buffer against connectivity loss), and transmit aggregated data upstream. Hardware loggers (Campbell Scientific, Fronius Datamanager, Kipp & Zonen Meteo-40) serve large commercial and utility applications. For smaller systems (under 250 kWp), inverter manufacturers often provide an integrated data logger within the inverter or gateway device.
Layer 3 - Communication
The communication layer transmits data from the site to the cloud platform. Local area network (LAN/Ethernet) is standard where the site has broadband. Cellular (4G/LTE) is used for remote sites or as redundant backhaul. LoRaWAN suits sites with many distributed sensors but low data bandwidth requirements. The communication protocol between data logger and cloud platform is typically MQTT, HTTP/REST API, or a proprietary vendor protocol.
Layer 4 - Cloud Platform / SCADA
The top layer stores time-series data, applies performance calculations, generates alarms, and presents dashboards to operators and owners. This is where the distinction between basic monitoring and full SCADA becomes relevant - covered in detail in the SCADA section below.
Key Design Rule
Always specify local data logger storage sufficient for at least 30 days of full-resolution data. Site connectivity outages are common - particularly on cellular connections - and losing data during a connectivity gap means permanent gaps in performance records, which can affect yield guarantee assessments.
Communication Protocols
The choice of communication protocol determines interoperability between inverters, data loggers, and monitoring platforms. Understanding the landscape avoids costly lock-in decisions at the design stage.
Modbus RTU (RS-485)
Modbus RTU over RS-485 serial bus is the dominant protocol for inverter-to-datalogger communication in commercial PV. It is a master-slave protocol: the data logger (master) polls each inverter (slave) sequentially, reading specific register addresses that contain power, voltage, current, temperature, and fault status data. RS-485 physical layer supports up to 32 devices on a single bus segment (extendable with repeaters) over cable runs up to 1,200 m. Baud rates are typically 9,600 or 19,200 bps - sufficient for polling 20–30 inverters at 5-minute intervals.
Modbus TCP/IP
Modbus TCP wraps the Modbus protocol in standard TCP/IP packets, enabling inverter polling over Ethernet or Wi-Fi. Modern string inverters from SMA, Sungrow, and Huawei support Modbus TCP natively, enabling direct integration with site Ethernet networks without RS-485 wiring. Modbus TCP is preferred for large commercial sites where LAN infrastructure is already in place.
SunSpec Alliance
SunSpec standardises Modbus register maps across different inverter manufacturers. Before SunSpec, each manufacturer used proprietary register addresses - connecting a SMA inverter required a different logger configuration than a Sungrow inverter. SunSpec defines a common set of device information, measurement, and control registers that a compliant device must implement. As of 2025, SunSpec certification covers over 300 inverter models from 40+ manufacturers. This is important for EPC contractors who work with multiple inverter brands across their project portfolio.
MQTT
MQTT (Message Queuing Telemetry Transport) is a lightweight publish-subscribe protocol designed for IoT applications with unreliable connectivity. Data loggers publish sensor readings to an MQTT broker (typically cloud-hosted), and monitoring platforms subscribe to the relevant topics. MQTT's low overhead makes it well-suited for cellular-connected sites where data costs and bandwidth constraints apply. Many modern industrial data loggers support MQTT as their primary upstream protocol.
| Protocol | Physical Layer | Use Case | Max Devices / Range | Standardisation |
|---|---|---|---|---|
| Modbus RTU | RS-485 serial | Inverter → data logger (field level) | 32 per segment / 1,200 m | Modbus Organisation |
| Modbus TCP/IP | Ethernet / LAN | Inverter → data logger (Ethernet) | Unlimited (IP-based) | Modbus Organisation |
| SunSpec | Modbus RTU or TCP | Multi-vendor inverter interop | Same as Modbus | SunSpec Alliance |
| MQTT | TCP/IP (Ethernet or cellular) | Data logger → cloud platform | Unlimited | OASIS (ISO/IEC 20922) |
| 4G/LTE cellular | Mobile network | Remote site backhaul | N/A (SIM-based) | 3GPP |
| LoRaWAN | Sub-GHz radio | Low-power sensors, no cellular coverage | 1,000+ nodes / 10–15 km | LoRa Alliance |
Design Commercial Solar Projects That Perform
SurgePV's design and financial tools help EPCs model monitoring requirements, yield expectations, and performance guarantees before the project is built.
Book a Free DemoNo commitment required · 20 minutes · Live commercial project walkthrough
SCADA for Commercial Solar
Basic monitoring records what a system generates. SCADA (Supervisory Control and Data Acquisition) adds control: the ability to send commands back to field devices, execute automated logic, and integrate with grid operator requirements. The distinction matters for projects above 500 kWp, where grid operators typically impose active power control, reactive power regulation, and curtailment obligations that require remote-controllable inverters under a SCADA system.
What SCADA Adds Beyond Basic Monitoring
- Active power curtailment: Grid operators can issue curtailment signals (typically via IEC 61850 GOOSE messages or direct Modbus/DNP3 commands) requiring the plant to reduce output to a specified percentage. SCADA receives the command and distributes proportional power setpoints to individual inverters in real time.
- Reactive power control: Commercial plants above 250 kWp in Germany (and comparable thresholds across EU markets) must maintain a specified power factor or reactive power setpoint. SCADA automates this based on grid measurement, removing the need for manual inverter configuration changes.
- PLC integration: Programmable Logic Controllers (PLCs) handle time-critical switching logic - fault isolation, anti-islanding, protection relay actuation - that SCADA software coordinates at the supervisory level.
- Multi-site aggregation: A portfolio operator managing 20 commercial sites can view all plants in a single SCADA dashboard, with fleet-level KPIs (total MW online, fleet PR, alarm count) and drill-down to individual site or inverter level.
- Historical trend analysis: SCADA stores years of 5-minute data and enables correlation analysis - e.g., identifying that PR on Site 7 degrades every summer when ambient temperature exceeds 35°C, pointing to inverter derating that could be addressed with improved ventilation.
- Automated O&M ticketing: When an alarm fires (string current below threshold, inverter offline), SCADA can automatically create a maintenance ticket in an external CMMS (Computerised Maintenance Management System) and route it to the responsible O&M team.
When Do You Need SCADA vs. Basic Monitoring?
- Under 100 kWp: Inverter manufacturer cloud portal (SolarEdge, Fronius, SMA Sunny Portal) is sufficient in most cases
- 100–500 kWp: Third-party monitoring platform with 5-minute data, string-level visibility, and alarm routing
- 500 kWp – 5 MWp: Full SCADA recommended; mandatory if grid operator imposes active power or reactive power obligations
- 5 MWp+: Full utility-grade SCADA with IEC 61850 compliance, PLC integration, and redundant communication paths
Performance Metrics: PR, CUF, Specific Yield, Availability
Monitoring systems generate data; performance metrics translate that data into actionable intelligence. Every commercial monitoring platform should calculate and report these five standard metrics defined in IEC 61724.
| Metric | Formula / Definition | Target Range | What Low Values Indicate |
|---|---|---|---|
| Performance Ratio (PR) | PR = Actual kWh ÷ (Irradiance kWh/m² × Installed kWp) | 78–82% (temperate climates) | Faults, soiling, shading, inverter derating, clipping |
| Capacity Utilisation Factor (CUF) | CUF = Annual kWh ÷ (Installed kWp × 8,760 hours) | 12–18% (central Europe); 18–24% (Southern Europe) | Below-expected irradiance or persistent system faults |
| Specific Yield | kWh/kWp/year = Annual generation ÷ Installed kWp | 850–1,000 (UK/Germany); 1,200–1,600 (Italy/Spain) | System underperformance versus site irradiance potential |
| System Availability | Uptime % = (8,760 − hours offline) ÷ 8,760 × 100 | 98.5–99.5% | Communication loss, inverter faults, grid outages |
| TLPF (Total Loss and Performance Factor) | Decomposition of PR losses: soiling, thermal, wiring, inverter, curtailment, downtime | Each loss component below its modeled budget | Identifies which specific loss category is responsible for underperformance |
PR is the most commonly cited KPI in commercial solar, but it can be misleading without temperature correction. A system in Munich with a summer module temperature of 60°C will show a lower PR than the same system in winter - not because it is underperforming, but because temperature losses are real physics. Temperature-corrected PR (sometimes called PRc or energy-weighted PR) applies a correction factor based on module temperature coefficient (typically −0.35 to −0.45%/°C for mono-PERC) to give a fair comparison across seasons and climates.
Pro Tip
Report monthly PR alongside monthly irradiance as a pair. A month with low irradiance and high PR is not necessarily better performance than a month with high irradiance and lower PR - what matters is actual kWh generated versus the site's irradiance potential. Separating irradiance availability from system performance in reporting prevents misinterpretation of seasonal variation as a system problem.
Fault Detection and Alarm Management
The value of monitoring is realised through its fault detection capability. A monitoring system that records data but generates no actionable alarms is a liability - it creates the illusion of oversight without the substance. Commercial monitoring platforms should be configured with alarm thresholds across four fault categories.
String Faults
String-level current monitoring is the most granular and most valuable fault detection layer for commercial systems. A string fault - open-circuit module, failed bypass diode causing a hotspot, corroded MC4 connector, blown fuse - typically causes a single string's current to drop to zero or to a fraction of adjacent strings. The alarm threshold is usually set at a deviation of more than 10–15% from the median string current across the same inverter MPPT input, during irradiance above 300 W/m².
Inverter Faults
Inverter manufacturers transmit fault codes via Modbus that map to specific fault conditions: DC over-voltage, AC grid fault, over-temperature, insulation resistance below threshold, GFDI (Ground Fault Detection Interrupter) trip. Monitoring platforms translate these proprietary codes into human-readable alarm descriptions and priority levels. Critical faults (inverter offline) warrant immediate notification; warning-level faults (elevated temperature approaching trip threshold) warrant same-day investigation.
Communication Loss
When a data logger or inverter stops reporting, the monitoring platform cannot distinguish between a communication fault and a generation fault. Both look identical as a data gap. Best practice is to set a communication alarm threshold of 15–30 minutes of missing data, with escalation to a separate alert if the gap extends beyond 4 hours. On-site local data logging with buffered storage ensures no data is permanently lost even when communication is interrupted.
Performance Alarms (Soiling Index, PR Deviation)
Beyond discrete faults, gradual performance degradation from soiling, module degradation, or slow shading growth (vegetation, adjacent construction) requires performance-based alarms. A common approach is to compare the current 7-day average PR against the rolling 90-day baseline PR - if the deviation exceeds 5%, a performance alarm is triggered. This catches soiling accumulation that builds over weeks but would never trigger a string-level fault alarm.
| Alarm Category | Trigger Condition | Typical Threshold | Response Priority |
|---|---|---|---|
| String offline | String current = 0 during daylight (irradiance >300 W/m²) | Current below 5% of rated | High - same-day investigation |
| String mismatch | String current deviates >15% from adjacent strings | 15% deviation over 30+ min | Medium - investigate within 48 h |
| Inverter fault (critical) | Inverter offline or critical fault code | Missing AC output >15 min | High - immediate notification |
| Inverter over-temperature | Internal temperature approaching trip setpoint | Within 10°C of trip threshold | Medium - same-day review |
| Communication loss | No data from logger or inverter | 30 min data gap | Medium - verify connectivity |
| PR deviation | 7-day PR below rolling baseline by >5% | 5% below 90-day moving average | Low - schedule inspection |
| Grid fault / curtailment | Unexpected AC power reduction at grid connection point | Output below expected >10% | Medium - verify grid connection |
Top Commercial Solar Monitoring Platforms
The market for commercial solar monitoring software divides into three segments: inverter manufacturer platforms, independent third-party commercial SCADA/monitoring platforms, and open-source stacks. The right choice depends on inverter brand diversity, portfolio scale, grid operator reporting requirements, and integration needs.
| Platform | Type | Best For | Key Strengths | Limitations |
|---|---|---|---|---|
| SolarEdge Monitoring | Manufacturer portal | SolarEdge inverter fleets, module-level monitoring | Module-level data (power optimisers), string-level IV curves, built-in fleet view | SolarEdge inverters only; limited SCADA/control features |
| Sungrow iSolarCloud | Manufacturer portal | Sungrow inverter projects, Asia-Pacific deployments | Strong mobile app, multi-site aggregation, fault alerting, free for Sungrow hardware | Sungrow inverters only; limited third-party device integration |
| SMA Sunny Portal | Manufacturer portal | SMA inverter projects, EU residential/commercial | Long track record, reliable data logging, Speedwire and Modbus support | SMA inverters only; fewer advanced analytics than third-party platforms |
| AlsoEnergy (Trimark) | Independent commercial SCADA | Multi-brand portfolios, utility-scale, US/EU commercial | Multi-brand inverter support, SCADA control, revenue-grade metering integration, advanced analytics | Higher cost; implementation complexity for smaller systems |
| Power Factors (formerly Powerflex) | Independent commercial SCADA | Large commercial / utility-scale, C&I, EV charging integration | AI-based analytics, demand response, EV/BESS integration, strong US market presence | Primarily US-focused; enterprise pricing |
| Solar-Log | Independent monitoring | European C&I, multi-brand, mid-scale commercial | Wide device compatibility (800+ inverter models), good EU regulatory reporting | Dashboard UI less modern than cloud-native platforms |
| Grafana + InfluxDB (open-source) | Open-source stack | Technical operators, custom integrations, cost-sensitive deployments | Fully customisable dashboards, no per-site license cost, excellent multi-site support | Requires technical setup and ongoing maintenance; no support SLA |
| pvoutput.org | Community platform | Small commercial, community benchmarking | Free, simple, public/private data sharing, benchmarking against similar systems | Not suitable for commercial O&M; limited features; public data exposure |
Pro Tip
For EPCs and O&M providers managing mixed-brand inverter portfolios, platform-agnostic monitoring via SunSpec-compliant data loggers (such as Campbell Scientific or Meteo-40) gives you full flexibility to switch cloud platforms without re-cabling the field layer. Avoid architecture decisions that lock inverter communication to a single manufacturer's proprietary gateway.
Data Logger Hardware
The data logger is the site's ground-truth recorder. It should be specified with the same care as the inverter or mounting system - a logger failure means data gaps that may affect yield guarantee assessments and O&M response times.
| Data Logger | Manufacturer | Typical Application | Key Specs |
|---|---|---|---|
| CR1000X | Campbell Scientific | Large commercial, utility-scale, bankable projects | Analogue + digital I/O, RS-485, Ethernet, 4G modem option, IP54 rated, programmable measurement sequences |
| Meteo-40L/S | Kipp & Zonen | Met station integration, IEC 61724 compliance | Designed for meteorological sensors; RS-485, Modbus, Ethernet; IEC 61724-1 compliant; 4 GB onboard storage |
| Fronius Datamanager 2.0 | Fronius | Fronius inverter systems, commercial rooftop | Integrated in Fronius inverter; Modbus TCP, SunSpec, LAN; free Fronius Solar.web integration |
| Solar-Log 2000 | BKW Solar-Log | Multi-brand commercial systems up to 50 MW | 800+ device protocols; Modbus, SunSpec, proprietary; RS-485, Ethernet, 4G; EU regulatory export formats |
| Huawei SmartLogger 3000 | Huawei | Huawei inverter systems, utility and large commercial | Modbus RS-485 and TCP; supports 80 inverters per logger; 4G/Ethernet; direct integration with FusionSolar |
| Raspberry Pi + Node-RED | Open-source / DIY | Small commercial, R&D, cost-minimised deployments | Fully customisable; RS-485 via USB adapter; MQTT upstream; no onsite support; suitable for technically managed sites only |
Monitoring for O&M and Yield Guarantees
Monitoring data is the primary evidence base for commercial solar O&M contracts and EPC yield guarantees. Getting the monitoring system specification right during design - before the project is built - avoids expensive disputes later.
EPC Yield Guarantees
EPC yield guarantees typically specify a minimum annual energy yield (kWh) that the contractor guarantees for years 1–2 post-commissioning. If actual generation falls below the guarantee threshold, the EPC compensates the client for the shortfall at the agreed electricity value. Calculating whether a shortfall exists requires certified monitoring data: a revenue-grade meter (IEC 62053-22 Class 0.5S), a calibrated irradiance sensor traceable to WRR (World Radiometric Reference), and continuous data logging with no gaps longer than permitted by the contract (typically 48 hours maximum).
Preventive Maintenance Scheduling
Monitoring data drives preventive maintenance schedules on well-managed commercial sites. Soiling index derived from PR deviation triggers cleaning scheduling - rather than fixed quarterly cleaning regardless of soiling rate, which wastes cost in low-soiling periods and misses rapid soiling from agricultural or industrial activities adjacent to the site. Inverter temperature trend data informs ventilation maintenance and anticipates overheating before a fault trip occurs. String current trending identifies modules approaching end-of-life (gradual current decline over months) before they cause a string fault.
O&M Contract KPIs
Commercial O&M contracts typically include uptime and response time SLAs that monitoring data verifies. Standard KPIs include:
- System availability: Minimum 98.5% uptime, measured as hours the system can generate versus hours it failed to generate when irradiance was available
- Alarm response time: Critical alarms acknowledged within 2 hours, on-site response within 24–48 hours
- PR guarantee: Minimum PR of 75–78% (location dependent), temperature-corrected, measured annually against a defined irradiance baseline
- Reporting: Monthly performance reports delivered within 5 business days of month-end, containing generation, PR, irradiance, and all alarm events with resolution records
Using solar design software with integrated performance simulation during the design phase lets EPCs model expected PR, CUF, and specific yield - the same metrics that monitoring will track post-commissioning. The closer the design model is to reality, the more defensible the EPC's yield guarantee position is when monitoring data is compared against projections.
Case Study: 500 kWp Industrial Roof, Germany - PR Improvement from 72% to 84%
A 500 kWp rooftop installation on a food processing facility near Nuremberg was commissioned in 2022 with basic inverter manufacturer monitoring (no string-level visibility). By mid-2023, the annual performance report showed generation of 456,000 kWh against a design projection of 520,000 kWh - a 12.3% shortfall against an EPC yield guarantee of 505,000 kWh, triggering a penalty clause.
The investigation revealed three contributing issues, none of which had been identified during the year of operation:
- String faults on the east array: 6 strings out of 40 on the east-facing roof section had open-circuit MC4 connectors - a manufacturing batch issue with UV-degraded seals. These strings had been generating at zero or near-zero output since early spring 2023. Combined effect: approximately 7.5% yield reduction on the east section, 3.2% overall.
- Inverter temperature derating: Four central inverters mounted in a south-facing equipment room without adequate cross-ventilation were entering thermal protection mode (output derating to 75% of rated power) for 2–4 hours on every peak summer generation day. The manufacturer platform showed inverter power data but did not flag the correlation with temperature. Effect: approximately 4% annual yield loss concentrated in June–August.
- Soiling on the flat roof centre section: Bird guano accumulation on a 120 m² section directly downwind of a rooftop HVAC exhaust created consistent partial shading and soiling on the affected strings. No cleaning visits had targeted this area specifically. Effect: approximately 2% annual yield loss.
Remediation involved: replacement of all 6 faulty MC4 assemblies, installation of louvre ventilation panels on the inverter room, and addition of a targeted quarterly cleaning protocol for the HVAC downwind zone. A third-party monitoring platform with string-level visibility was installed, with alarm thresholds set for string current deviation and inverter temperature.
In the 12 months following remediation, the system generated 519,000 kWh - just above the guarantee threshold - with a measured PR of 83.8%. The temperature-corrected PR improvement from 72% to 84% represented approximately €18,000 in recovered annual revenue at local grid electricity prices, with a monitoring system capex of under €8,000 including hardware, installation, and first-year platform subscription.
Key Lesson
All three faults in this case study were detectable within weeks of occurrence with string-level monitoring and appropriate alarm thresholds. The cost of 18 months of undetected underperformance - approximately €32,000 in lost revenue plus EPC penalty payments - far exceeded the cost of comprehensive monitoring at commissioning.
Frequently Asked Questions
What is SCADA in solar monitoring?
SCADA (Supervisory Control and Data Acquisition) in solar refers to software systems that collect real-time data from inverters, string combiner boxes, weather stations, and meters across a PV plant, then present that data in a centralised dashboard. Beyond basic monitoring, SCADA enables remote control actions - grid curtailment commands, reactive power setpoints, inverter restart - and integrates with alarms, historical trend analysis, and EMS logic. SCADA is standard for commercial systems above 500 kWp and mandatory for most utility-scale plants with grid operator reporting obligations.
What is a good Performance Ratio (PR) for a commercial solar system?
A Performance Ratio of 78–82% is typical for well-designed commercial PV systems in temperate climates (UK, Germany, Netherlands). Systems in hot climates show PR of 74–78% due to higher temperature losses. PR above 83% generally requires low-temperature environments or bifacial modules with rear-side gain. A PR below 72% in a new commercial system almost always indicates a fault: string mismatch, soiling, partial shading from an unmodeled obstruction, or inverter underperformance.
What communication protocol is used in solar monitoring?
Modbus RTU over RS-485 is the most widely used protocol for inverter-to-datalogger communication in commercial solar. Modbus TCP/IP is increasingly common for inverters connected directly to Ethernet. SunSpec Alliance has standardised Modbus register maps across most major inverter manufacturers, meaning a single datalogger can speak to SMA, Fronius, SolarEdge, Sungrow, and Huawei inverters using the same register addresses. For remote site backhaul, cellular (4G/LTE) with MQTT or HTTP APIs is standard.
How often should monitoring data be collected from a commercial solar system?
For commercial systems above 100 kWp, 5-minute data intervals are the standard for operational monitoring. Some SCADA platforms support 1-minute intervals for fault detection purposes - catching a string trip within 1 minute versus 5 minutes reduces yield loss on a 1 MW site by a meaningful margin. Revenue-grade metering for EPC yield guarantees typically operates at 15-minute intervals. Daily summary reports are sufficient for owner-operator review; 5-minute data is primarily for O&M teams and automatic alarm systems.
Can I monitor multiple solar sites from one platform?
Yes - multi-site portfolio monitoring is a core function of commercial SCADA platforms and most cloud-based monitoring services. Platforms like AlsoEnergy (Trimark), Sungrow iSolarCloud, SMA Sunny Portal, and Power Factors allow you to manage hundreds of sites from a single dashboard, with fleet-level KPIs, site comparison, and automated alarm routing. Open-source stacks (InfluxDB + Grafana) can also be configured for multi-site aggregation with the right data pipeline architecture.
About the Contributors

CEO & Co-Founder · SurgePV
Keyur Rakholiya is CEO & Co-Founder of SurgePV and Founder of Heaven Green Energy Limited, where he has delivered over 1 GW of solar projects across commercial, utility, and rooftop sectors in India. With 10+ years in the solar industry, he has managed 800+ project deliveries, evaluated 20+ solar design platforms firsthand, and led engineering teams of 50+ people.