

Answer
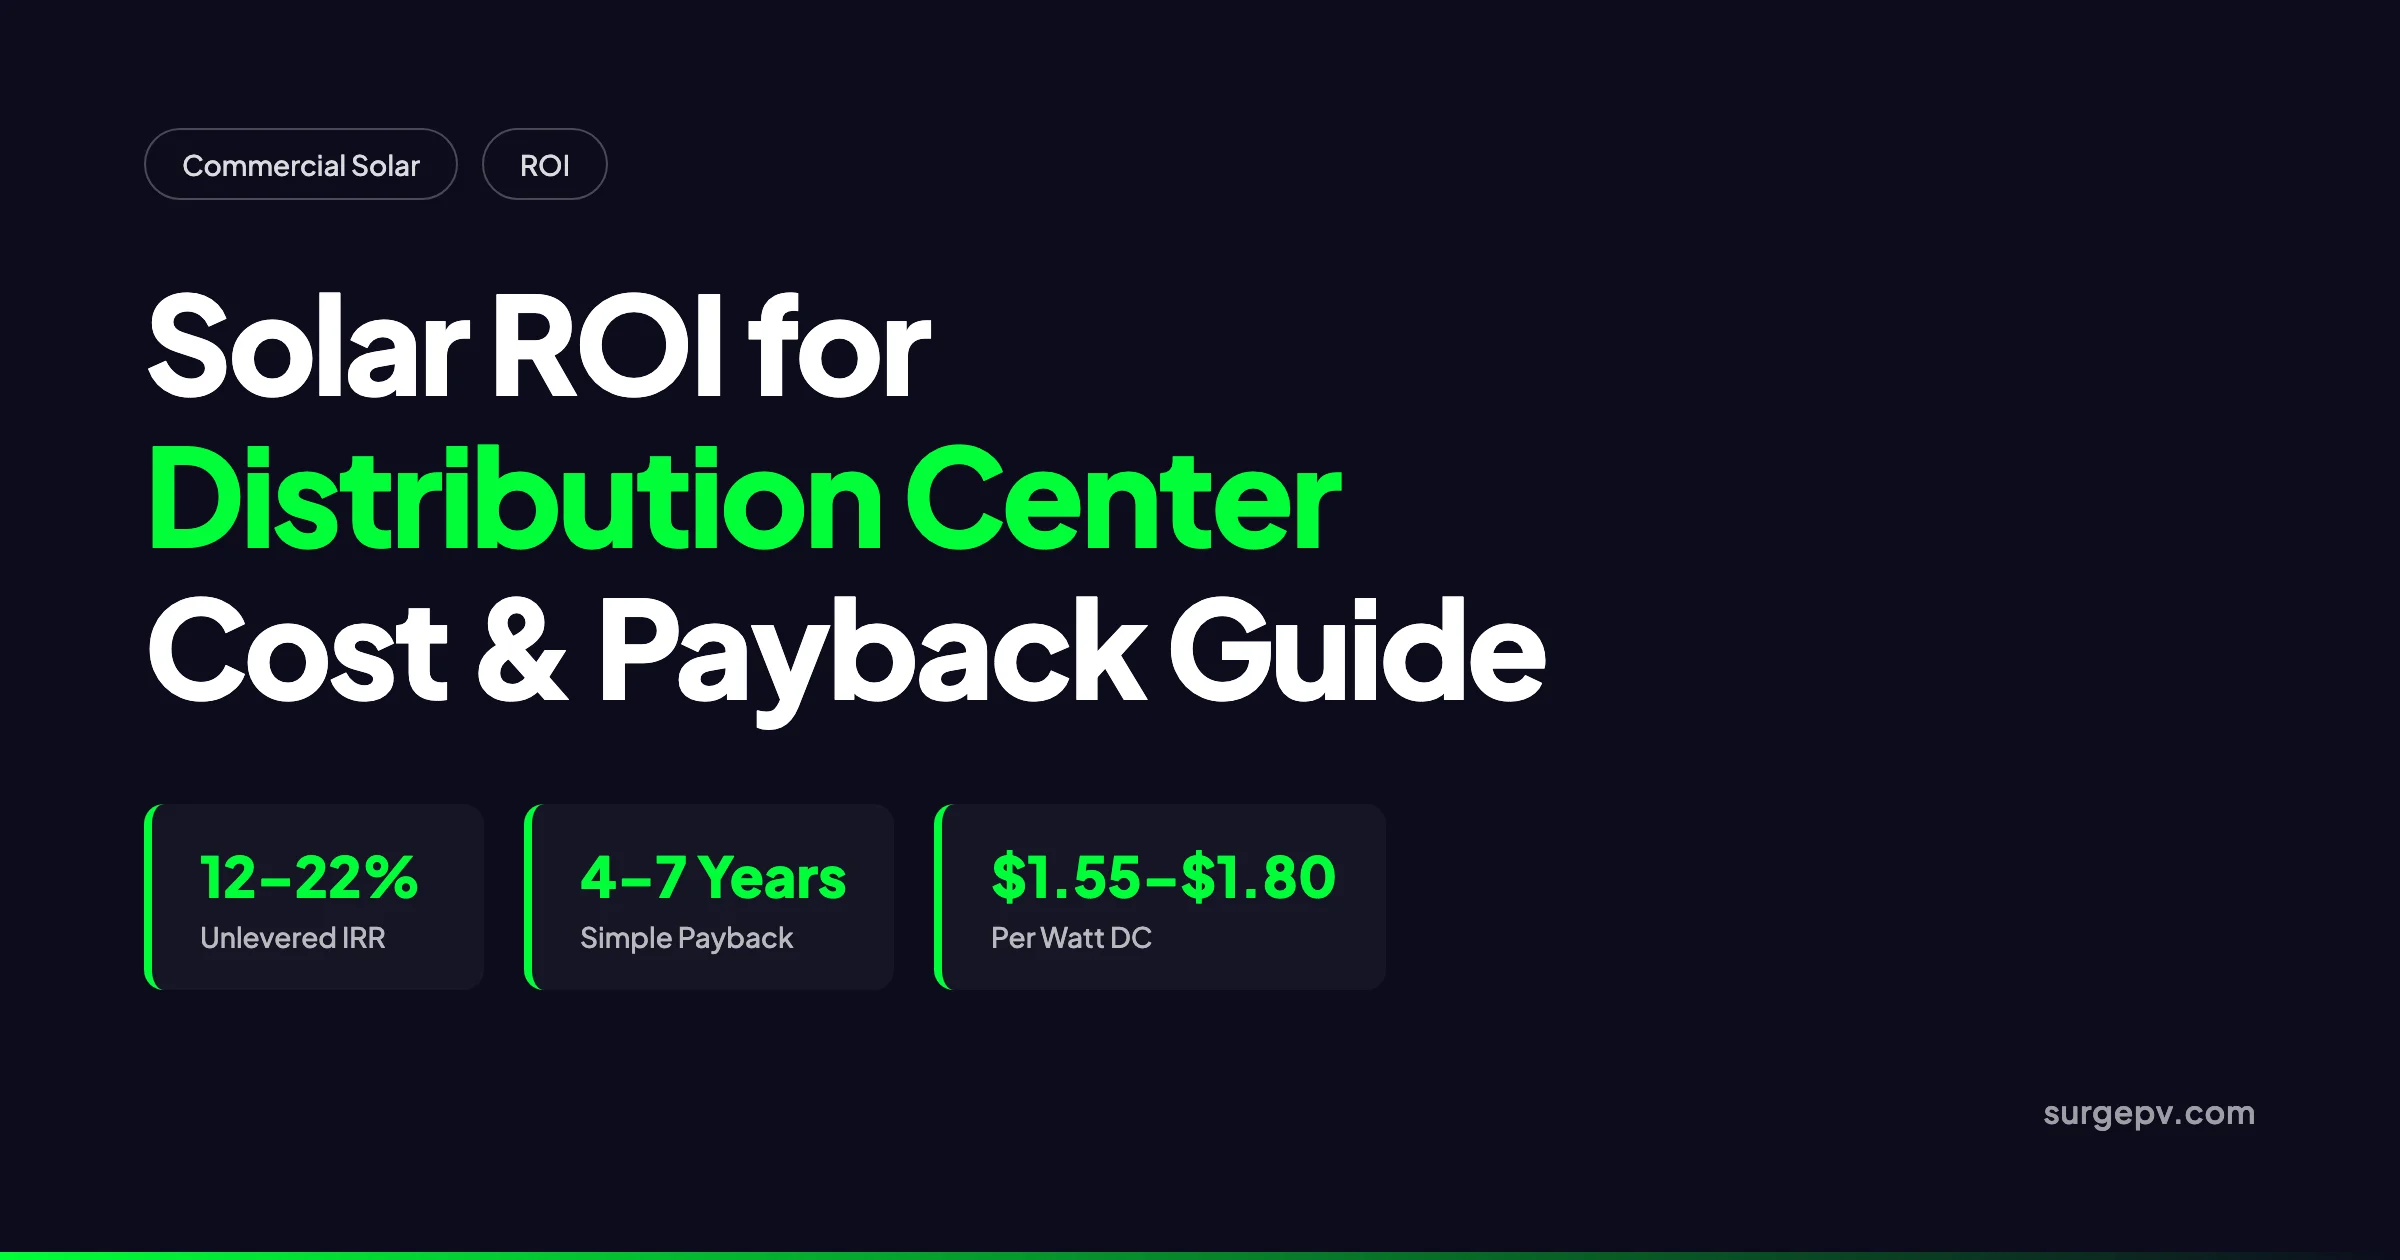
Distribution center solar ROI in the U.S. typically delivers a 12 to 22 percent unlevered IRR and a 4 to 7 year simple payback after the 30 percent federal ITC. A 1 MW rooftop system on a 300,000 square foot facility costs roughly $1.55 million to $1.80 million before incentives. Annual savings range from $180,000 to $320,000, depending on local rates, self-consumption, and demand charges.
Distribution centers are one of the most financially attractive solar asset classes in commercial real estate. They combine large, flat roofs, predictable daytime operations, and rising electricity bills into a single site where photovoltaic economics often work without creative financing. In the United States, warehouse and storage buildings are the most common commercial building type, and distribution or shipping centers are more electricity-intensive than plain warehouses. The EIA Commercial Buildings Energy Consumption Survey (2018) estimates nonrefrigerated warehouses at roughly 6.0 kWh per square foot per year, while distribution or shipping centers reach about 14.0 kWh per square foot per year. Commercial electricity rates averaged 13.51 cents per kWh in April 2026, up 4.8 percent year over year, according to the U.S. Energy Information Administration. In California, New York, and Massachusetts, large commercial users regularly pay more than 25 cents per kWh.
Solar generation displaces those kilowatt-hours at a fixed cost for 25 years or more. The question for owners and operators is not whether solar works in theory. It is whether the numbers work for a specific building with a specific load shape, roof condition, and tariff.
This guide is written for distribution center owners, logistics operators, property managers, solar installers, and EPCs bidding on warehouse rooftops. It explains how to calculate solar ROI for a distribution center, what system sizing and financing assumptions matter, and where the numbers can go wrong. We use 2026 market data, named sources, and a worked example you can replicate for a specific property.
If you are modeling multiple facilities or a national portfolio, use SurgePV’s cloud solar design platform. It imports interval data, runs shadow analysis, and exports permit-ready plans. The energy and financial modeling tool models distribution-center-specific tariffs, demand charges, and incentive stacks in one workflow.
Quick Answer
Distribution center solar ROI in the U.S. typically delivers a 12 to 22 percent unlevered IRR and a 4 to 7 year simple payback after the 30 percent federal ITC. A 1 MW rooftop system on a 300,000 square foot facility costs roughly $1.55 million to $1.80 million before incentives. Annual savings range from $180,000 to $320,000, depending on local rates, self-consumption, and demand charges.
In this guide:
- Why distribution centers are strong solar candidates
- How much energy a distribution center actually uses
- What a distribution center solar system costs in 2026
- The full 2026 incentive stack: ITC, MACRS, REAP, and state programs
- Ownership, loan, PPA, and lease trade-offs
- A worked ROI example for a 1 MW rooftop distribution center
- Battery storage and demand-charge economics
- Common mistakes that kill distribution center solar returns
- When distribution center solar does not make sense
- FAQ with 10 distribution center solar ROI questions
Why Distribution Centers Are Strong Solar Candidates
Distribution centers are not generic commercial buildings. A logistics facility consumes power during long hours that overlap strongly with solar production. Receiving starts early. Picking, packing, and shipping run through the afternoon. Material-handling equipment charges during breaks and shift changes. Lighting, conveyors, and HVAC keep the building running. That daytime load means a high self-consumption rate, which is the single biggest driver of ROI.
Most commercial buildings self-consume 40 to 60 percent of onsite solar production. Well-designed distribution centers often self-consume 60 to 80 percent, according to industry studies of high-daytime-load sites. Every self-consumed kilowatt-hour avoids the full retail rate plus delivery and demand charges. Exported kilowatt-hours, by contrast, are credited at avoided-cost or net-billing rates that can be half the retail value or less.
Distribution centers also have predictable, repeatable footprints. A 300,000 square foot facility in Dallas behaves like a 300,000 square foot facility in Atlanta once you adjust for climate and tariff. That repeatability lets portfolio operators standardize system sizes, equipment lists, and financing structures across dozens of locations. Standardization reduces soft costs and speeds up corporate approval.
The third difference is scale. A large rooftop can host 1 to 5 MW of solar. That scale attracts better equipment pricing, experienced EPCs, and institutional financing. It also justifies a dedicated operations team or performance guarantee. The per-watt soft costs that plague small commercial projects fall as project size rises.
For a deeper look at the design side, read our guide to solar design for distribution center. The load-curve logic is similar, even though the financial questions differ.
How Much Energy a Distribution Center Actually Uses
A credible ROI model starts with an accurate load estimate. The EIA’s 2018 CBECS data shows standard warehouses averaged about 5.1 kWh per square foot per year of electricity consumption. Nonrefrigerated warehouses averaged 6.0 kWh per square foot per year. Distribution or shipping centers averaged 14.0 kWh per square foot per year, more than double the warehouse average. A 300,000 square foot distribution center at that intensity uses roughly 4.2 million kWh per year.
Real consumption varies widely by operation type:
- Ambient storage warehouse: 5 to 8 kWh/ft²/year, mostly lighting and minimal material handling.
- Regional distribution center: 8 to 14 kWh/ft²/year, with conveyors, sortation, and electric forklift charging.
- Cold-chain distribution center: 20 to 50 kWh/ft²/year or more, with refrigeration running 24/7.
- E-commerce fulfillment center: 12 to 25 kWh/ft²/year, with automated storage, robotics, and high sortation activity.
At the national average commercial rate of 13.51 cents per kWh, a 4.2 million kWh distribution center spends about $567,000 per year on electricity before demand charges. In high-rate markets, the same building can spend $1 million or more. HVAC and refrigeration are the hidden drivers. They account for 25 to 45 percent of ambient distribution center electricity use and 50 to 70 percent of cold-chain use. A poorly insulated building with old rooftop units can consume twice as much per square foot as a modern building with LED lighting and efficient systems. That is why energy efficiency should be addressed before or alongside solar sizing.
Material-handling equipment is the second major load. Electric forklift chargers can pull 10 to 30 kW each. A fleet of 50 forklifts charging after the day shift can create a sharp afternoon peak. Conveyors, sorters, and automated guided vehicles add steady base load during active hours. The key is to model interval data, not only annual usage, because the shape of the load determines how much solar is consumed onsite.
Solar ROI Differs by Distribution Center Type
Not every logistics facility gets the same return. The operating model, hours, and load shape change the economics.
Ambient warehouses and storage buildings often have the simplest load profile. They run lighting and limited HVAC during business hours with low midday peaks. Self-consumption can be high, but the absolute bill savings are smaller because total consumption is low. A 500 kW system on a 200,000 square foot ambient warehouse in a high-rate market can pay back in 5 to 8 years.
Regional distribution centers are the sweet spot. They operate 12 to 18 hours per day with steady material-handling equipment, conveyor, and HVAC loads. A 1 MW rooftop system can offset 50 to 70 percent of annual consumption. These facilities usually have enough roof area and enough load to make solar work without storage.
Cold-chain facilities consume the most energy but also have the most complex tariffs. Refrigeration runs 24/7, which creates a flatter load shape. Solar offsets daytime consumption, but battery storage becomes more valuable to shift midday surplus into evening refrigeration demand. Demand charges often dominate the bill, which makes careful load shifting critical.
E-commerce fulfillment centers have high plug loads from automated systems and robotics. Their load is heavy during operating hours and often spikes with shift changes. Solar works well when the facility operates day shifts. Facilities with heavy night sortation may need storage to capture value.
The rule across all formats is the same. The best returns go to facilities that consume most of their solar generation onsite during daylight hours. A distribution center that runs primarily at night will not see the same ROI as a facility with strong daytime occupancy.
What a Distribution Center Solar System Costs in 2026
A credible ROI model starts with an accurate installed cost. The table below blends the latest benchmark data for commercial rooftop projects.
| Cost component | Benchmark value | Source |
|---|---|---|
| Commercial rooftop PV, NREL 2024 benchmark | $1.55/Wdc | NREL cost benchmarks |
| Commercial rooftop PV, SEIA/WoodMac Q1 2026 market price | $1.71/Wdc | SEIA Solar Market Insight Report Q2 2026 |
| Solar carport adder | $0.40–$0.70/Wdc | Industry range for structural steel and foundations |
| Ground-mount adder | $0.10–$0.30/Wdc | Land preparation, fencing, and longer wiring |
| Soft costs, permitting, interconnection | $0.30–$0.50/Wdc | Typical for distributed commercial projects |
| Annual O&M | $10–$15/kW-year | Cleaning, monitoring, inspections |
| Inverter replacement reserve | $0.15–$0.25/Wdc in year 12–15 | Budgeted over system life |
For planning, use $1.55 to $1.80 per watt DC for rooftop projects and $2.00 to $2.40 per watt DC for carports. The SEIA figure of $1.71/Wdc reflects higher balance-of-system costs and tariff-driven price pressure in 2025 and early 2026. The NREL benchmark of $1.55/Wdc is useful for conservative modeling. A 1 MW rooftop system therefore costs $1.55 million to $1.80 million before incentives.
Operating costs are low but persistent. Budget $10 to $15 per kW per year for O&M, plus an inverter replacement reserve. Over 25 years, these costs are typically 5 to 8 percent of the upfront capital cost. Ignoring them makes payback look shorter than it really is.
The Full 2026 Incentive Stack
Federal incentives remain the largest driver of distribution center solar ROI in 2026, but the rules have tightened. The Inflation Reduction Act’s Section 48E Clean Electricity Investment Credit provides a 30 percent tax credit for qualifying commercial solar. To secure the full credit, projects generally must be placed in service by December 31, 2027. Projects that began construction by July 4, 2026 may also qualify under continuity rules, according to IRS Instructions for Form 3468.
The credit is claimed on IRS Form 3468. It is a dollar-for-dollar reduction in federal tax liability, not a deduction. If the credit exceeds tax liability in year one, the unused portion can generally be carried back one year or forward up to 20 years.
MACRS depreciation adds a second large benefit. Commercial solar is depreciated over five years. In 2026, 100 percent bonus depreciation may still apply for federal purposes, allowing the entire depreciable basis to be written off in year one. The depreciable basis is reduced by half of the ITC, so a 30 percent ITC leaves 85 percent of cost to depreciate. For a profitable owner in a 21 percent federal tax bracket, the depreciation shield is worth roughly 18 to 22 percent of project cost. That figure is expressed in present-value terms.
Bonus adders can push the ITC above 30 percent. These include:
- Domestic content bonus: 10 percentage points if steel, iron, and manufactured products meet U.S. content thresholds.
- Energy community bonus: 10 percentage points for projects in designated fossil-fuel-dependent or brownfield areas.
- Low-income bonus: 10 or 20 percentage points for qualifying community-serving projects, subject to capacity allocation.
USDA REAP grants and loan guarantees support rural distribution centers. REAP grants can cover up to 50 percent of eligible project costs for qualified agricultural producers and rural small businesses. Loan guarantees can reach 75 percent of project cost. These programs stack with the federal ITC, making rural distribution centers some of the highest-ROI projects in the country.
State and utility incentives vary. Common programs include Solar Renewable Energy Certificates, utility rebates, green bank financing, and sales or property tax exemptions. The Database of State Incentives for Renewables and Efficiency tracks current rules by state.
For a deeper breakdown, see our guide to solar IRA tax credits in the U.S..
Financing Options: Cash, Loan, PPA, or Lease
The financing structure changes who keeps the tax benefits and who carries the risk. The table below compares the four main options for distribution center solar.
| Structure | Upfront cost | Tax credits | Depreciation | O&M risk | Best for |
|---|---|---|---|---|---|
| Cash purchase | Full CapEx | Owner keeps | Owner keeps | Owner | Owners with tax appetite and capital |
| Solar loan | Small to no down payment | Owner keeps | Owner keeps | Owner | Owners that want ownership without large cash outlay |
| PPA | $0 | Investor keeps | Investor keeps | Investor | Short lease terms or constrained capital |
| Operating lease | $0 or low | Lessor keeps | Lessor keeps | Lessor | Off-balance-sheet treatment priority |
Cash purchase produces the highest lifetime return because there is no financing cost and the owner captures every tax benefit. A 1 MW system with a 30 percent ITC and bonus depreciation can recover 45 to 55 percent of cost in year one.
A solar loan often improves return on equity. An owner that puts 20 percent down can earn a higher IRR on the equity portion than an all-cash buyer. Financing rates of 6 to 8 percent work well if the loan term stays below the payback period.
A PPA fixes a long-term energy rate below the utility tariff and requires no capital. It is attractive for leased properties where the tenant pays the electric bill and the landlord does not want to own equipment. The trade-off is lower total savings over 20 years.
A lease is simpler than a PPA but usually the most expensive over time. It also creates off-balance-sheet treatment questions that accountants must review.
Worked ROI Example: 1 MW Distribution Center Rooftop
Here is a complete 25-year model for a cash-purchase distribution center rooftop system. The numbers are realistic for a high-rate state such as California, New York, or Massachusetts.
Project assumptions
| Assumption | Value |
|---|---|
| System size | 1 MW DC |
| Specific yield | 1,500 kWh/kWp/year |
| First-year production | 1,500,000 kWh |
| Self-consumption rate | 75 percent |
| Commercial electricity rate | $0.14/kWh |
| Demand charge | $15/kW/month |
| Annual degradation | 0.5 percent |
| Installed cost | $1.65/Wdc = $1,650,000 |
| ITC | 30 percent = $495,000 |
| Net cost after ITC | $1,155,000 |
| O&M | $12/kW-year = $12,000/year, escalating 2.5 percent |
| Analysis period | 25 years |
| Discount rate | 8 percent |
Year-one savings
- Self-consumed solar: 1,125,000 kWh × $0.14 = $157,500
- Exported solar: 375,000 kWh × $0.06 net billing credit = $22,500
- Demand-charge savings from solar peak reduction: 300 kW × $15 × 12 = $54,000
- Gross year-one savings: $234,000
- Less O&M: $12,000
- Net year-one savings: $222,000
Tax benefits in year one
- ITC: $495,000
- Bonus depreciation on 85 percent of cost at 21 percent federal rate: $294,525
- Total year-one tax benefit: $789,525
Return metrics
| Metric | Result |
|---|---|
| Simple payback | 5.2 years |
| Discounted payback | 6.1 years |
| Unlevered IRR | 18.4 percent |
| NPV at 8 percent discount | $1,120,000 |
| LCOE | $0.048/kWh |
The LCOE of 4.8 cents per kWh is well below the 14 cent retail rate. That spread is the economic engine. In a lower-rate state at 10 cents per kWh, the same system still produces a 10 to 14 percent IRR. Payback stretches to 7 to 10 years, assuming similar self-consumption.
Real projects support these figures. A UK warehouse solar review found rooftop systems regularly achieve 5 to 7 year paybacks for logistics operators with high daytime loads. In the U.S., distribution centers with strong roof resources and rates above 12 cents per kWh regularly see payback in the 4 to 6 year range.
You can model your own numbers in SurgePV’s PV generation and financial modeling or commercial solar ROI calculator.
Battery Storage and Demand-Charge Economics
A distribution center has three solar options, not one. Rooftop is usually cheapest per watt. Carports are more expensive but add shade, weather protection, and customer-facing sustainability. Battery storage captures value that panels alone cannot.
Solar carports typically add $0.40 to $0.70 per watt for the steel structure and foundation. A 200-space canopy can host 500 kW to 1.5 MW of solar and generate 650 to 1,900 MWh per year, depending on location. The economics improve when the canopy also supports EV chargers for fleet vehicles or employee cars.
EV charging is changing distribution center load profiles. Electric forklifts already charge onsite. Delivery van and truck charging is next. A single DC fast charger can draw 50 to 150 kW. Multiple Level 2 chargers add smaller but steady loads. If chargers are used by fleet vehicles during the day, solar self-consumption rises. If they are used mainly in the evening, a battery becomes valuable.
Battery storage does two things for distribution center solar. It shifts midday solar production into evening peak periods, and it shaves monthly demand charges. A single 500 kW spike from conveyor startup or forklift charging can cost $60,000 to $150,000 per year in demand charges. A 500 kW / 1,000 kWh battery can discharge during those spikes and cut that line item.
The added cost is meaningful. A 500 kW / 1,000 kWh lithium-ion battery costs $250,000 to $400,000 installed before incentives. Commercial batteries paired with solar qualify for the same Section 48E ITC and MACRS depreciation as the PV system. That brings the net cost down to $150,000 to $240,000 for a profitable owner.
The decision rule is simple. If your distribution center tariff has demand charges above $15 per kW per month or a large time-of-use spread, model storage. If your tariff is purely energy-based with low demand charges, solar alone is usually the better first investment.
What Most Distribution Center Owners Get Wrong About Solar ROI
A good model is only as honest as its assumptions. The following errors appear repeatedly in distribution center solar proposals.
Overstating self-consumption. A facility that is busiest at 6 PM cannot consume solar production after sunset. If the model assumes 95 percent self-consumption without an 8760-hour load and production simulation, it is probably wrong. Use interval data, not monthly bills.
Sizing by roof area instead of load. A large roof can fit a big array, but a big array that exports most of its production at avoided-cost rates loses money. Start with interval data and target high self-consumption.
Ignoring demand charges. Many commercial tariffs include demand charges based on the highest 15-minute peak each month. Conveyor startup, forklift charging, and HVAC ramp create sharp peaks. Solar can reduce daytime peaks, but a cloudy afternoon followed by evening shift load can create a new peak. Model demand charges with interval data, or add a battery to shave the peak.
Using aggressive rate escalation. Some proposals assume 4 to 5 percent annual utility rate increases forever. Historical utility rate growth has been closer to 2 to 3 percent nationally. Overstating escalation inflates NPV and IRR.
Mismatching roof life and project life. A solar system lasts 25 to 30 years. If the roof membrane has 8 years of life left, the project should include re-roofing cost or move to a carport. Re-roofing after panel installation is expensive.
Failing to address utility interconnection early. Distribution centers can have limited transformer capacity. Adding 1 MW of solar may require a service upgrade. That upgrade can cost $50,000 to $250,000 and add months to the timeline. Check with the utility before finalizing the design. Large C&I projects above 5 MW can face 12 to 24 months of study timelines on congested feeders, according to the DOE i2X interconnection roadmap (2024).
The contrarian truth is that distribution center solar is often more profitable when the array is smaller. A right-sized system with high self-consumption, no export losses, and low interconnection cost can deliver a better NPV than a maxed-out roof.
When Distribution Center Solar Does Not Make Sense
Solar is not universal. Distribution center solar ROI is weak or negative when several conditions coincide.
- Low commercial rates: At rates below 10 cents per kWh, the avoided-cost spread may not cover O&M, inverter replacement, and capital recovery.
- Short lease term: If the facility lease expires in 7 years and the payback is 8 years, the tenant will not see savings.
- Poor solar resource or heavy shading: A shaded roof in Seattle produces far less than a flat roof in Phoenix. Shading analysis is mandatory.
- Weak net-metering rules: Markets that pay wholesale rates for exports and offer no demand-charge value cut project returns by 30 to 50 percent.
- Roof replacement within five years: Moving panels to replace a roof destroys first-year economics.
- Old or undersized electrical service: A service upgrade can add $50,000 to $250,000 and push payback beyond the investment horizon.
The exception is a PPA. Even in marginal markets, a zero-upfront PPA can deliver day-one savings if the investor can use tax credits and accept lower long-term returns.
How SurgePV Models Distribution Center Solar ROI
Commercial distribution center projects move slowly enough without spreadsheet friction. SurgePV brings the design, simulation, and proposal workflow into one cloud platform.
- Fast site modeling: Import aerial imagery and draw the roof in minutes. SurgePV’s Clara AI identifies usable areas, pitches, and obstructions automatically.
- Accurate shade analysis: Run hourly shadow analysis across the full year and export shade-loss values by string.
- Load and tariff modeling: Upload interval data and model the facility’s actual load shape against production. The generation and financial tool handles net metering, net billing, demand charges, and incentive stacking.
- Multi-meter allocation: Define tenant or department shares by kWh, square footage, or custom rules, then export the allocation table for virtual net metering applications.
- Permit-ready proposals: Generate branded solar proposals with production graphs, financial summaries, and equipment schedules.
Model solar ROI for your distribution center in SurgePV
Import interval data, size the array to daytime load, and build a finance-ready proposal — all in one platform.
Book a DemoNo commitment required · 20 minutes · Live distribution center ROI walkthrough
For teams that also need detailed engineering deliverables or PE-stamped permit packages, a solar design and engineering consultancy can extend the workflow without duplicating effort.
FAQ
What is a typical solar ROI for a distribution center in 2026?
Distribution center solar in the U.S. typically delivers a 12 to 22 percent unlevered IRR and a 4 to 7 year simple payback after the 30 percent federal ITC. The range depends on local commercial electricity rates, available roof or land area, self-consumption rate, and whether the project includes battery storage for demand-charge management.
How much does a distribution center solar system cost?
A rooftop distribution center solar system in 2026 costs roughly $1.55 to $1.80 per watt DC before incentives, according to NREL and SEIA benchmarks. A 1 MW system therefore lands between $1.55 million and $1.80 million before the ITC. Solar carports add $0.40 to $0.70 per watt because of structural steel and foundations.
Why is solar ROI strong for distribution centers?
Distribution centers have large, flat roofs and daytime-heavy loads from lighting, material-handling equipment, and HVAC. They often self-consume 60 to 80 percent of solar generation onsite at the full retail rate. High commercial electricity rates, averaging 13.5¢/kWh nationally and over 25¢/kWh in some coastal markets, make each onsite kilowatt-hour valuable.
Should a distribution center owner buy solar outright or use a PPA?
Direct ownership captures the 30 percent federal ITC, MACRS depreciation, and all long-term savings. It produces the highest lifetime ROI but requires capital and tax appetite. A PPA preserves cash, fixes a long-term energy rate, and transfers O&M risk, but passes tax benefits to the investor. Choose ownership if the balance sheet supports it; choose a PPA if capital is constrained or the property lease is short.
What federal incentives apply to distribution center solar in 2026?
The Section 48E Clean Electricity Investment Credit provides a 30 percent tax credit for qualifying commercial solar. Projects must generally be placed in service by December 31, 2027. Projects that began construction by July 4, 2026 may also qualify under continuity rules. Businesses can also use accelerated MACRS depreciation. Rural facilities may qualify for USDA REAP grants and loan guarantees.
How does net metering affect distribution center solar ROI?
Full retail net metering makes ROI strongest because summer midday surplus offsets winter or evening usage at the retail rate. Net billing pays only avoided-cost rates for exports, which can be 30 to 60 percent lower. In net-billing markets, size the array closer to daytime load and consider battery storage to increase self-consumption.
What are the biggest mistakes that hurt distribution center solar ROI?
The most common mistakes are sizing by roof area instead of verified load, ignoring demand charges from material-handling equipment and HVAC peaks, using optimistic electricity rate escalation, and failing to coordinate roof replacement timing. Facilities with multi-shift or evening operations must also model those loads carefully because solar production may not coincide with them.
When does distribution center solar not make financial sense?
Distribution center solar struggles in several conditions. These include rates under 10¢/kWh, roof replacement within five years, and a lease that expires before payback. Local rules that pay wholesale export prices with no demand-charge value also hurt returns. Low load-factor facilities, such as those with heavy evening-only usage, also see weaker returns unless storage shifts production into operating hours.
Can battery storage improve distribution center solar ROI?
Yes, in markets with high demand charges or time-of-use spreads. A battery can store midday solar for evening peak periods and shave monthly demand peaks. Distribution centers with demand charges above $15 per kW per month often see payback improvements of 1 to 2 years when storage is sized correctly.
How long does a distribution center solar project take from feasibility to commissioning?
A typical distribution center rooftop project takes 9 to 18 months. Feasibility and design take 1 to 2 months. Procurement and permitting take 2 to 4 months. Utility interconnection approval takes 2 to 6 months. Construction, usually scheduled around operating hours, lasts 1 to 3 months.
Distribution center solar is a portfolio finance decision, not a one-roof science project. The economics are strongest for owners that can standardize design, finance in bulk, and act before the 2026 construction deadlines. The highest-ROI moves in the next 12 months are:
- Run interval-data models for your top 10 facilities to find the fastest paybacks.
- Lock construction starts before the July 4, 2026 safe-harbor deadline if you want the full federal ITC.
- Use a PPA or lease for short-lease or capital-constrained locations, and own the systems where the balance sheet and tax appetite support it.
Ready to model your distribution center solar ROI? Use SurgePV’s generation and financial tool to run real utility rates, incentives, and financing structures for every property in your portfolio. Book a demo to see the workflow.
Where this fits
This article is part of SurgePV's Solar Business & Operations hub, which works through the topic from first principles to the decisions a project team actually has to make.
