

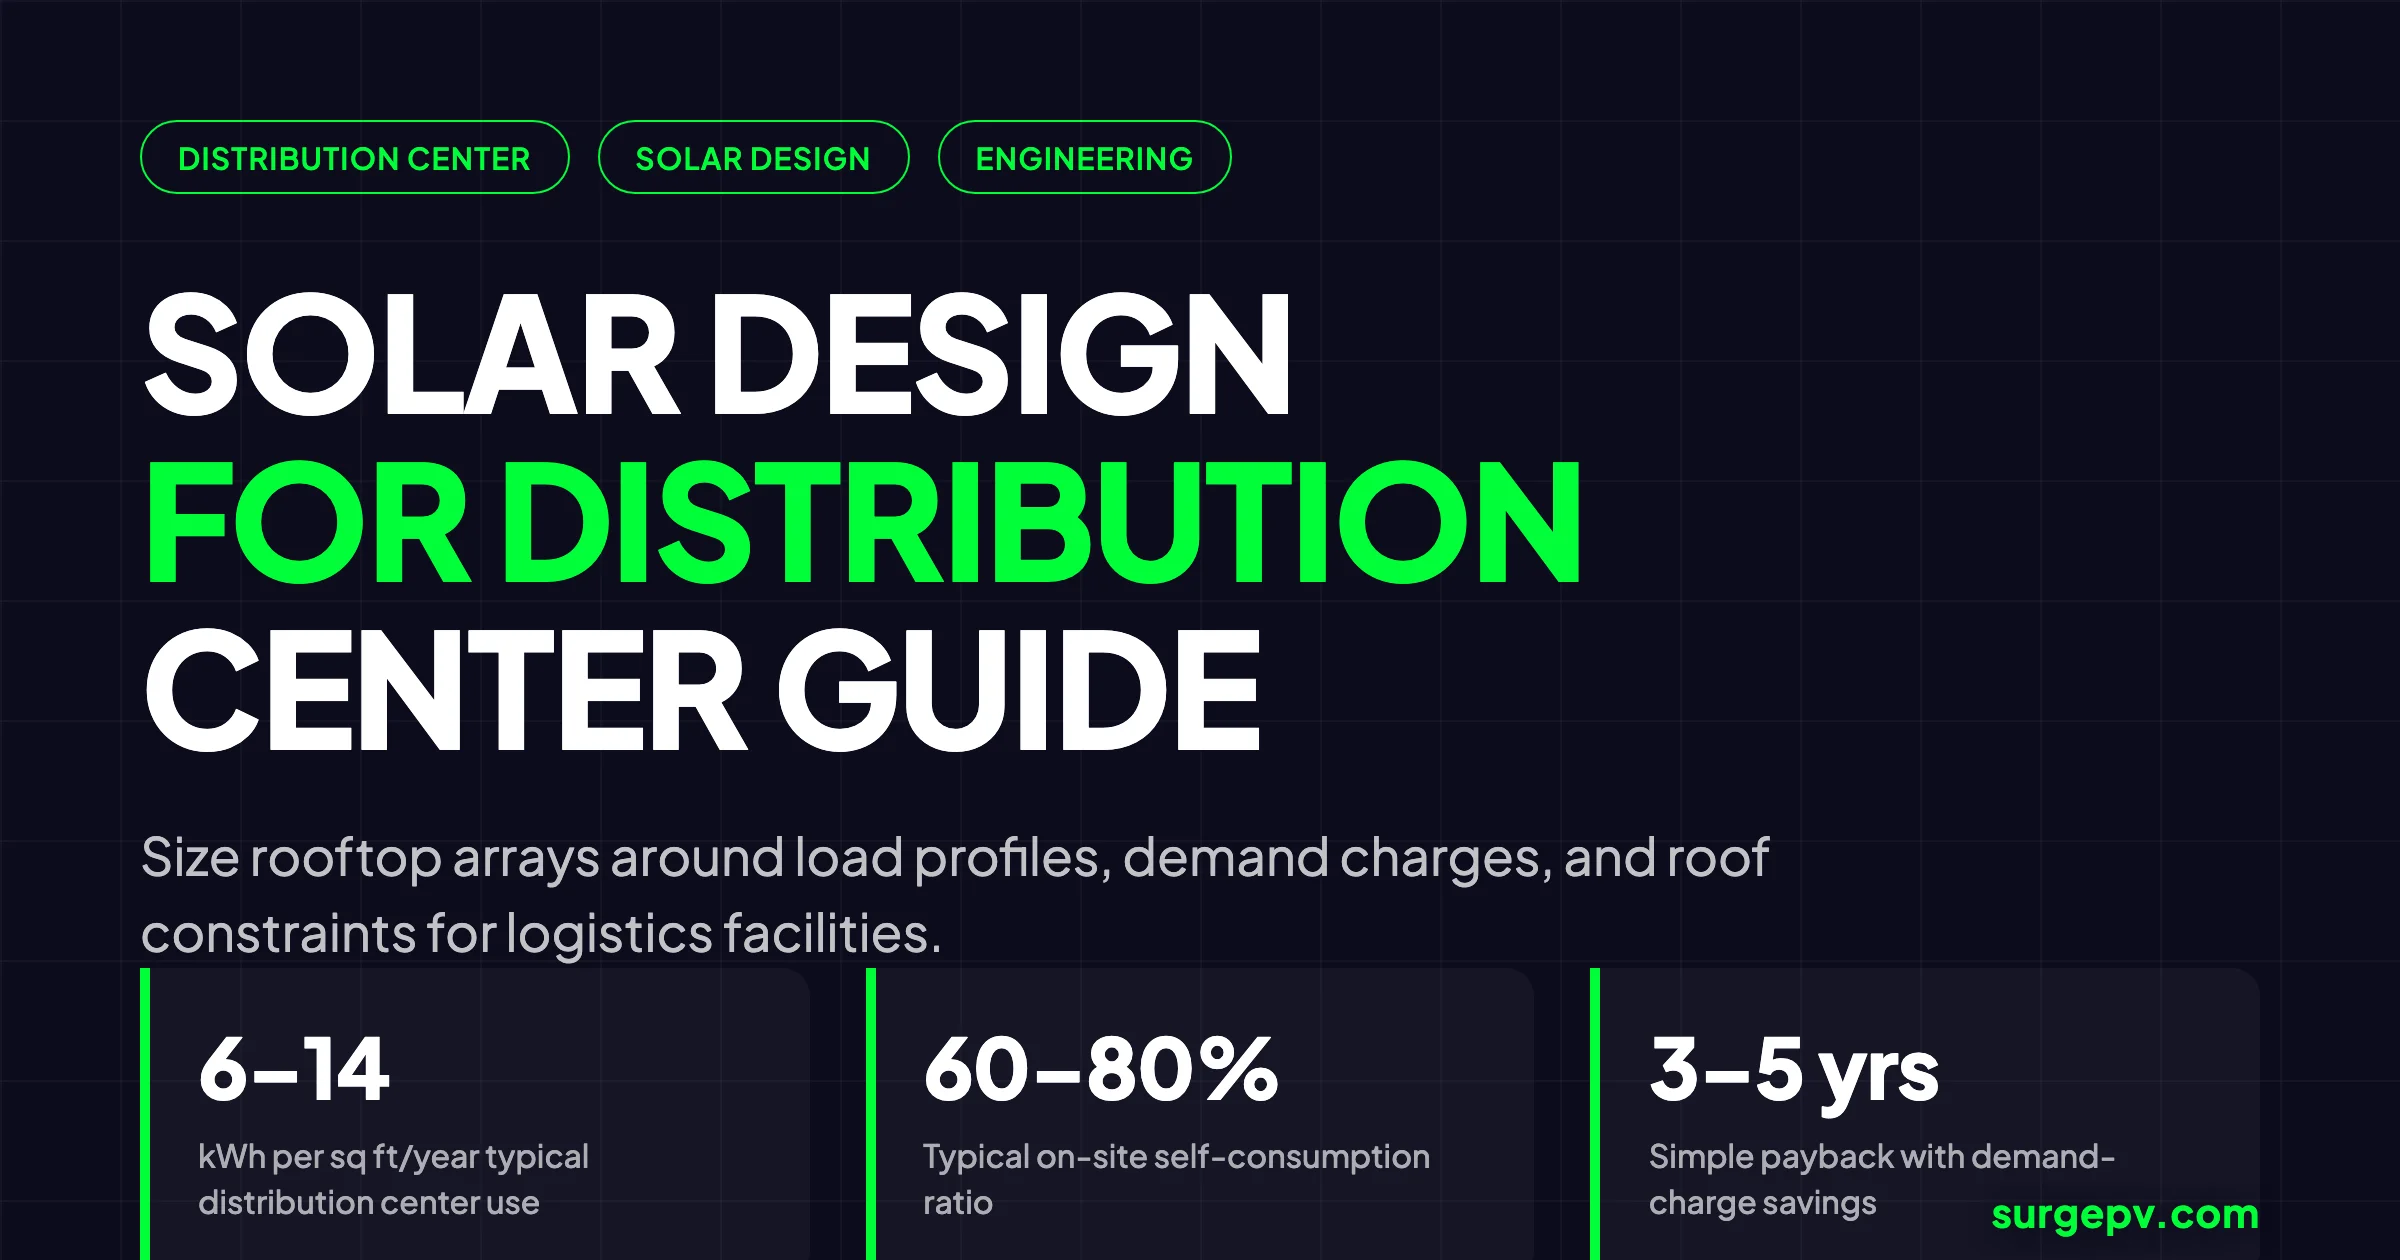
Distribution centers are one of the most solar-ready asset classes in commercial real estate. They combine large, flat roofs, predictable daytime operations, and rising electricity bills into a single site where PV economics often work without subsidies. In the United States, warehouse and storage buildings are the most common commercial building type, and distribution or shipping centers are more electricity-intensive than plain warehouses. The EIA Commercial Buildings Energy Consumption Survey (2018) estimates nonrefrigerated warehouses at roughly 6.0 kWh per square foot per year, while distribution or shipping centers reach about 14.0 kWh per square foot per year. That higher load density, combined with large roof area, makes distribution centers a strong target for behind-the-meter solar.
The challenge is that a distribution center is not just a big roof with a load. It has a specific operating rhythm: receiving in the morning, picking and packing through the day, shipping in the afternoon, and material-handling equipment charging during breaks and shift changes. Solar generation peaks at midday. The design wins when the array matches the facility’s actual consumption pattern, not just its annual kilowatt-hours. This guide covers the 2026 design workflow for distribution centers, from load profiling and sizing to mounting selection, storage integration, interconnection, and the mistakes that waste budget.
If you are designing distribution center solar at scale, use a cloud solar design platform that imports interval data, runs shadow analysis, and exports permit-ready plans. SurgePV is an all-in-one solar software platform built for this workflow.
Quick Answer
Solar design for a distribution center sizes the array around the facility’s actual load curve, not just roof area. A typical non-refrigerated distribution center uses 6 to 14 kWh per square foot per year. The design prioritizes high self-consumption, manages demand charges, and chooses rooftop, carport, or ground-mount based on structural capacity, land, and export rules.
TL;DR — Solar Design for Distribution Center 2026
Distribution centers have large roofs and daytime-heavy loads, so solar design must start with interval data, target high self-consumption, and size storage for demand charges when tariffs justify it. A 1.5 million kWh/year facility needs roughly 855 kWdc of solar to offset 40 percent of consumption at a 20 percent capacity factor. Rooftop is usually the lowest-cost option; carports and ground-mount are used when the roof or load requires it.
In this guide:
- Why distribution center solar design is a distinct discipline
- How to profile load and energy use
- Sizing methodology from kWh target to DC kilowatts
- Rooftop, carport, and ground-mount tradeoffs
- Battery storage sizing for demand charge management
- Interconnection, net metering, and export constraints
- Common design mistakes and how to avoid them
- Worked example for a 250,000 sq ft distribution center
- FAQ with 10 distribution center solar questions
Why Distribution Center Solar Design Is Different
A distribution center sits between a simple warehouse and a manufacturing plant. It has more activity than a storage warehouse but less process heat than a factory. The result is a load profile driven by lighting, material-handling equipment, HVAC for office and dock areas, conveyor systems, and increasingly electric forklift charging. The load is daytime-heavy, which aligns well with solar, but it also has sharp peaks that can trigger expensive demand charges.
The EIA’s 2018 CBECS data shows the spread clearly. Standard warehouses averaged about 5.1 kWh per square foot per year of electricity consumption. Nonrefrigerated warehouses averaged 6.0 kWh per square foot per year. Distribution or shipping centers averaged 14.0 kWh per square foot per year, more than double the warehouse average. A 250,000 square foot distribution center at that intensity uses roughly 3.5 million kWh per year, enough to justify a serious rooftop or ground-mount array.
The roof is usually the first thing designers notice. Modern distribution centers are built with clear-span steel portals that can support solar with minimal structural upgrade. A 250,000 square foot building has roughly 5.7 acres of roof. After fire setbacks, HVAC units, skylights, and access paths, 60 to 70 percent of that area typically remains usable for PV. At 17 to 19 watts per square foot of usable area with modern 590 W modules, that roof can host 2.5 to 3.5 MWdc of solar.
But the roof is a constraint, not a target. The correct size comes from the load. Oversizing the array relative to daytime consumption produces cheap exported kilowatt-hours that are worth far less than on-site consumption. Undersizing leaves bill savings on the table. The design must optimize for self-consumption first, then use storage or export to handle the surplus.
| Factor | Plain Warehouse | Distribution Center |
|---|---|---|
| Annual electricity use | ~5 to 6 kWh/ft² | ~6 to 14 kWh/ft² |
| Daily load shape | Daytime peak, low night | Daytime peak with shift spikes |
| Peak demand driver | Lighting, occasional MHE | Forklift charging, conveyors, dock activity |
| Self-consumption potential | 55 to 70% | 60 to 80% |
| Roof structural load | Standard commercial | Often pre-engineered for solar |
| Electrification headroom | Low | High from EV forklifts and fleet charging |
The table explains why a generic commercial solar proposal underperforms on distribution centers. The design must treat the operating schedule and tariff structure as inputs, not afterthoughts.
Load Profile and Energy Use in Distribution Centers
The first step in distribution center solar design is to understand where the kilowatt-hours go. The load profile sets the array size, the battery duration, the inverter rating, and the financial case.
End uses that dominate consumption
Lighting is the base layer. Modern distribution centers use LED high-bay fixtures, but a 250,000 square foot facility can still draw 200 to 400 kW just for lighting during operating hours. Material-handling equipment, including electric forklifts, pallet jacks, and automated guided vehicles, adds large but intermittent loads. Charging stations for electric forklifts often pull 10 to 30 kW each and create a visible afternoon peak if shifts end around the same time.
Conveyors, sorters, and packaging equipment add a steady base load during active hours. HVAC keeps office mezzanines and dock areas conditioned. Refrigeration, if present, turns a distribution center into a cold-chain facility with a much flatter, 24-hour load shape. For pure ambient distribution, the load is concentrated in a 12- to 16-hour operating window.
Seasonal and weekly patterns
Distribution centers often see a summer peak from air conditioning and a year-end peak from holiday volume. The weekly pattern reflects shift schedules: single-shift operations show a single daytime hump, while multi-shift or 24-hour operations show a flatter profile with higher baseload. Solar output peaks in summer, so a facility with strong summer cooling load achieves better value per kilowatt-hour than a facility with flat winter demand.
Demand charges and time-of-use rates
Many distribution centers pay demand charges based on the highest 15- or 30-minute power draw in each billing period. These charges can run $10 to $25 per kW per month in the United States. Because solar generation coincides with daytime operation, it can reduce the peak if the highest demand occurs while the sun is shining. If the peak comes in the early morning or late afternoon, a battery is usually needed to capture the value.
The PV generation and financial modeling models time-of-use rates and demand charges hour by hour, so you can see whether solar alone delivers the expected savings or whether storage is needed to shave the evening peak.
Sizing the Solar Array for a Distribution Center
The correct sizing sequence for distribution center solar is: measure load, model production, maximize self-consumption, then pick the kWp number. Residential rules of thumb will mislead you.
Step 1: Collect interval data and building information
Request 12 to 24 months of 15-minute or 30-minute interval data from the utility. Monthly bills hide the daily peaks and seasonal shape. You also need:
- Gross floor area and clear roof dimensions
- Roof age, structural capacity, and remaining warranty
- Operating hours and shift schedules
- Material-handling equipment inventory and charging schedule
- Demand charge structure and time-of-use windows
- Plans for expansion, automation, or electric fleet charging
Step 2: Separate base load from peak and seasonal drivers
Build a load curve by month and by hour. An ambient distribution center in the southern United States might show a base load of 300 kW overnight and peaks of 1,200 kW during the afternoon shift. The peak drives the inverter and interconnection sizing, while the annual kWh drives the array size.
Step 3: Choose a target offset based on self-consumption
Distribution centers typically achieve self-consumption ratios of 60 to 80 percent without storage, according to Solar Panels for Businesses (2026). Adding storage can push that above 85 percent. Because exported solar is usually worth far less than on-site consumption, the economic optimum is often an array that covers 40 to 70 percent of annual load, not 100 percent.
Run three sizing scenarios:
| Scenario | Sizing target | Best for |
|---|---|---|
| High self-consumption | Production = 40 to 60% of annual load | Strong net metering or net billing with low export value |
| Maximum roof use | Production = 70 to 90% of annual load | Favourable feed-in tariff or virtual PPA |
| Export-limited | Production = on-site minimum daytime load | Strict interconnection or net metering caps |
Step 4: Convert target kWh to DC capacity
Divide the target annual kilowatt-hours by the local capacity factor. Capacity factor depends on location, tilt, azimuth, and losses. A fixed-tilt rooftop in the southern United States might achieve 20 to 25 percent. A rooftop in the northern United States might achieve 15 to 20 percent.
For example, a facility targeting 600,000 kWh/year of solar generation at a 20 percent capacity factor needs:
- Required DC energy = 600,000 kWh/year ÷ 0.20 = 3,000,000 kWh/year of DC nameplate
- Required DC capacity = 3,000,000 kWh/year ÷ 8,760 hours = 343 kWp
Round to a practical module layout. A 350 kWdc system would produce roughly 613,000 kWh/year at that capacity factor.
Step 5: Add storage if the peak matters
If the facility pays high demand charges or faces time-of-use rates with steep evening peaks, add a battery energy storage system. The battery captures midday solar surplus and discharges during the peak window. For distribution centers, a 2 to 4 hour battery sized at 25 to 50 percent of peak facility demand is a common starting point.
Use solar design software with interval-data import to test these scenarios automatically. Manual spreadsheets struggle to capture the hourly value of self-consumption, export, and demand-charge savings at the same time.
Rooftop, Carport, and Ground-Mount Options
Most distribution centers have three real-estate options. Each has a different cost, risk profile, and operational payoff.
Rooftop solar
Rooftop is usually the lowest-cost option and the most common for distribution centers. Large flat roofs, minimal obstructions, and electrical rooms close to the array reduce balance-of-system costs. A modern distribution center roof can often support 700 to 900 kW per 100,000 square feet of usable roof area, depending on structural reserve capacity.
Pros:
- Lowest installed cost per watt
- No new land use
- Fastest interconnection path
- Production aligns with daytime operating load
Cons:
- Limited by roof age and structural capacity
- Fire setbacks consume 15 to 25 percent of gross roof area
- HVAC units, parapets, and skylights create exclusions
- Re-roofing later requires panel removal and reinstallation
Before committing to rooftop, get a structural letter. The additional live load from ballasted racking must be reviewed carefully. If the roof has fewer than 15 years of remaining life, bundle the solar with a re-roof or move to carport.
Solar carports
Carports cost more per watt than rooftop, but they solve several distribution-center problems at once. They provide shaded parking for staff and visitors, protect temperature-sensitive vehicles, avoid roof warranty conflicts, and create a natural home for EV charging.
Pros:
- Use parking-lot real estate the facility already owns
- Provide shade for fleet and staff vehicles
- Easy to pair with EV charging stubs
- No roof structural limits
Cons:
- Higher cost per watt due to steel structure
- Foundation and civil work
- May require stormwater review
- Shorter experience base for some installers
A 200-space parking lot can host 500 kW to 1.5 MW depending on bay spacing and column layout. For facilities where the roof is old or small, carports often carry the project.
Ground-mount solar
Ground-mount works for distribution center campuses with spare land, often near detention basins or unused acreage. It offers the lowest cost per watt and the easiest operations and maintenance access, but it competes with land use and requires fencing.
Pros:
- Largest potential capacity per site
- Optimal tilt and azimuth
- Simple O&M access
- Can use bifacial modules and tracking
Cons:
- Land opportunity cost
- Longer permitting and environmental review
- Fencing, landscaping, and security
- Higher civil and interconnection cost
A ground-mount array typically requires 4 to 6 acres per MWdc, depending on module efficiency and row spacing. A 5 MWp array needs roughly 20 to 30 acres.
| Mounting option | Typical size | Cost trend | Best for |
|---|---|---|---|
| Rooftop | 200 kW to 5 MW | Lowest | Strong roof, limited land |
| Carport | 500 kW to 2 MW | Higher | Old roof, visible sustainability, EV charging |
| Ground-mount | 1 MW to 10 MW+ | Low per watt | Campus with spare land |
Use shadow analysis to check parapets, HVAC equipment, and neighbouring buildings before finalising the rooftop layout. A small shadow on a string of modules can disproportionately reduce production if the stringing design is not planned around it.
Battery Storage and Demand Charge Management
Battery storage has become a standard companion to distribution center solar. It solves three problems that solar alone cannot: time-shifting, demand-charge reduction, and short-duration resilience.
Time-shift surplus into evening peaks
A distribution center consumes power after the sun sets if it runs multiple shifts. A battery captures the midday solar surplus and discharges from 5 PM to 9 PM, when the facility is still operating but solar output has fallen. A 4-hour battery sized at 25 to 50 percent of peak load covers daily time-shifting for most grid-tied designs.
Reduce demand charges
Many facilities see a demand peak in late afternoon as solar fades but forklift charging and shipping activity remain high. A battery discharged during that window can reduce the monthly peak demand charge. At $15/kW/month, shaving 500 kW for 12 months saves $90,000 per year.
Bridge short outages
The battery can keep critical lighting, security systems, and control systems online during brief grid outages. It does not replace a diesel generator for a multi-day failure, but it can ride through the seconds to minutes needed for a generator to start or avoid a brief outage altogether.
Sizing rule of thumb
A grid-tied distribution center solar-plus-storage system typically uses a 2 to 4 hour battery sized at 25 to 50 percent of peak facility demand. A 1.5 MW peak facility might pair 1 MWdc of solar with a 375 kW / 1,500 kWh battery. The exact ratio depends on the local tariff structure, export limits, and whether the operator values resilience or bill savings more highly.
Battery prices have fallen below $90 per kWh at the cell level in 2026, but the full installed cost including inverters, enclosures, and integration still runs $300 to $500 per kWh. The business case usually depends on a stack of value streams: energy arbitrage, demand-charge reduction, backup energy displacement, and carbon claims.
Interconnection, Net Metering, and Utility Strategy
The utility interconnection path can make or break a distribution center solar project. Unlike residential systems, distribution center projects often connect at medium voltage and may trigger full interconnection studies.
Behind-the-meter vs front-of-meter
Behind-the-meter solar reduces the facility’s net demand and avoids transmission, distribution, and capacity charges that can exceed 50 percent of the industrial bill. This is why a behind-the-meter kWh can be worth 2 to 3 times more than a utility-scale kWh. Front-of-meter solar, including most virtual PPAs, does not reduce demand charges but provides lower-cost energy and renewable energy credits.
Net metering and export compensation
Distribution centers with large solar arrays relative to load will export during midday. Net metering rules vary by market. Some US states allow full retail credit; others cap system size at a percentage of annual load or pay avoided-cost rates for exports. Designers must model export fraction and compensation to avoid overbuilding the array.
Interconnection timelines
Systems under 25 kW may interconnect in 30 to 60 days. Systems between 25 kW and 5 MW typically take 3 to 6 months. Large C&I projects above 5 MW can face 12 to 24 months of study timelines on congested feeders, according to the DOE i2X interconnection roadmap (2024). Distribution center operators planning solar should start the interconnection pre-application before finalizing the array size.
Capacity reservations
In constrained markets, distribution centers may already hold grid capacity reservations for future expansion or fleet charging. Adding solar may require renegotiating those reservations or sizing the array to stay within the reserved import limit. The utility strategy is therefore part of the solar design, not an afterthought.
Common Distribution Center Solar Design Mistakes
Distribution center projects fail or underperform for predictable reasons. Here are the most common design mistakes and how to avoid them.
1. Sizing by roof area instead of verified load
A large roof can fit a big array, but a big array that exports most of its production at avoided-cost rates loses money. Start with interval data and target high self-consumption.
2. Ignoring demand charges and time-of-use rates
Annual kWh offset is the wrong metric if the facility pays steep demand charges. Model the hourly bill, including peak windows, to size the array and battery correctly.
3. Treating the battery as a backup replacement
A battery improves economics and resilience, but it does not replace a generator for long-duration outages. Size backup power separately.
4. Skipping structural and roof review
Distribution center roofs carry heavy equipment and traffic. Adding ballasted solar without a structural review can overload the building. A leaky roof raises HVAC load and shrinks savings.
5. Forgetting future electrification
EV charging, electric forklifts, and automation increases future load. Size the electrical service, transformer, and solar inverter with headroom.
6. Poor interconnection and export assumptions
Export limits, net metering caps, and utility study timelines can derail a project. Submit a pre-application early and model the export value realistically.
Worked Example: 250,000 sq ft Distribution Center
Here is a practical sizing exercise for a 250,000 square foot ambient distribution center in the southern United States. The numbers are illustrative but realistic.
Inputs:
- Annual electricity use: 2,400,000 kWh
- Peak demand: 1,500 kW
- Daytime base load: 400 kW
- Local electricity rate: $0.12/kWh
- Demand charge: $15/kW/month
- Capacity factor for fixed-tilt rooftop: 22%
Sizing target:
The design targets 40 percent annual offset to keep self-consumption high. Target solar generation = 2,400,000 × 0.40 = 960,000 kWh/year.
Required DC capacity = 960,000 ÷ (8,760 × 0.22) = 498 kWp.
Round to a practical layout: 500 kWdc.
Cost before incentives:
- 500 kW at $1.65/W = $825,000
- 30% federal ITC = $247,500
- Net cost = $577,500
Savings:
- First-year solar generation: 500 kW × 8,760 × 0.22 = 963,600 kWh
- Avoided energy cost: 963,600 × $0.12 = $115,632
- Demand-charge savings with 375 kW / 1,500 kWh battery: 375 kW × $15 × 12 = $67,500
- Total first-year savings: roughly $183,132
- Simple payback: $577,500 ÷ $183,132 = 3.2 years
This is an aggressive but achievable case. If net metering pays only avoided-cost rates for exports, reduce the array size or increase the battery to lift self-consumption.
How SurgePV Automates Distribution Center Solar Design
Manual distribution center solar design often involves five or six disconnected tools: one for the load profile, one for the roof layout, one for shading and yield, one for string sizing, one for the financial model, and one for the proposal. Every time the load assumption or operating schedule changes, the chain of spreadsheets must be updated by hand. That is where design automation pays off.
solar design software like SurgePV keeps the entire workflow in one environment. You import the facility’s interval meter data, model the proposed array against real consumption, and run hourly PV generation simulations. The platform sizes the inverter and DC collection, calculates self-consumption, export, and demand-charge savings automatically, and generates a bankable customer-facing proposal.
For distribution center projects, three capabilities matter most:
- Load-aware sizing. Clara AI sizes the array against the actual load curve rather than a generic annual average, so the offset claim is accurate from the first iteration.
- Storage co-optimization. SurgePV models solar-plus-storage dispatch against time-of-use rates and demand charges, showing whether a battery improves project NPV or simply adds cost.
- Bankable proposals. The design outputs feed directly into a proposal with hourly production, cash flows, and sensitivity tables. This cuts the time from site visit to signed contract for EPCs and developers.
Large distribution center projects also benefit from detailed engineering support for permit packages and PE-stamped electrical drawings. Engineering consultancies such as Heaven Designs provide solar design services, detailed engineering, and PE-stamped permit design for EPCs that need extra capacity on complex commercial jobs. For the design-to-proposal workflow itself, solar proposal software keeps the financial and technical data consistent as the project evolves.
Design Distribution Center Solar in SurgePV
Model interval load, rooftop layouts, demand-charge savings, solar-plus-storage dispatch, and bankable proposals in one cloud platform.
Book a DemoNo commitment required · 20 minutes · Live project walkthrough
Next Steps for Your Distribution Center Solar Project
Distribution center solar in 2026 is a mature play with clear design rules, strong incentives, and a load profile that naturally fits PV. The projects that succeed treat the facility as a daytime operating load with real tariff exposure. They size the array for self-consumption, use storage to capture peak value, and coordinate with the operating schedule from day one.
Three actions will move you forward today:
-
Pull 12 to 24 months of interval data and benchmark the facility against typical distribution center energy use. Identify whether the roof, carport, or ground-mount path has the most buildable area.
-
Run a tariff-first design in solar design software. Model production hour by hour, then test three sizing scenarios against demand charges and export rules before finalising the kWp number.
-
Compare ownership, PPA, and lease structures using a solar proposal tool that handles Section 48E credits, bonus credits, depreciation, and distribution center cash flow. If you want a hands-on walkthrough, book a SurgePV demo.
Frequently Asked Questions
What is solar design for a distribution center?
Solar design for a distribution center is the process of sizing, laying out, and integrating a photovoltaic system to offset a warehouse or distribution facility’s electricity use. It starts with the actual load curve, models solar generation against daytime consumption, and selects mounting, storage, and interconnection options that maximize self-consumption and bill savings.
How much electricity does a distribution center use?
A non-refrigerated distribution center typically uses 6 to 14 kWh per square foot per year, while a standard warehouse uses closer to 5 to 6 kWh per square foot per year. Distribution and shipping centers are more energy-intensive than plain warehouses because of higher material-handling equipment, lighting, and dock-door activity.
How do you size a solar array for a distribution center?
Collect 12 to 24 months of interval meter data, identify the daytime baseload and seasonal peak, and choose a target offset that keeps most generation on-site. Divide the target annual kilowatt-hours by the local capacity factor to get DC kilowatts. A 1.5 million kWh/year facility targeting 40 percent offset at a 20 percent capacity factor needs about 855 kWdc of solar.
Which mounting option is best for distribution center solar?
Rooftop is usually best when the roof has adequate structural capacity and remaining life. Carports work when the roof is small or old and the site needs covered parking or EV charging. Ground-mount is the choice for large campuses with spare land. Many operators use a mix of rooftop and carport to maximize buildable area.
Should distribution center solar include battery storage?
Yes, when the facility pays high demand charges or faces time-of-use rates with steep evening peaks. A battery energy storage system captures midday solar surplus and discharges during peak windows. It reduces demand charges, improves self-consumption, and can support critical loads during short grid failures.
Can solar power run a distribution center during a grid outage?
Solar alone cannot guarantee continuous power through a long outage because generation stops at night and during bad weather. A solar-plus-storage system with a properly sized inverter and battery can ride through brief outages, but most facilities still keep backup generators for extended failures.
What incentives are available for distribution center solar in 2026?
In the United States, federal incentives include the 30 percent Investment Tax Credit under Section 48E, domestic content and energy community bonus credits, and MACRS depreciation for taxable owners. Rural facilities may qualify for USDA REAP grants and loan guarantees. State and utility rebates vary, so check the DSIRE database for current programs.
How much does commercial solar cost for a distribution center in 2026?
Commercial rooftop solar in 2026 typically costs $1.40 to $1.80 per watt DC before incentives, with benchmark pricing near $1.55/Wdc according to NREL (2024) and $1.71/Wdc according to SEIA and Wood Mackenzie (2025). A 500 kW system at $1.65/W costs roughly $825,000 before the 30 percent federal ITC.
What are the most common distribution center solar design mistakes?
The most common mistakes are sizing by available roof area instead of verified load, ignoring demand charges and time-of-use rates, treating the battery as a full backup replacement, skipping structural review, and failing to model export limits under local net metering rules.
How does SurgePV help with distribution center solar design?
SurgePV imports interval meter data, models rooftop or ground-mount layouts, simulates hourly generation against the facility load curve, sizes inverters and battery storage, and generates a bankable proposal with cash flows and incentives. The design-to-proposal workflow keeps load, layout, and financial data in one place.
Next Steps
- Pull 12 to 24 months of interval data and calculate actual load shape before sizing any array.
- Model hourly solar generation against the operating schedule to find the real self-consumption rate and export value.
- Book a SurgePV demo to run the full design-to-proposal workflow on one of your distribution center projects.
Where this fits
This article is part of SurgePV's Solar Design hub, which works through the topic from first principles to the decisions a project team actually has to make.



