

Solar ROI for agriculture is strong because farms are some of the most energy-intensive businesses per dollar of revenue. Energy costs including diesel, electricity and the energy embedded in fertilizer and pesticides typically account for 15 to 25 percent of total operating expenses on U.S. farms, according to USDA Economic Research Service analysis. For irrigation-intensive specialty crops, dairies, nurseries and farms with cold storage or packing facilities, the share often reaches 10 to 25 percent of total costs. Every kilowatt-hour generated on the farm is a direct reduction in one of the largest controllable cost lines.
The economics are also improving faster than many farmers realize. Commercial solar module prices have fallen sharply. The federal Investment Tax Credit remains at 30 percent for commercial projects placed in service in 2026, and USDA REAP grants can cover up to half of project cost for qualifying producers. Rising utility rates and the need to replace aging diesel pumps and generators add urgency. Solar is no longer an environmental statement. It is a balance-sheet decision.
This guide is written for farm owners, operators, agricultural energy managers and the EPCs that serve them. It explains how to calculate solar ROI for agricultural operations. It covers why the numbers differ from generic commercial solar, how irrigation, dairy and poultry loads change the math, and which financing structure captures the most value in 2026.
Quick Answer
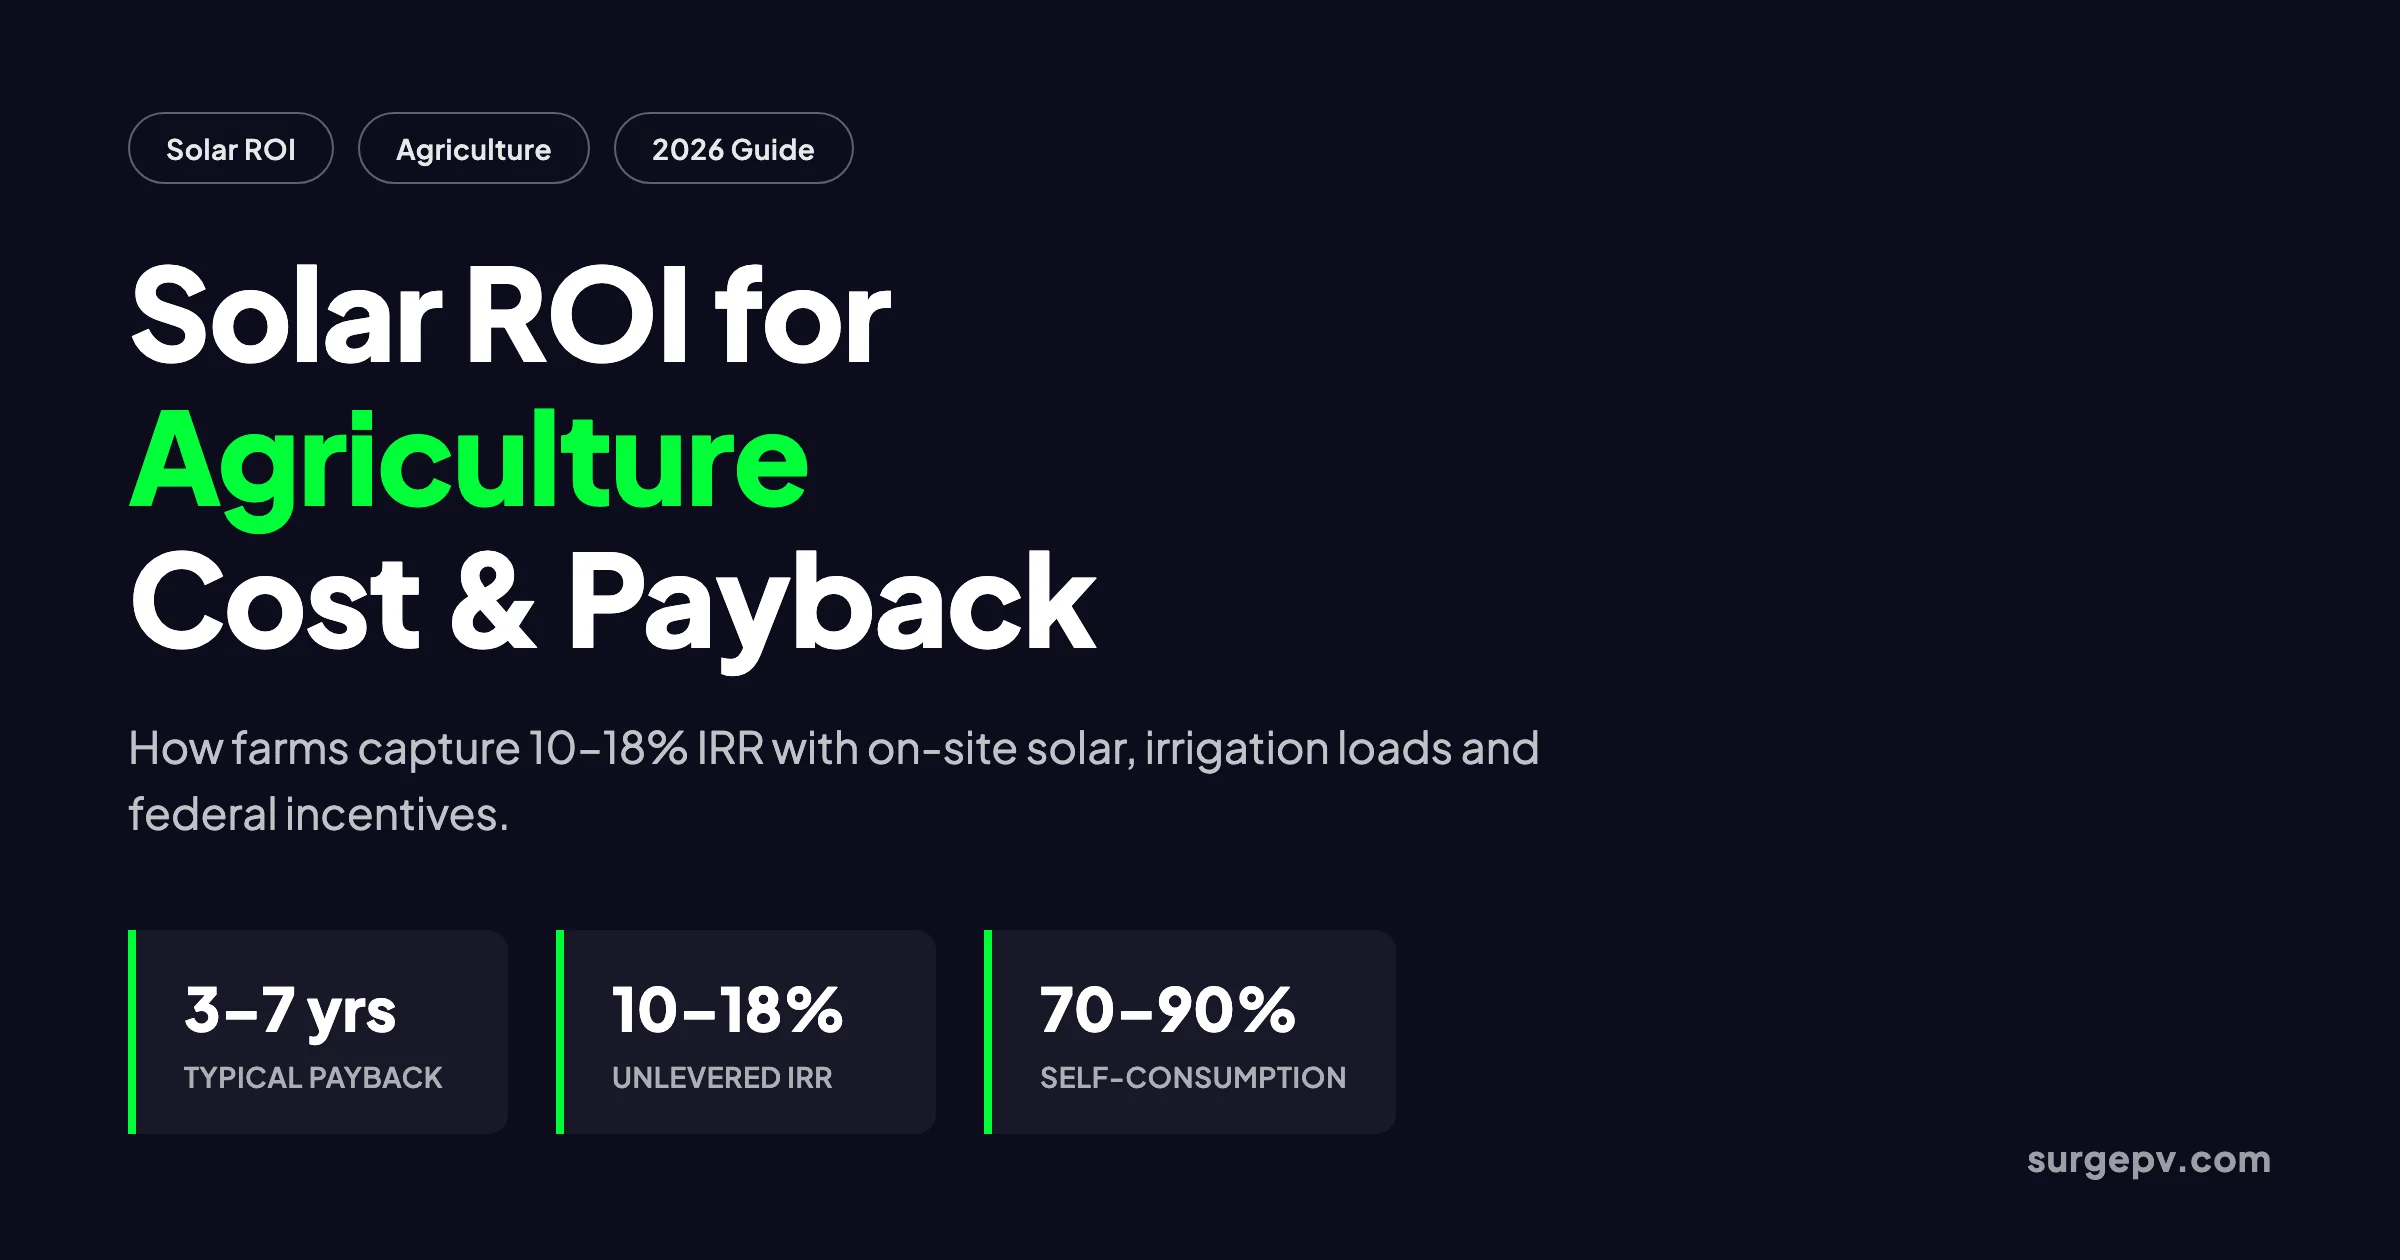
A well-designed on-farm solar system typically pays back in 3 to 7 years and generates a 10 to 18 percent unlevered IRR after federal incentives. Agriculture solar ROI is stronger than generic commercial solar because farms have large roof or land areas, high daytime loads, and electricity costs that often equal 10 to 25 percent of operating expenses.
What this guide covers:
- Why agriculture solar ROI differs from ordinary commercial solar
- How different farm types use energy and why load profile matters
- The full cost stack for an on-farm solar plus storage project
- A worked ROI calculation for a 500-acre grain and irrigation farm
- Ownership, PPA, lease and financing trade-offs
- How federal incentives including ITC, REAP and MACRS work in 2026
- When agricultural solar ROI does not clear hurdle rates
- Common modeling mistakes that kill farm solar ROI
Why Agriculture Solar ROI Is Different
Most commercial buildings consume power during business hours and shut down at night. Their solar self-consumption rate is often 30 to 50 percent, with the remainder exported to the grid. Agriculture often inverts that profile. Irrigation pumps, ventilation fans, milking parlors, grain dryers and packing houses run during the day. They create high self-consumption rates of 70 to 90 percent.
This high self-consumption rate is the first reason agriculture solar ROI is stronger. The second is the bill structure. Agricultural electricity tariffs include three large components:
- Energy charges: the per-kWh rate for electricity consumed
- Demand charges: a monthly fee based on the highest 15-minute average kW
- Transmission and distribution charges: fees for moving power across the grid
Solar avoids energy and delivery charges on the kilowatt-hours it produces onsite. A battery can shave the peaks that drive demand charges. The result is that on-farm solar typically captures 2 to 3 times more value per kWh than a remote utility-scale PPA.
The third difference is scale and space. Farms often have large, unobstructed roof areas on barns, poultry houses, dairy parlors and machine sheds. They also have land for ground-mount arrays or agrivoltaic systems that combine crop or grazing production with solar generation. The USDA-DOE Solar Energy and Farming Initiatives page tracks ongoing research on how agrivoltaics can preserve agricultural output while generating electricity.
The fourth difference is resilience. Power outages can kill poultry in ventilated houses, spoil milk in tanks, or halt irrigation during critical dry periods. Solar paired with storage can keep essential loads running. That resilience value is hard to model precisely, but it is often the deciding factor for farms in areas with unreliable grids.
How Farms Use Energy by Operation Type
A credible farm solar ROI model starts with the actual load profile. Different agricultural operations have very different energy signatures.
Irrigation and Pumping
Irrigation is one of the best solar loads in agriculture. Peak pumping demand usually coincides with peak solar generation during summer afternoons. A properly sized solar array can directly offset pump electricity at the full retail rate. Solar-powered irrigation also reduces or eliminates diesel generator use, which can cost $0.25 to $0.40 per kWh equivalent when fuel, maintenance and transport are included.
Typical energy intensity for irrigation varies widely:
| Irrigation Type | Energy Use | Notes |
|---|---|---|
| Center pivot, electric | 1,500–3,000 kWh per acre-foot pumped | High daytime load, strong solar fit |
| Drip/micro irrigation | 800–1,500 kWh per acre-foot | Pumping plus filtration loads |
| Diesel pump conversion | Varies | Solar displacement value equals diesel cost |
| Groundwater lift > 100 ft | Higher intensity | Deep wells increase per-unit energy |
Farms that combine solar with efficient irrigation can cut energy costs per acre while maintaining or improving yields.
Dairy Operations
Dairies consume electricity around the clock. Milking parlors run for several hours twice a day. Milk cooling and refrigeration run continuously. Feed mixing, ventilation and lighting add daytime load. A 150-cow dairy can easily consume 80,000 to 120,000 kWh per year.
Solar fits dairy operations well because daytime loads are high and steady. Battery storage can shift midday solar surplus to evening milking or provide backup for milk cooling. UK dairy case studies show payback periods of 3 to 5 years and 25-year returns of 5 to 8 times the initial investment when grants and tax relief are included.
Poultry Houses
Broiler and layer houses are among the most energy-intensive agricultural buildings per square foot. Ventilation fans, heating, cooling and lighting run continuously. A single modern poultry house can consume 40,000 to 80,000 kWh per year. Because ventilation is life-critical, backup power has real economic value.
Solar on poultry houses benefits from large roof areas and continuous daytime loads. Battery storage can maintain ventilation during outages, preventing catastrophic bird losses. UK poultry farm case studies show payback under 3 years for well-designed systems.
Cold Storage, Packing and Processing
Post-harvest cooling, packing houses and on-farm processing plants have high, steady electrical loads. These facilities share many characteristics with commercial cold storage. They often achieve the strongest solar economics of any farm operation. For a deeper dive, see our guide on solar ROI for cold storage.
The Cost Stack for Farm Solar in 2026
A credible ROI model starts with an accurate cost stack. The numbers below reflect US market pricing as of mid-2026 for a commercial-scale agricultural rooftop or ground-mount project.
| Component | Unit Cost | Notes |
|---|---|---|
| Solar PV modules and racking | $0.40–$0.60 per Wdc | Tier-1 modules, agricultural rooftop or ground mount |
| Inverters and switchgear | $0.14–$0.20 per Wdc | String or central inverters with monitoring |
| Installation and BOS | $0.18–$0.28 per Wdc | Structural, electrical, commissioning |
| Engineering and permitting | $0.08–$0.14 per Wdc | PE-stamped drawings, interconnection studies |
| Total rooftop solar CapEx | $1.10–$1.70 per Wdc | Before ITC, REAP and MACRS |
| Ground-mount premium | $0.10–$0.30 per Wdc | Adds land preparation, fencing, foundation |
| Agrivoltaic elevation premium | $0.30–$0.70 per Wdc | Elevated structures allow machinery or grazing |
| BESS | $250–$320 per kWh | 4-hour LFP system, installed |
| EPC margin and contingency | 8–12 percent of hard costs | Risk allocation and contractor overhead |
For a 250 kW rooftop solar array on a dairy or poultry operation, the pre-incentive capital cost ranges from $275,000 to $425,000. Adding 100 kWh of battery storage adds $25,000 to $32,000. Soft costs, EPC margin and contingency account for the remainder. The Lawrence Berkeley National Laboratory Utility-Scale Solar report tracks these cost benchmarks annually for the US market.
Operating costs are lower but persistent:
- O&M: $10 to $15 per kW per year for solar; $8 to $12 per kW-year for BESS
- Insurance: 0.4 to 0.6 percent of asset value per year
- Property tax: 0.8 to 1.5 percent of CapEx in most jurisdictions
- Inverter replacement: budget 15 to 20 percent of original inverter cost in year 12 to 15
- BESS replacement: plan 50 to 65 percent of original battery cost in year 12 to 15
These figures are for direct ownership. Under a PPA, many of them sit with the investor, but the farm pays a long-term energy rate that embeds the same costs plus investor return.
How to Calculate Solar ROI for a Farm
The cleanest way to value an agricultural solar project is a discounted cash-flow model. Inputs include capital cost, annual production, energy savings, demand-charge savings, tax credits, depreciation, O&M, financing and a discount rate. Outputs include simple payback, net present value and internal rate of return.
Here is a worked example for a hypothetical 500-acre Midwest grain farm with center-pivot irrigation. The numbers are illustrative; every farm needs its own load and production model.
Farm assumptions
- Irrigated area: 500 acres
- Annual consumption: 450,000 kWh
- Average blended rate: $0.12 per kWh
- Demand charge: $12 per kW per month
- Peak demand: 300 kW
- Annual demand charge: $43,200
- Diesel pump displacement: 20,000 kWh equivalent at $0.30 per kWh
Solar assumptions
- System size: 250 kW DC
- Specific yield: 1,500 kWh/kW/year
- Annual production: 375,000 kWh
- Self-consumption rate: 85 percent
- Exported production: 56,250 kWh at $0.05 per kWh
Cost assumptions
- Solar CapEx: $1.40 per Wdc = $350,000
- BESS: 100 kWh at $280 per kWh = $28,000
- Total hard cost: $378,000
- Soft costs and contingency at 12 percent: $45,360
- Total project cost before incentives: $423,360
Year-1 savings
- Onsite solar consumption: 318,750 kWh × $0.12 = $38,250
- Diesel displacement: 20,000 kWh × $0.30 = $6,000
- Export revenue: 56,250 kWh × $0.05 = $2,813
- Demand charge reduction: 80 kW × $12 × 12 = $11,520
- Total year-1 savings: $58,583
Incentives
- Federal ITC at 30 percent: $127,008
- MACRS 60 percent bonus depreciation plus 5-year schedule
- Tax shield value at 25 percent effective rate: approximately $70,000
Returns
- Net cost after ITC: $296,352
- Simple payback: 5.1 years
- Unlevered IRR over 25 years: approximately 14 percent
- 25-year NPV at 8 percent discount: approximately $520,000
Adding the battery increases upfront cost by $28,000 but can increase demand-charge savings by another $8,000 to $12,000 per year. In this example, the solar-plus-storage configuration pushes unlevered IRR above 15 percent and payback below 5 years.
A tool like SurgePV’s generation and financial tool models this exact stack. It imports interval data, applies local tariffs, and runs 25-year cash flows in one workflow.
Ownership, PPA, Lease and Financing Trade-offs
The financing structure changes the headline ROI more than most design choices. Farm owners should model each option against their balance sheet, tax appetite and land tenure.
| Structure | Upfront Cost | Who Owns Asset | Tax Benefits | Best For |
|---|---|---|---|---|
| Cash purchase | Full | Farm | Farm captures ITC, MACRS, depreciation | Owner-operators with tax appetite |
| Debt financing | 20–40 percent | Farm | Farm captures tax benefits; debt adds interest | Owners who want to preserve capital |
| PPA | $0 | Investor | Investor captures ITC and depreciation | Leased land or capital-constrained owners |
| Operating lease | Minimal | Lessor | Lessor captures tax benefits | Short-term occupancy or simple accounting |
Direct ownership captures the full economic value. It delivers the highest long-term IRR and leaves the operator with a depreciating asset. The main requirement is tax appetite. A farm that does not pay federal income tax cannot use the ITC directly unless it structures a partnership flip or sale-leaseback.
A behind-the-meter PPA preserves capital and fixes a long-term energy rate. It is often the right choice for tenant farmers or for owners who want O&M off their books. The trade-off is lower lifetime savings because the investor keeps the tax benefits and charges a risk premium.
A solar lease is the simplest structure but usually the most expensive over 20 years. It works best for operators who want a single line item and no asset management responsibility. For most farm owners with a 10-plus year hold period, cash purchase or debt financing wins.
Federal Incentives and Depreciation in 2026
The US federal incentive stack for farm solar remains substantial in 2026, though recent policy changes have added complexity. The key programs are:
- Investment Tax Credit (ITC): 30 percent of project cost for commercial solar and standalone storage placed in service in 2026. The Department of Energy federal solar tax credits for businesses page tracks current guidance.
- Domestic content bonus: 10 percentage points added to the ITC if the project uses domestic steel, iron and manufactured products.
- Energy community bonus: 10 percentage points added if the project is in a qualifying census tract tied to fossil-fuel employment or brownfield sites.
- MACRS depreciation: 60 percent bonus depreciation in 2026, with the remainder depreciated over five years.
- USDA REAP grants: can cover up to 50 percent of project cost for qualifying agricultural producers and rural small businesses. Recent USDA policy changes restrict ground-mount systems larger than 50 kW from receiving REAP loan guarantees and deprioritize them for grants. The USDA announcement details the current restrictions.
For a profitable farm offtaker, the tax shield from MACRS is worth roughly 20 to 25 percent of project cost on top of the ITC. A $400,000 project can therefore see effective net cost below $200,000 after incentives. That is why ownership beats a PPA in most tax-paying structures.
State and utility incentives vary widely. California’s Self-Generation Incentive Program, New York’s NY-Sun, and Massachusetts SMART program can add rebates or performance payments. The DSIRE database is the standard resource for checking state-level options.
Battery Storage, Peak Shaving and Resilience
Farm operators often ask whether battery storage is worth the extra cost. The answer depends almost entirely on the demand-charge rate and the value of backup power. In markets with demand charges above $12 per kW per month, batteries often pay for themselves in 4 to 7 years through peak shaving alone.
A battery can discharge during the highest 15-minute peaks. It can also store midday solar surplus and shift it into evening peak-rate periods. For agriculture, there is a third benefit: backup power. A 100 kWh battery paired with 250 kW of solar can keep critical ventilation, milk cooling or irrigation loads running for several hours during an outage.
The exception is markets with low demand charges and strong net metering. In those regions, a battery may extend payback rather than shorten it. The right way to decide is to model the farm’s actual 8760-hour load profile with and without storage.
When Agricultural Solar ROI Does Not Clear Hurdle Rates
Solar is not a universal winner on every farm. Several conditions can push payback beyond acceptable thresholds:
- Low electricity rates: Markets with commercial rates below $0.08 per kWh and demand charges below $8 per kW per month rarely justify behind-the-meter solar on savings alone.
- Weak solar resource: Facilities in the Pacific Northwest or heavily shaded sites may see production 25 to 35 percent below sunny markets.
- Short lease terms: A tenant with fewer than 10 years remaining cannot amortize a capital system. A PPA may still work if assignable.
- Restrictive interconnection or export limits: Some utilities cap commercial solar size, impose standby charges, or pay low export rates. These rules can kill project economics.
- Roof condition: A barn roof that needs replacement within 5 years adds $2 to $5 per square foot. Ground mounts avoid the roof but cost more and require land.
The honest approach is to set a hurdle rate and run a sensitivity table. If the base case is marginal, do not force the project. Wait for lower costs, better incentives, or a tariff change.
Common Mistakes That Kill Farm Solar ROI
Even strong sites can produce disappointing returns if the model is wrong. Watch for these errors:
- Valuing solar at a flat avoided energy rate. Farm solar value includes energy, demand, delivery, diesel displacement and resilience savings. Use only the energy rate and the project looks half as attractive as it really is.
- Ignoring seasonal load variation. A grain farm’s electricity use drops after harvest. A dairy’s load is steadier. Size the system for the lowest-value months, not the annual average.
- Overstating self-consumption. Summer solar surplus may exceed irrigation load if crops are mature or rainfall reduces pumping. Use an 8760-hour simulation.
- Undersizing the interconnection. A 250 kW array on a 100 kW service transformer will face export limits or costly upgrades.
- Forgetting load growth. Adding electric vehicles, expanding cold storage or converting diesel pumps to electric can change the optimal system size.
- Using residential design rules. Farms need commercial-grade equipment, three-phase inverters, and structural engineering for roof loads and wind/snow exposure.
The best projects start with 12 to 24 months of interval data, a structural assessment, and a production model that matches the farm’s actual load shape. SurgePV’s solar design software and irradiance and shading analysis tools help avoid these mistakes by importing real load data and simulating production hour by hour.
Frequently Asked Questions
What is a typical solar ROI for agriculture in 2026?
On-farm solar typically delivers a 10 to 18 percent unlevered IRR and a 3 to 7 year simple payback after the 30 percent federal Investment Tax Credit. The range depends on the farm type, local electricity rates, solar resource, self-consumption rate, and access to grants like USDA REAP or state incentives. Dairy, poultry and irrigation-heavy operations usually land at the better end of the range because they consume large amounts of daytime electricity.
Why is solar ROI often higher for farms than for ordinary commercial buildings?
Farms have large roof or land areas, high daytime electricity loads, and electricity costs that can reach 10 to 25 percent of operating expenses. Many agricultural loads such as irrigation pumps, ventilation fans, milking parlors and cold storage run during the day when solar produces the most power. High self-consumption rates of 70 to 90 percent are common, which maximizes the value of every kilowatt-hour by avoiding the full retail rate.
How much does an agricultural solar system cost in 2026?
Commercial-scale rooftop solar for farms costs roughly $1.10 to $1.70 per watt-direct-current before incentives. Ground-mount systems add $0.10 to $0.30 per watt. Battery energy storage systems run $250 to $320 per kilowatt-hour installed for a 4-hour lithium iron phosphate system. Soft costs including engineering, permitting and interconnection add 10 to 15 percent. A 250 kW rooftop array therefore lands between $275,000 and $425,000 before incentives.
Should a farm buy, lease or sign a PPA for solar?
Direct ownership captures the full economic value including tax credits, depreciation and residual asset value, and it delivers the highest long-term IRR. A behind-the-meter PPA preserves capital and fixes a long-term energy rate but passes tax benefits to the investor. A solar lease is simplest but usually the most expensive over 20 years. Choose ownership if the farm has tax appetite and a long-term hold period. Choose a PPA if capital is constrained or the land or buildings are leased.
Can battery storage improve farm solar ROI?
Yes, when demand charges exceed $12 per kW per month or when backup power protects high-value operations. A battery can pay for itself in 4 to 7 years through peak shaving and time-of-use arbitrage. For poultry houses, dairy parlors and cold storage, batteries also provide critical backup during outages. The financial case is strongest when grid reliability is low or time-of-use rates create large spreads between midday and peak prices.
What federal incentives apply to farm solar in 2026?
The federal Investment Tax Credit provides a 30 percent tax credit for commercial solar and standalone storage placed in service in 2026. Projects that meet domestic content requirements or are located in energy communities can add 10 percentage points each, lifting the credit to 40 or 50 percent. USDA REAP grants can cover up to 50 percent of project cost for qualifying agricultural producers and rural small businesses, though recent policy changes restrict ground-mount systems larger than 50 kW. Accelerated MACRS depreciation allows 60 percent bonus depreciation in 2026.
How do irrigation load profiles affect solar ROI?
Irrigation pumps are an ideal solar load because peak pumping demand usually coincides with peak solar generation during summer afternoons. A well-sized solar array can directly offset pump electricity at the full retail rate. Solar-powered irrigation also eliminates or reduces diesel generator use, which can cost $0.25 to $0.40 per kWh equivalent. The result is high self-consumption and strong per-kWh value.
What is the biggest mistake when modeling farm solar ROI?
The most common mistake is valuing solar production at a single flat avoided energy rate. Farm solar value comes from multiple streams: energy charge reduction, demand charge reduction, avoided transmission and distribution fees, diesel displacement, and resilience benefits. A model that uses only the energy rate understates value by 20 to 40 percent and produces an artificially long payback.
Does farm solar work on leased land or rented buildings?
It can, but the lease term must exceed the payback period. Most farm operators need at least 10 years of remaining lease term to justify a capital purchase. A PPA or lease can be structured to transfer with the lease or terminate when the lease ends. Landlord consent, roof warranty protection and interconnection rights must be documented before design work begins.
How long does an agricultural solar project take from feasibility to commissioning?
A typical farm solar project takes 8 to 16 months. Feasibility and energy audit take 1 to 2 months. Financing and incentive applications close in 2 to 4 months. Design and permitting run 2 to 4 months. Utility interconnection approval takes 2 to 4 months. Construction, scheduled around planting, harvest or animal cycles, lasts 1 to 3 months.
Next Steps
Agricultural solar is a finance project dressed up as an engineering project. The returns are real, but only if the model captures the full value stack.
- Start with 12 to 24 months of interval data and a structural roof or land assessment.
- Model energy, demand, delivery, diesel displacement and resilience savings separately. Do not rely on a flat avoided rate.
- Run ownership, PPA and lease scenarios side by side before choosing a financing structure.
If you are evaluating solar for your farm, book a SurgePV demo. See how SurgePV builds an hour-by-hour ROI model from your actual utility bills and irrigation schedules. You can also review solar software pricing or explore our commercial solar solutions for agricultural operations.
Where this fits
This article is part of SurgePV's Solar Business & Operations hub, which works through the topic from first principles to the decisions a project team actually has to make.
