Quick Answer
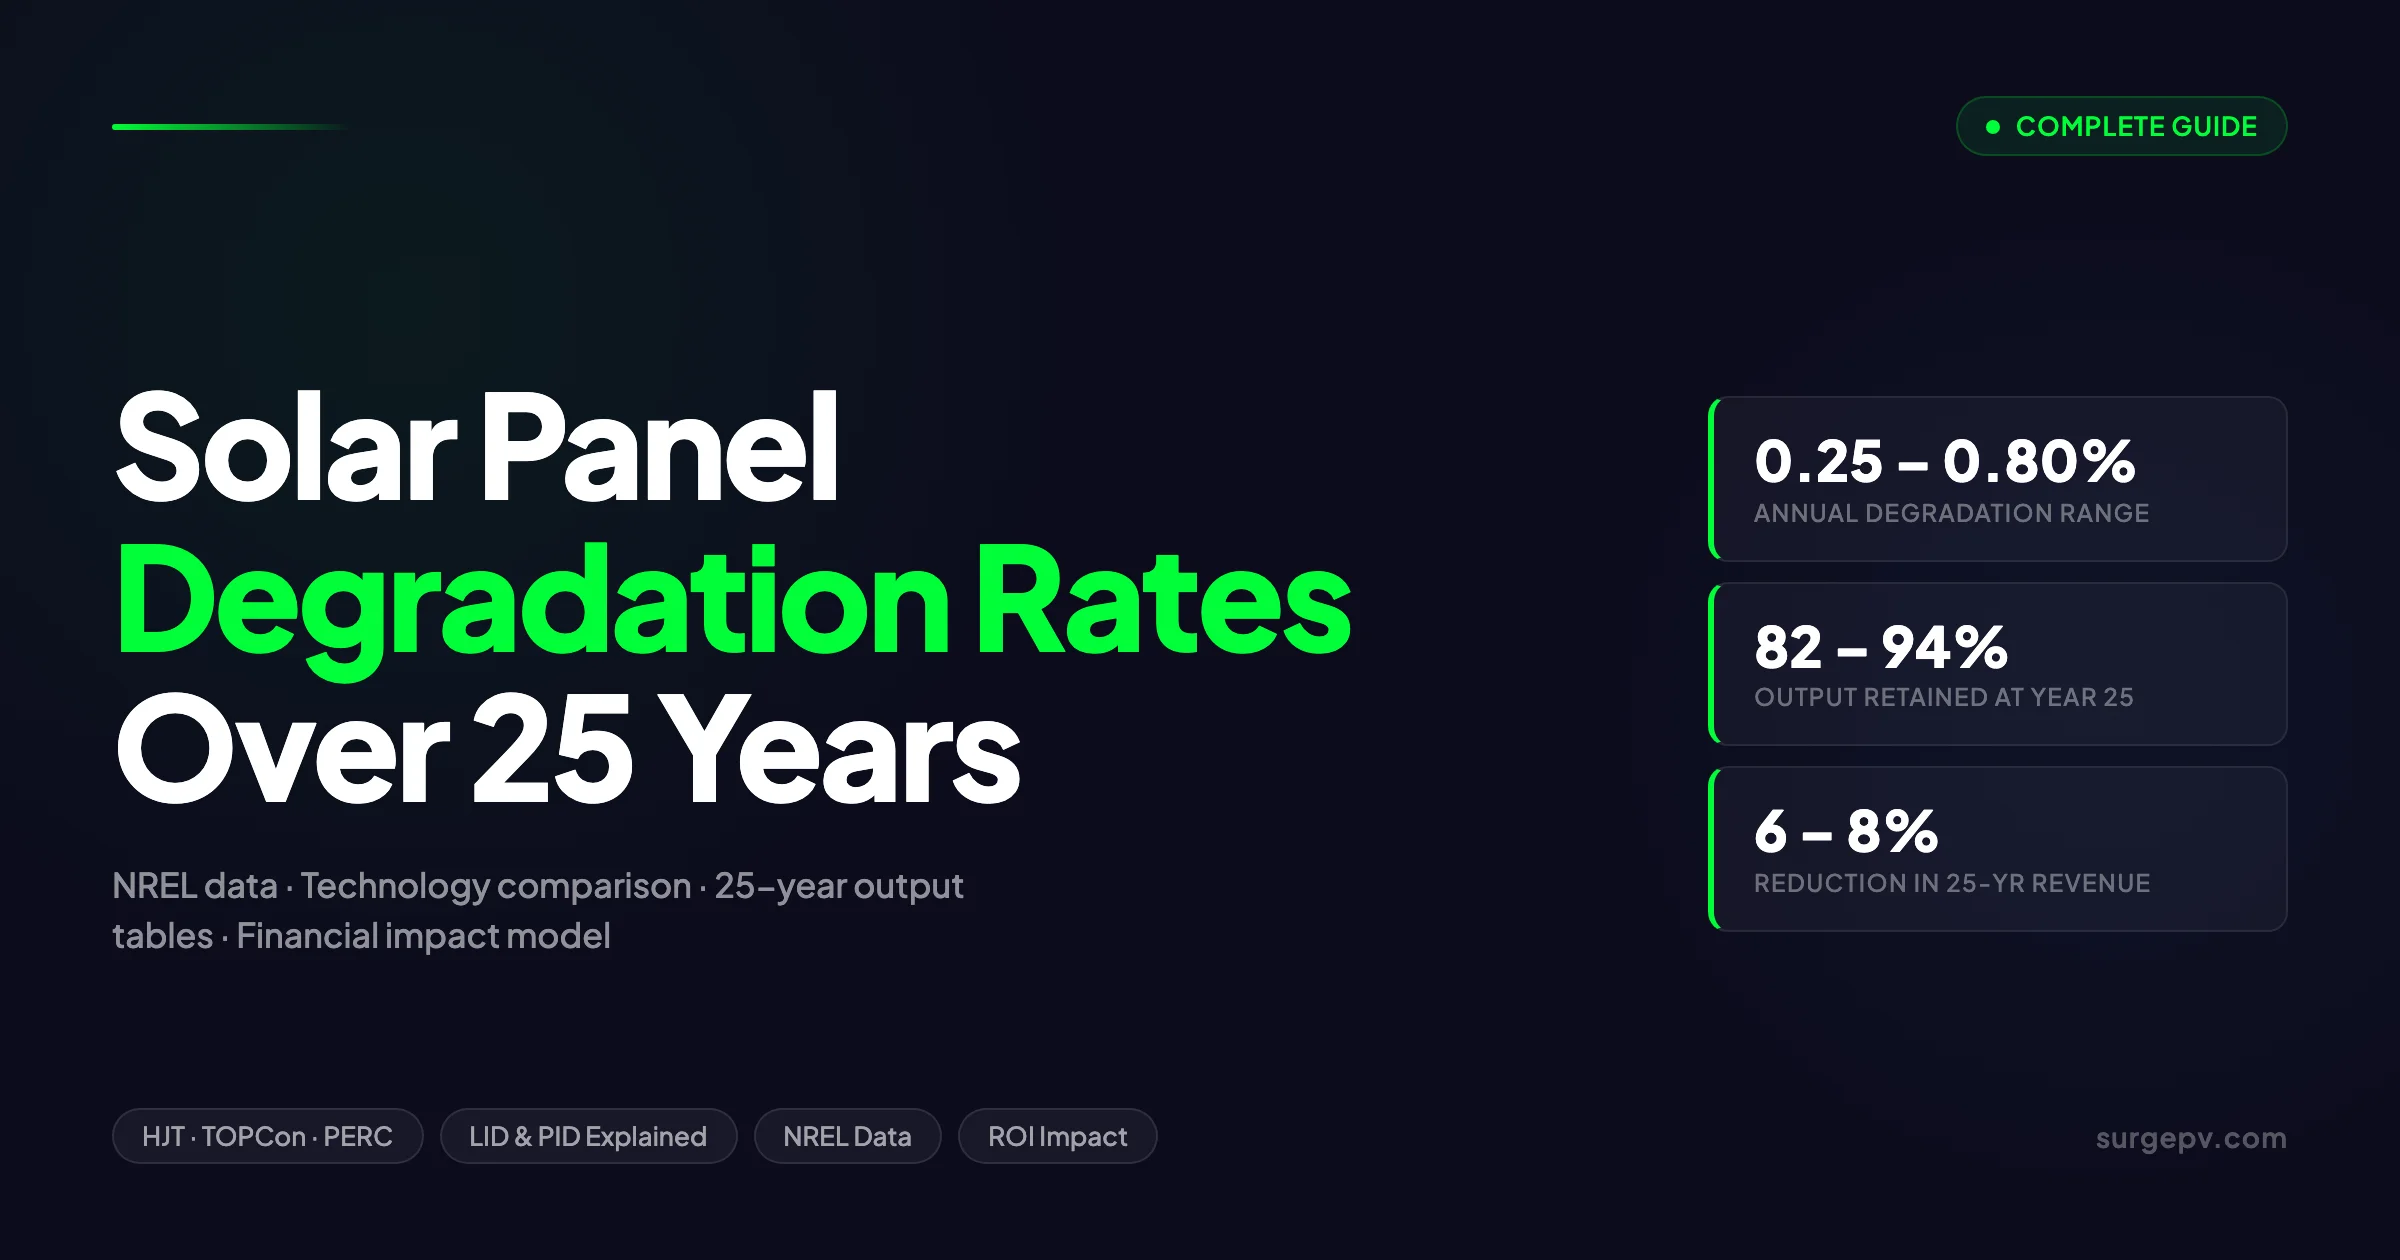
Solar panel degradation rates in 2026: PERC 0.45–0.55% per year, TOPCon 0.30–0.40%, HJT 0.25–0.35%. Tier-1 manufacturers guarantee 80–85% output after 25 years. Actual field performance often exceeds warranty claims by 2–5% due to conservative lab testing conditions.
A 400W solar panel will not produce 400W in year 25. No manufacturer claims otherwise — in fact, every performance warranty is built around the explicit acknowledgment that output will fall. The question is by how much, how fast, and whether the rate varies enough between panel technologies to affect which panels you specify. This guide covers all three questions with current data, covering the causes of solar panel degradation, real-world rates by technology and brand, 25-year projection tables for system designers, and a practical breakdown of how degradation affects ROI calculations.
Solar panel degradation rates in 2026: PERC 0.45–0.55% per year, TOPCon 0.30–0.40%, HJT 0.25–0.35%. Tier-1 manufacturers guarantee 80–85% output after 25 years. Actual field performance often exceeds warranty claims by 2–5% due to conservative lab testing conditions.
TL;DR — Solar Panel Degradation Rates
The NREL median degradation rate is 0.5%/year for modules. Premium HJT panels reach as low as 0.25%/year; older polycrystalline panels run at 0.7–0.8%/year. A 10 kW system with 0.5%/year degradation produces about 88% of rated output in year 25. Climate matters: hot climates see system-level degradation around 0.88%/year versus 0.5%/year in temperate zones. The financial cost of degradation over 25 years is roughly 6–8% of total cumulative revenue.
In this guide:
- NREL’s median degradation rate and what it means for system design
- First-year LID drop and why N-type panels avoid it
- Degradation rates by panel technology: Poly → PERC → TOPCon → HJT
- Degradation rates by manufacturer with current warranty data
- Causes of degradation: LID, PID, thermal cycling, UV, humidity
- How climate and geography affect real-world rates
- 25-year output projection tables for a 10 kW system
- Financial impact modeling and ROI implications
- Practical steps to reduce degradation on installed systems
- How to read a performance warranty before you buy
The Median Degradation Rate: What the Data Shows
The most-cited benchmark comes from a landmark NREL analysis of nearly 2,000 solar systems installed worldwide, published in 2012 and updated with subsequent datasets. The median degradation rate for PV modules is 0.5% per year.
That figure has held up across multiple follow-on studies. What has changed is the spread around that median. Older systems from the 1990s and early 2000s showed degradation rates of 0.7–1.0%/year. Modern systems, particularly those using N-type cell architectures, push the low end of the distribution down to 0.25–0.30%/year.
Module-Level vs. System-Level Degradation
There is a meaningful distinction between module degradation and system-level degradation — and it matters for yield modeling.
Module-level degradation measures only the decline in panel output at standard test conditions (STC). The 0.5%/year NREL median refers primarily to this.
System-level degradation is the decline in the AC energy delivered to the grid, which includes inverter performance decline, cable resistance changes, soiling accumulation, and racking micro-movement. NREL’s system-level analysis found a median of −0.75%/year, with a notable climate dependency:
| Climate Zone | Median System Degradation Rate |
|---|---|
| Temperate (Northern Europe, Pacific Northwest) | −0.5%/year |
| Mediterranean / Moderate | −0.6%/year |
| Hot Semi-Arid (Southern Spain, Southwestern US) | −0.75%/year |
| Hot Arid / Desert (Middle East, Rajasthan, Arizona) | −0.88%/year |
| Tropical Coastal | −0.80–0.90%/year |
When running financial models, use system-level rates rather than module-level rates. A 0.5%/year module sitting in Phoenix will have system-level degradation closer to 0.88%/year. Solar design software that models multi-year yield should apply climate-adjusted rates by default.
How the Rate Compounds Over Time
Annual degradation compounds like any percentage loss. Year 2 output is not simply year 1 minus 0.5% in absolute watts — it is year 1 multiplied by 0.995. The table below shows the cumulative effect.
| Year | 0.25%/yr | 0.40%/yr | 0.50%/yr | 0.70%/yr | 0.80%/yr |
|---|---|---|---|---|---|
| Year 1 | 99.75% | 99.60% | 99.50% | 99.30% | 99.20% |
| Year 5 | 98.8% | 98.0% | 97.5% | 96.5% | 96.1% |
| Year 10 | 97.5% | 96.1% | 95.1% | 93.2% | 92.3% |
| Year 15 | 96.3% | 94.2% | 92.8% | 90.0% | 88.7% |
| Year 20 | 95.1% | 92.3% | 90.5% | 86.9% | 85.1% |
| Year 25 | 93.9% | 90.5% | 88.2% | 83.9% | 81.8% |
The difference between 0.25%/year and 0.80%/year accumulates to a 12% output gap at year 25. For a 100 kW commercial system producing 130,000 kWh/year, that gap represents roughly 15,600 kWh/year less production by year 25 — a material number in any financial model.
Key Takeaway
Use system-level degradation rates (0.5–0.9%/year depending on climate), not the module-only 0.5%/year NREL median, when projecting P50/P90 energy yields over 20–30 years.
First-Year Drop: Light-Induced Degradation (LID)
Most panels do not degrade at a uniform rate from day one. P-type silicon panels — which includes every polycrystalline and standard mono PERC panel — experience a larger-than-normal output drop in the first days to weeks of outdoor exposure. This is Light-Induced Degradation (LID).
What Causes LID
LID occurs because standard boron-doped P-type silicon cells contain boron-oxygen (B-O) complexes. When photons strike the cell, these complexes form stable defects that reduce the minority carrier lifetime, cutting cell efficiency. The effect is essentially locked in once the panels reach thermal equilibrium during initial operation.
Typical first-year LID in P-type mono PERC and polycrystalline panels: 1–3% output loss. After this initial drop, the panel settles into the slower long-term degradation curve of 0.4–0.8%/year.
N-Type Panels and LID Immunity
This is the most practically significant advantage of N-type silicon (used in TOPCon and HJT panels). N-type silicon uses phosphorus doping instead of boron, eliminating the boron-oxygen complex mechanism entirely. TOPCon and HJT panels do not experience LID.
The implication for year 1 yield:
| Technology | First-Year Output (Year 1 vs. STC) | Reason |
|---|---|---|
| Polycrystalline (P-type) | 97–99% | LID: 1–3% drop |
| Mono PERC (P-type) | 97–99% | LID: 1–3% drop |
| TOPCon (N-type) | 99.5–100% | No LID |
| HJT (N-type) | 99.5–100% | No LID |
For a 100 kW system, a 2% first-year LID means losing 2,600 kWh in year 1 alone (assuming 130,000 kWh design yield). No recovery — LID is permanent.
Pro Tip
If you are modeling a PERC system for a client, apply a 1.5–2% first-year LID haircut to your P50 yield estimate in addition to the annual 0.5% degradation. Many yield models miss this and overstate year 1 production by a measurable margin.
LID-Preconditioning in the Factory
Some premium PERC manufacturers (notably LONGi and JA Solar) now factory-precondition modules to pre-trigger and stabilize LID before shipment. The panel arrives already at its post-LID steady-state efficiency. If your datasheet specifies “LeTID-free” or “LID preconditioning,” year 1 performance will match rated output more closely.
Degradation Rate by Panel Technology
Not all solar panels age at the same pace. The architecture of the solar cell — specifically the silicon type and passivation layer — has a direct bearing on long-term degradation.
The Technology Degradation Hierarchy
| Technology | Cell Type | Annual Degradation Rate | Year 25 Retained Output |
|---|---|---|---|
| HJT (Heterojunction) | N-type | 0.25–0.27%/yr | ~94% |
| TOPCon (Tunnel Oxide Passivated Contact) | N-type | 0.30–0.40%/yr | 90.5–93% |
| Mono PERC (Passivated Emitter Rear Cell) | P-type | 0.40–0.55%/yr | 87–90.5% |
| Polycrystalline BSF | P-type | 0.70–0.80%/yr | 82–84% |
| Thin-Film (CdTe, CIGS) | Non-silicon | 0.40–0.50%/yr | 88–90.5% |
HJT — The Lowest Degradation Rate
HJT panels combine a crystalline silicon wafer with amorphous silicon passivation layers on both sides. This architecture provides two advantages: zero LID (N-type base) and exceptional temperature stability (low temperature coefficient, typically −0.26%/°C versus −0.35%/°C for PERC). Both factors reduce long-term degradation.
Real-world HJT degradation from independent analysis: 0.25–0.27%/year. Maxeon (formerly SunPower) and REC Alpha series are the leading commercial examples, both warranting 0.25%/year.
TOPCon — The Mid-Point Between PERC and HJT
TOPCon uses a thin tunnel oxide layer on the rear of an N-type wafer to minimize recombination. It delivers better efficiency than PERC (typically 22–24% vs. 20–22%) and lower degradation, without matching HJT’s temperature coefficient performance. TOPCon now dominates new factory capacity — Jinko, LONGi, Trina, Canadian Solar, and most major Chinese manufacturers have shifted primary production to TOPCon.
TOPCon degradation in warranty documents: typically 0.35–0.40%/year. Some premium models (JinkoSolar Tiger Neo 3.0, LONGi Hi-MO 9) spec 0.3%/year.
Mono PERC — The Current Middle Ground
The installed base of solar panels worldwide is dominated by Mono PERC, which was the technology standard from approximately 2017 through 2023. PERC panels achieve 20–22% efficiency and degrade at 0.40–0.55%/year in practice. The spread within this range depends heavily on encapsulant quality and encapsulation tightness — both of which vary between manufacturers.
Polycrystalline — The Legacy Option
Polycrystalline panels are largely discontinued for new projects but remain widespread in installations from 2010–2018. Their degradation rate of 0.70–0.80%/year means a 300W panel installed in 2015 may produce as little as 246W (82%) by 2040. When evaluating aging assets, applying 0.8%/year to any pre-2018 polycrystalline installation is a conservative but defensible assumption.
Key Takeaway
Specifying TOPCon over Mono PERC for a 20-year project adds approximately 2–3% more lifetime output at comparable costs. For large commercial or utility projects, this is a significant yield difference — model it explicitly in the financial case rather than using a single generic degradation rate.
Degradation Rate by Manufacturer
Manufacturer warranty data is the most practical tool for comparing degradation commitments. The linear performance warranty specifies both the first-year floor and the annual degradation rate through year 25 (or longer). Here is current data for the major panel brands:
| Manufacturer | Model | Cell Type | Warranted Annual Degradation | Year 25 Guarantee |
|---|---|---|---|---|
| Maxeon (SunPower) | Maxeon 7 | HJT/IBC | 0.25%/yr | 92% |
| REC Group | Alpha Pro | HJT | 0.25%/yr | 92% |
| Panasonic* | EverVolt HK | HJT | 0.25%/yr | 92% |
| JinkoSolar | Tiger Neo 3.0 | TOPCon N-type | 0.30%/yr | 87.4% |
| LONGi | Hi-MO 9 | TOPCon N-type | 0.35%/yr | 87.4% |
| Trina Solar | Vertex S+ | TOPCon N-type | 0.40%/yr | 87.4% |
| Canadian Solar | HiHero | TOPCon N-type | 0.40%/yr | 87.4% |
| JA Solar | JAM72D42 | TOPCon N-type | 0.40%/yr | 87.4% |
| Q-Cells | Q.PEAK DUO ML-G12+ | Mono PERC | 0.54%/yr | 86% |
| First Solar | Series 7 | CdTe Thin-Film | 0.40%/yr | 90.1% |
*Panasonic exited solar manufacturing in 2024. Existing warranty obligations are being managed through service agreements; REC acquired the technology.
What “87.4% at Year 25” Actually Means
The 87.4% guarantee that appears on many TOPCon warranty documents is not based on 0.40%/year compounding — it is the floor guarantee, calculated using a linear model: 100% − (0.40% × 25) = 90%. But manufacturers also specify a first-year floor (typically 98%) and then a linear step to the 25-year minimum. The math works out to 87.4% in practice because of the additional first-year step-down.
If actual degradation tracks at 0.35–0.40%/year, real-world year 25 performance will typically exceed the warranty floor by 1–3 percentage points.
The Premium vs. Commodity Gap
The 0.25%/year vs. 0.54%/year spread between HJT premium and standard PERC translates to a ~6% lifetime output gap — for a 500 kW system, that is roughly 33,000 kWh/year more by year 25 from the premium option. Whether that justifies the typical 10–15% higher upfront cost depends on the project’s electricity rate and discount rate, and is worth modeling explicitly in any generation and financial tool.
What Causes Solar Panels to Degrade
Degradation is not a single mechanism — it is the cumulative result of several independent failure modes operating simultaneously. Understanding which mechanisms dominate at different project sites helps in selecting the right panel and designing the system to minimize degradation.
1. Light-Induced Degradation (LID)
As covered above, LID is a first-year phenomenon in P-type silicon panels causing a 1–3% permanent output reduction. It is caused by boron-oxygen complexes forming stable recombination centers under illumination. N-type panels do not exhibit LID.
A related phenomenon — LeTID (Light and Elevated Temperature Induced Degradation) — can affect PERC panels during hot weather in the first few months of operation, causing an additional 1–5% loss before recovery. LeTID is more variable than LID and depends on operating temperature history. Premium PERC manufacturers address it through cell processing optimization or factory preconditioning.
2. Potential-Induced Degradation (PID)
PID is driven by high system voltages and humidity. When a voltage differential exists between the solar cell and the grounded module frame (common in high-voltage string systems), sodium ions migrate from the module glass through the encapsulant to the cell surface, creating shunting paths that reduce power output. High humidity accelerates ion mobility.
PID can cause 5–30% output loss in severe cases and is one of the more dramatic degradation failure modes. It is particularly prevalent in:
- Hot, humid climates (Southeast Asia, Florida, West Africa)
- Systems with negative-grounded strings at high voltage
- Older EVA encapsulant formulations For Africa-specific compliance details, see Africa solar compliance.
Mitigation: Modern anti-PID encapsulants and IEC 62804-certified panels dramatically reduce susceptibility. System design choices also matter — using positive-grounded or ungrounded inverter configurations reduces the electric field driving PID.
3. Thermal Cycling
Every day, a solar panel heats up to 50–85°C under load and cools to ambient overnight. In a typical installation with 5,000+ operating hours per year, a panel undergoes roughly 1,000–1,500 thermal cycles per decade. This mechanical stress causes:
- Micro-cracks in solar cells (visible with electroluminescence imaging)
- Fatigue failure in solder joints connecting cell ribbons
- Delamination between the encapsulant and glass
Micro-cracks from thermal cycling do not cause immediate power loss, but they degrade power output over time as the effective cell area shrinks. They also create entry points for moisture. IEC 61215 testing certifies panels to 200 thermal cycles — far fewer than the real-world lifetime exposure, which is one reason that real-world degradation rates sometimes exceed datasheet estimates for installations in extreme climates.
4. UV Exposure
Ultraviolet radiation from sunlight breaks down the encapsulant (typically EVA — ethylene vinyl acetate) and the backsheet polymer over time. Degraded EVA yellows, increasing optical absorption and reducing transmittance. Some backsheets crack or delaminate. Both effects reduce power output and can allow moisture ingress.
Modern UV-stabilized encapsulants (POE — polyolefin elastomer — is becoming the premium choice over EVA) show improved UV resistance. First Solar’s thin-film modules use glass-glass construction, eliminating the backsheet UV degradation pathway entirely.
5. Moisture Ingress and Corrosion
Water vapor permeates all polymer-based module construction over time. Inside the module, moisture:
- Corrodes the silver metallization on cell fingers
- Degrades the anti-reflection coating
- Causes delamination between the encapsulant and cell surface
Damp heat testing (IEC 61215: 1,000 hours at 85°C/85% RH) is the industry stress test for moisture resistance. Glass-glass construction (no polymer backsheet) offers significantly better moisture barriers than glass-backsheet modules. For projects in coastal or tropical environments, glass-glass bifacial modules are worth specifying despite their higher cost. See Bifacial Solar Panel Design Guide for detailed guidance.
6. Soiling and Physical Degradation
Dust, bird droppings, pollen, and other surface deposits reduce light transmission and cause localized hot spots. While soiling is technically a performance loss rather than structural degradation, in arid regions it can account for 5–15% annual performance loss if not managed. Accumulated soiling that creates hot spots can accelerate cell microcracks and encapsulant degradation.
Soiling is the one degradation factor directly controllable through O&M. Regular cleaning in high-soiling environments is one of the highest-return O&M activities.
How Climate and Location Affect Degradation
Geography is not merely background context for degradation — it is one of the primary variables. NREL’s analysis found climate-dependent system degradation rates ranging from −0.5%/year in temperate regions to −0.88%/year in hot arid climates. That 0.38%/year difference compounds to a 9% lifetime output gap between a panel installed in Scotland versus the same panel installed in the Sahara. For the latest details on UK, see Battery Solar System Design UK.
Desert / Hot Arid Climates
High irradiance means high panel operating temperatures (cells regularly exceed 70–80°C). This accelerates both thermal cycling damage and UV encapsulant degradation. The saving grace is low humidity — coastal corrosion and PID from moisture are less prevalent. However, soiling from dust and sand is severe, creating a soiling-driven performance loss on top of accelerated structural degradation.
Key regions: Arizona, Nevada, Saudi Arabia, Rajasthan, Atacama. Expected system degradation: 0.75–0.90%/year.
Tropical / Coastal Climates
High humidity combined with high temperatures creates the worst environment for moisture-related degradation. PID is more prevalent, delamination occurs faster, and corrosion of metallization is accelerated. Salt spray in coastal locations adds chemical attack on frames and junction boxes.
Key regions: Southeast Asia, Florida, West Africa, Caribbean, parts of Brazil. Expected system degradation: 0.80–0.90%/year or higher without premium moisture-resistant modules.
Temperate / Maritime Climates
Lower temperatures reduce thermal stress. Lower UV irradiance slows encapsulant degradation. Moderate humidity does not reach the extremes of tropical environments. Snow loading in colder temperate regions adds mechanical stress, but modern racking is designed for it.
Key regions: Northern Europe, Pacific Northwest, Japan (northern), New Zealand. Expected system degradation: 0.45–0.55%/year.
Mediterranean Climates
Moderate temperatures and humidity with high summer irradiance. Real-world results cluster near the 0.5–0.6%/year range. Spain, Portugal, Italy, and Australia’s southeastern states fall into this category. Also see: solar panel ROI in Italy. For the latest details on Italy, see Commercial Rooftop Solar Case Study Italy. For Australia-specific compliance details, see Australia comparisons/lgc-vs-stc.
Key Takeaway
When a manufacturer quotes a 0.40%/year warranty degradation rate, that rate was tested at STC. The climate-adjusted system degradation for the same panel installed in Gujarat or Texas may run 0.80%/year. Always apply climate-specific adjustment factors in long-term yield models.
25-Year Output Projections: Performance Tables
The following tables model a 10 kW DC system for three scenarios — conservative (0.80%/year, older poly or hot climate), typical (0.50%/year, modern PERC in temperate climate), and premium (0.25%/year, HJT in temperate climate). Assumed Year 1 system output: 13,000 kWh (1,300 kWh/kWp, typical for Central Europe or moderate US climate).
Table 1 — Annual Energy Production by Degradation Scenario
| Year | 0.25%/yr (Premium HJT) | 0.50%/yr (Mono PERC) | 0.80%/yr (Poly / Hot Climate) |
|---|---|---|---|
| Year 1 | 13,000 kWh | 13,000 kWh | 13,000 kWh |
| Year 5 | 12,844 kWh | 12,675 kWh | 12,493 kWh |
| Year 10 | 12,675 kWh | 12,363 kWh | 12,001 kWh |
| Year 15 | 12,519 kWh | 12,062 kWh | 11,531 kWh |
| Year 20 | 12,363 kWh | 11,765 kWh | 11,063 kWh |
| Year 25 | 12,207 kWh | 11,466 kWh | 10,634 kWh |
Cumulative 25-year production:
- 0.25%/yr: ~310,700 kWh
- 0.50%/yr: ~304,500 kWh
- 0.80%/yr: ~295,700 kWh
The premium HJT scenario produces 15,000 kWh more over 25 years than the high-degradation scenario — equivalent to roughly 1.15 years of full system output, worth €3,750–€6,000 at European retail electricity rates.
Table 2 — Rated Power Remaining at 25 Years (10 kW System)
| Degradation Rate | Output at Year 25 | Remaining Power (kW) |
|---|---|---|
| 0.25%/yr (HJT premium) | 93.9% | 9.39 kW |
| 0.30%/yr (TOPCon premium) | 92.8% | 9.28 kW |
| 0.40%/yr (TOPCon standard) | 90.5% | 9.05 kW |
| 0.50%/yr (Mono PERC) | 88.2% | 8.82 kW |
| 0.70%/yr (older panels) | 83.9% | 8.39 kW |
| 0.80%/yr (polycrystalline) | 81.8% | 8.18 kW |
The warranty minimum for most 25-year warranties falls between 80% and 92% depending on the manufacturer tier. Premium warranties (Maxeon 40-year, REC 25-year) guarantee 92% at year 25, providing a buffer above even the warranted floor.
Model Degradation Across 25 Years in SurgePV
SurgePV’s generation and financial tool applies climate-adjusted degradation rates to every annual yield projection — so your clients see realistic 25-year production figures, not optimistic first-year extrapolations.
Book a DemoNo commitment required · 20 minutes · Live project walkthrough
For a direct comparison, see Arka 360 vs SurgePV.
Financial Impact: What Degradation Costs Over 25 Years
Understanding the energy numbers is one part of the picture. The other part is what degradation costs the project owner in actual money. The answer is less alarming than the efficiency percentages suggest.
The Electricity Escalation Offset
Degradation reduces kWh output by roughly 0.5% per year. But retail electricity prices in most markets escalate by 3–4% per year over the long run. These two rates move in opposite directions, and for the typical residential or commercial project, escalation dominates.
Example:
A homeowner’s system avoids €0.30/kWh in year 1. In year 10, the system produces 95.1% of its original output — but the electricity rate has risen to €0.40/kWh (3% annual escalation). Their annual savings in year 10 are higher than in year 1 in nominal terms despite the panel degradation.
This offsets most of the degradation impact when measuring IRR or NPV. The net effect of degradation on the financial case is typically a 6–8% reduction in 25-year cumulative savings compared to a hypothetical non-degrading system. That is real money — but it is not the 12–18% you might assume from looking at the year 25 output percentage alone.
Where Degradation Rate Matters Most
The financial sensitivity to degradation rate is highest when:
- Electricity prices are regulated and not escalating (some utility contracts, PPAs with fixed rates)
- The project is sensitivity-tested at P90 rather than P50 — a higher degradation assumption significantly reduces P90 yield
- The project uses aggressive degradation assumptions for debt sizing — lenders often require 0.7%/year or 1%/year degradation in conservative financial models
- The project has a short contract or resale horizon — year 10 production matters more than year 25 if you plan to sell the asset
For projects modeled with the generation and financial tool, running two scenarios — one at warranted degradation, one at climate-adjusted system degradation — gives a defensible range for IRR and payback period.
Cumulative Revenue Impact: A 100 kW Commercial Example
Assume a 100 kW commercial system in Southern Europe generating 140,000 kWh/year at €0.10/kWh PPA rate with no escalation clause:
| Degradation Rate | Year 25 Annual Production | Year 25 Annual Revenue | 25-Year Cumulative Revenue |
|---|---|---|---|
| 0.25%/yr | 131,460 kWh | €13,146 | €318,600 |
| 0.50%/yr | 123,480 kWh | €12,348 | €309,800 |
| 0.80%/yr | 114,520 kWh | €11,452 | €298,500 |
The difference between 0.25%/year and 0.80%/year over 25 years: €20,100 in cumulative revenue from the same hardware footprint. For a €100,000–€120,000 initial project cost, the degradation rate choice is worth a 20% difference in cumulative revenue — solidifying the case for premium modules in long-duration PPA contracts.
Key Takeaway
Degradation rate is most financially significant in fixed-rate PPA or export tariff scenarios without electricity price escalation. In self-consumption models with rising retail rates, escalation offsets most of the degradation impact, making the premium-panel financial case weaker.
How to Reduce Solar Panel Degradation
While some degradation is inevitable, several mechanisms are largely preventable through panel selection, system design, and O&M practices.
1. Choose N-Type Panels for LID-Free Operation
Specifying TOPCon or HJT eliminates LID entirely and reduces long-term annual degradation by 0.1–0.3%/year versus comparable PERC. For any project with a 15-year-plus operating horizon, the yield case for N-type is straightforward. The premium is typically 3–8% in module cost — often recoverable within 3–5 years through additional yield in high-electricity-price markets.
2. Mitigate PID Through System Design
PID risk can be reduced without changing the panel specification:
- Use inverters with positive-grounded or ungrounded (IT network) configurations to minimize the voltage differential across the module stack
- Specify anti-PID certified modules (IEC 62804 / IEC TS 62804-1:2015)
- In high-humidity sites, consider glass-glass construction which reduces encapsulant ion mobility
- For existing installations with PID, PID recovery boxes that apply a reverse voltage overnight can partially restore lost capacity
3. Maintain Adequate Ventilation and Airflow
Cell temperature under load is the dominant variable in thermal cycling stress. Higher operating temperatures mean:
- Larger daily temperature swings → more thermal cycle stress
- Higher activation energy for degradation chemistry
Ensure at least 10–15 cm clearance between the module backsheet and the roof surface for pitched roof systems. Poorly ventilated flush-mount installations can push operating temperatures 10–15°C higher than well-ventilated racking, measurably accelerating degradation.
4. Regular O&M: Thermal Imaging and Cleaning
Annual electroluminescence (EL) imaging or thermal drone inspections identify microcracks and hotspot cells before they cascade into visible power loss. Catching a failing bypass diode or severe microcrack cluster early allows targeted replacement rather than silent long-term performance decline.
Regular cleaning removes soiling that creates hot spots. In high-soiling regions (desert, agricultural proximity, heavy traffic corridors), cleaning twice per year reduces effective degradation contributions from soiling by 70–90%. In low-soiling temperate climates, annual cleaning is usually sufficient.
Solar shadow analysis software that integrates real-time performance data can help identify panels degrading faster than modeled — a signal for inspection before the performance loss compounds.
5. Protect the Backsheet and Junction Box
Inspect backsheet condition annually in high-UV or high-temperature environments. Cracking backsheets are an early indicator of accelerated delamination to come. Junction box seals are a common moisture ingress point — verify IP67 or IP68 ratings for coastal or humid site specifications.
Reading the Performance Warranty: What the Numbers Mean
A performance warranty is the manufacturer’s financial commitment on degradation. But not all warranties are structured the same way, and the language matters for asset valuation and insurance purposes.
Step vs. Linear Warranties
Step warranty: Specifies output floors at fixed intervals (year 10, year 25). Offers no protection against accelerated degradation in the years between checkpoints. Most legacy warranties from pre-2015 panels use this format.
Example: “98% at year 1, 80% at year 25.” No guarantee about year 10 — a panel at 83% in year 10 technically passes.
Linear warranty: Specifies a continuous annual degradation ceiling — typically expressed as “not more than 0.5% per year after year 1.” Offers year-by-year protection. All major manufacturers now offer linear warranties on premium lines.
Example: “98% at year 1, not more than 0.40%/year degradation thereafter.” Year 10 floor = 98% − (0.40% × 9) = 94.4%.
Linear warranties are materially better for project finance and asset resale. Lenders and buyers can model annual floor performance with confidence. If you are buying an installed asset, verify whether the original warranty was step or linear before applying a degradation rate assumption.
First-Year Floor
Most warranties specify a separate first-year power floor of 97–99.5%, covering LID and manufacturing tolerance. This is independent of the annual degradation rate. A 0.40%/year warranty paired with a 97% first-year floor means:
- Year 1 minimum: 97%
- Year 2 minimum: 97% − 0.40% = 96.6%
- Year 25 minimum: 97% − (0.40% × 24) = 87.4%
Warranty Transferability and Issuer Risk
The warranty is only as good as the manufacturer’s ability to honor it. LG Solar exited manufacturing in 2022. Panasonic exited in 2024. Warranty claims for these panels now depend on negotiated service agreements. Before specifying a manufacturer for a long-duration project, verify: (a) they are still actively manufacturing, and (b) their financial standing supports a 25+ year liability.
For project finance, lenders often require a bankability assessment of panel warranties from independent engineers. Refer to solar warranty claims for installers for a detailed breakdown of the claims process and what documentation is required.
How Solar Design Software Should Model Degradation
Degradation modeling is one area where generic yield simulation tools and professional-grade solar software diverge significantly. Generic tools often apply a fixed 0.5%/year to every project regardless of technology or climate. This creates systematic yield overestimates for projects in hot climates and underestimates the yield gap between different panel generations.
What to Model in a Rigorous Yield Simulation
A proper 25-year yield model should include:
- First-year LID haircut for P-type panels — typically 1.5–2%
- Annual module degradation rate matched to the specific panel technology and manufacturer warranty
- Climate-adjusted system degradation — add 0.1–0.3%/year above the module rate depending on climate severity
- Soiling-adjusted annual production loss — climate-dependent, site-specific where possible
- Inverter replacement assumption — central inverters typically replaced once in a 25-year project life, affecting the degradation slope around year 10–12
For commercial and utility projects, running the simulation at both P50 (median degradation) and P90 (conservative degradation) provides a defensible yield range for bankability. The P90 simulation typically uses a degradation rate 0.1–0.2%/year above the P50 assumption.
SurgePV’s generation and financial tool applies technology-specific degradation curves and generates 25-year P50/P90 yield projections — giving installers the financial modeling depth that utility-scale engineers use, applied to residential and commercial projects. This is directly relevant when comparing panel options: the output difference between a 0.35%/year TOPCon and a 0.54%/year PERC specification becomes visible in the 25-year IRR calculation rather than disappearing in a flat-rate estimate.
For reference on how system losses beyond degradation are modeled, solar system losses covers the full loss breakdown from DC to grid — including clipping, cable losses, and availability factors that interact with the degradation timeline. Read Solar Inverter Clipping for a complete walkthrough.
Comparing Panel Technologies: Where Degradation Fits the Broader Decision
Degradation rate is one element of the technology selection decision. It interacts with efficiency, temperature coefficient, bifaciality, and cost in ways that require integrated analysis.
The move from Mono PERC to TOPCon is the most common upgrade path in 2026. The yield case for TOPCon includes:
- 1–2% higher initial efficiency (22–24% vs. 20–22%)
- Elimination of LID (1.5–2% first-year recovery)
- 0.1–0.15%/year lower annual degradation
Combined, a TOPCon panel at equal rated wattage generates measurably more energy over a 25-year project life than PERC — particularly in the first 5 years where the LID advantage is most visible. For a deeper comparison of the three leading technologies, TOPCon vs. HJT vs. Perovskite covers the efficiency and reliability tradeoffs in full detail. For the latest details on France, see Agricultural Solar Case Study.
The degradation rate also interacts with inverter topology. Microinverter and DC optimizer systems maintain module-level MPPT throughout the project life, which means partial degradation from shading or soiling in individual panels does not pull down the whole string. On a 25-year timeline, this string loss prevention can offset a portion of the panel-level degradation impact — particularly in aging installations where cell-to-cell variation in degradation rates begins to cause mismatch losses within strings. Microinverters vs. string inverters vs. power optimizers covers this mismatch dynamic in detail.
Conclusion
Solar panel degradation is not a defect — it is a predictable physical process that every honest financial model already accounts for. The key decisions for installers and system designers are:
- Specify N-type (TOPCon or HJT) for long-duration projects where the additional yield from lower degradation and no LID is financially material. At 0.30–0.35%/year versus 0.50–0.55%/year for PERC, the 25-year output difference is significant enough to justify a specification upgrade on most projects above 50 kW.
- Apply climate-adjusted system degradation rates in yield models, not just the module-level warranted rate. A 0.40%/year panel in Dubai does not deliver 0.40%/year system-level performance.
- Read the warranty structure, not just the headline number. Linear warranties are materially more valuable than step warranties for project finance and asset resale. Verify the manufacturer’s ongoing financial viability before relying on a 25-year warranty.
Use the solar design software you already have to run both P50 and P90 scenarios with technology-specific degradation rates. The difference between an optimistic and a defensible yield estimate often comes down to whether degradation was modeled carefully or assumed away.
Frequently Asked Questions
What is the average solar panel degradation rate per year?
The median solar panel degradation rate is 0.5% per year, based on NREL analysis of thousands of installed systems. Premium N-type panels (TOPCon, HJT) degrade at 0.25–0.40%/year. Older polycrystalline panels degrade at 0.7–0.8%/year. System-level degradation, which includes inverter performance, runs slightly higher at around 0.75%/year. Also see: Us Residential Solar Market Trends 2026.
How much output will solar panels produce after 25 years?
Output after 25 years depends on the annual degradation rate. A panel degrading at 0.5%/year retains approximately 88% of original rated output. Premium HJT panels at 0.25%/year retain about 94%. Older polycrystalline panels at 0.8%/year retain around 82%. Most manufacturers guarantee 80–92% output at the 25-year mark via their linear performance warranty.
Do newer panel technologies degrade slower than older ones?
Yes, significantly. N-type panel architectures — TOPCon and HJT — degrade measurably slower than P-type PERC and polycrystalline panels. HJT panels achieve 0.25–0.27%/year degradation, TOPCon at 0.3–0.4%/year, versus 0.4–0.55%/year for Mono PERC. The main reason is that N-type silicon is immune to Light-Induced Degradation (LID), which accounts for the first-year performance drop in P-type panels.
What causes solar panels to degrade?
The main causes of solar panel degradation are: Light-Induced Degradation (LID) — a first-year drop of 1–3% in P-type silicon panels due to boron-oxygen complex formation; Potential-Induced Degradation (PID) — ion migration driven by voltage stress and humidity; thermal cycling — daily heat-cool cycles causing microcracks in cells and solder joints; UV exposure degrading encapsulant and backsheet materials; and moisture ingress leading to delamination and corrosion.
Does climate affect how fast solar panels degrade?
Yes. NREL data shows system-level degradation averages 0.5%/year in temperate climates and 0.88%/year in hot arid climates. High temperatures accelerate thermal cycling stress and UV degradation. Coastal environments add salt spray corrosion. Cold climates with snow loading create mechanical stress. Desert installations often see the fastest long-term degradation despite lower humidity.
How does solar panel degradation affect long-term ROI?
The financial impact of degradation is smaller than the efficiency percentage suggests. At 0.5%/year degradation, a system producing 10,000 kWh in year 1 produces about 8,820 kWh in year 25 — a 1,180 kWh/year reduction. Over 25 years, degradation reduces cumulative energy production by approximately 6–8% compared to a non-degrading system. Electricity price escalation (typically 3–4%/year) largely offsets this loss in dollar terms, keeping nominal annual savings growing even as production slowly declines. Solar proposal software generates professional quotes in minutes.