Quick Answer
Polysilicon inventory exceeded 570,000 metric tons in early 2026 per InfoLink Consulting, equivalent to 300 GW of latent module supply. A 50 MW developer locking prices in Q1 2026 is making a bet on whether industry self-regulation holds. Here is the May 2026 view across the major buying regions.
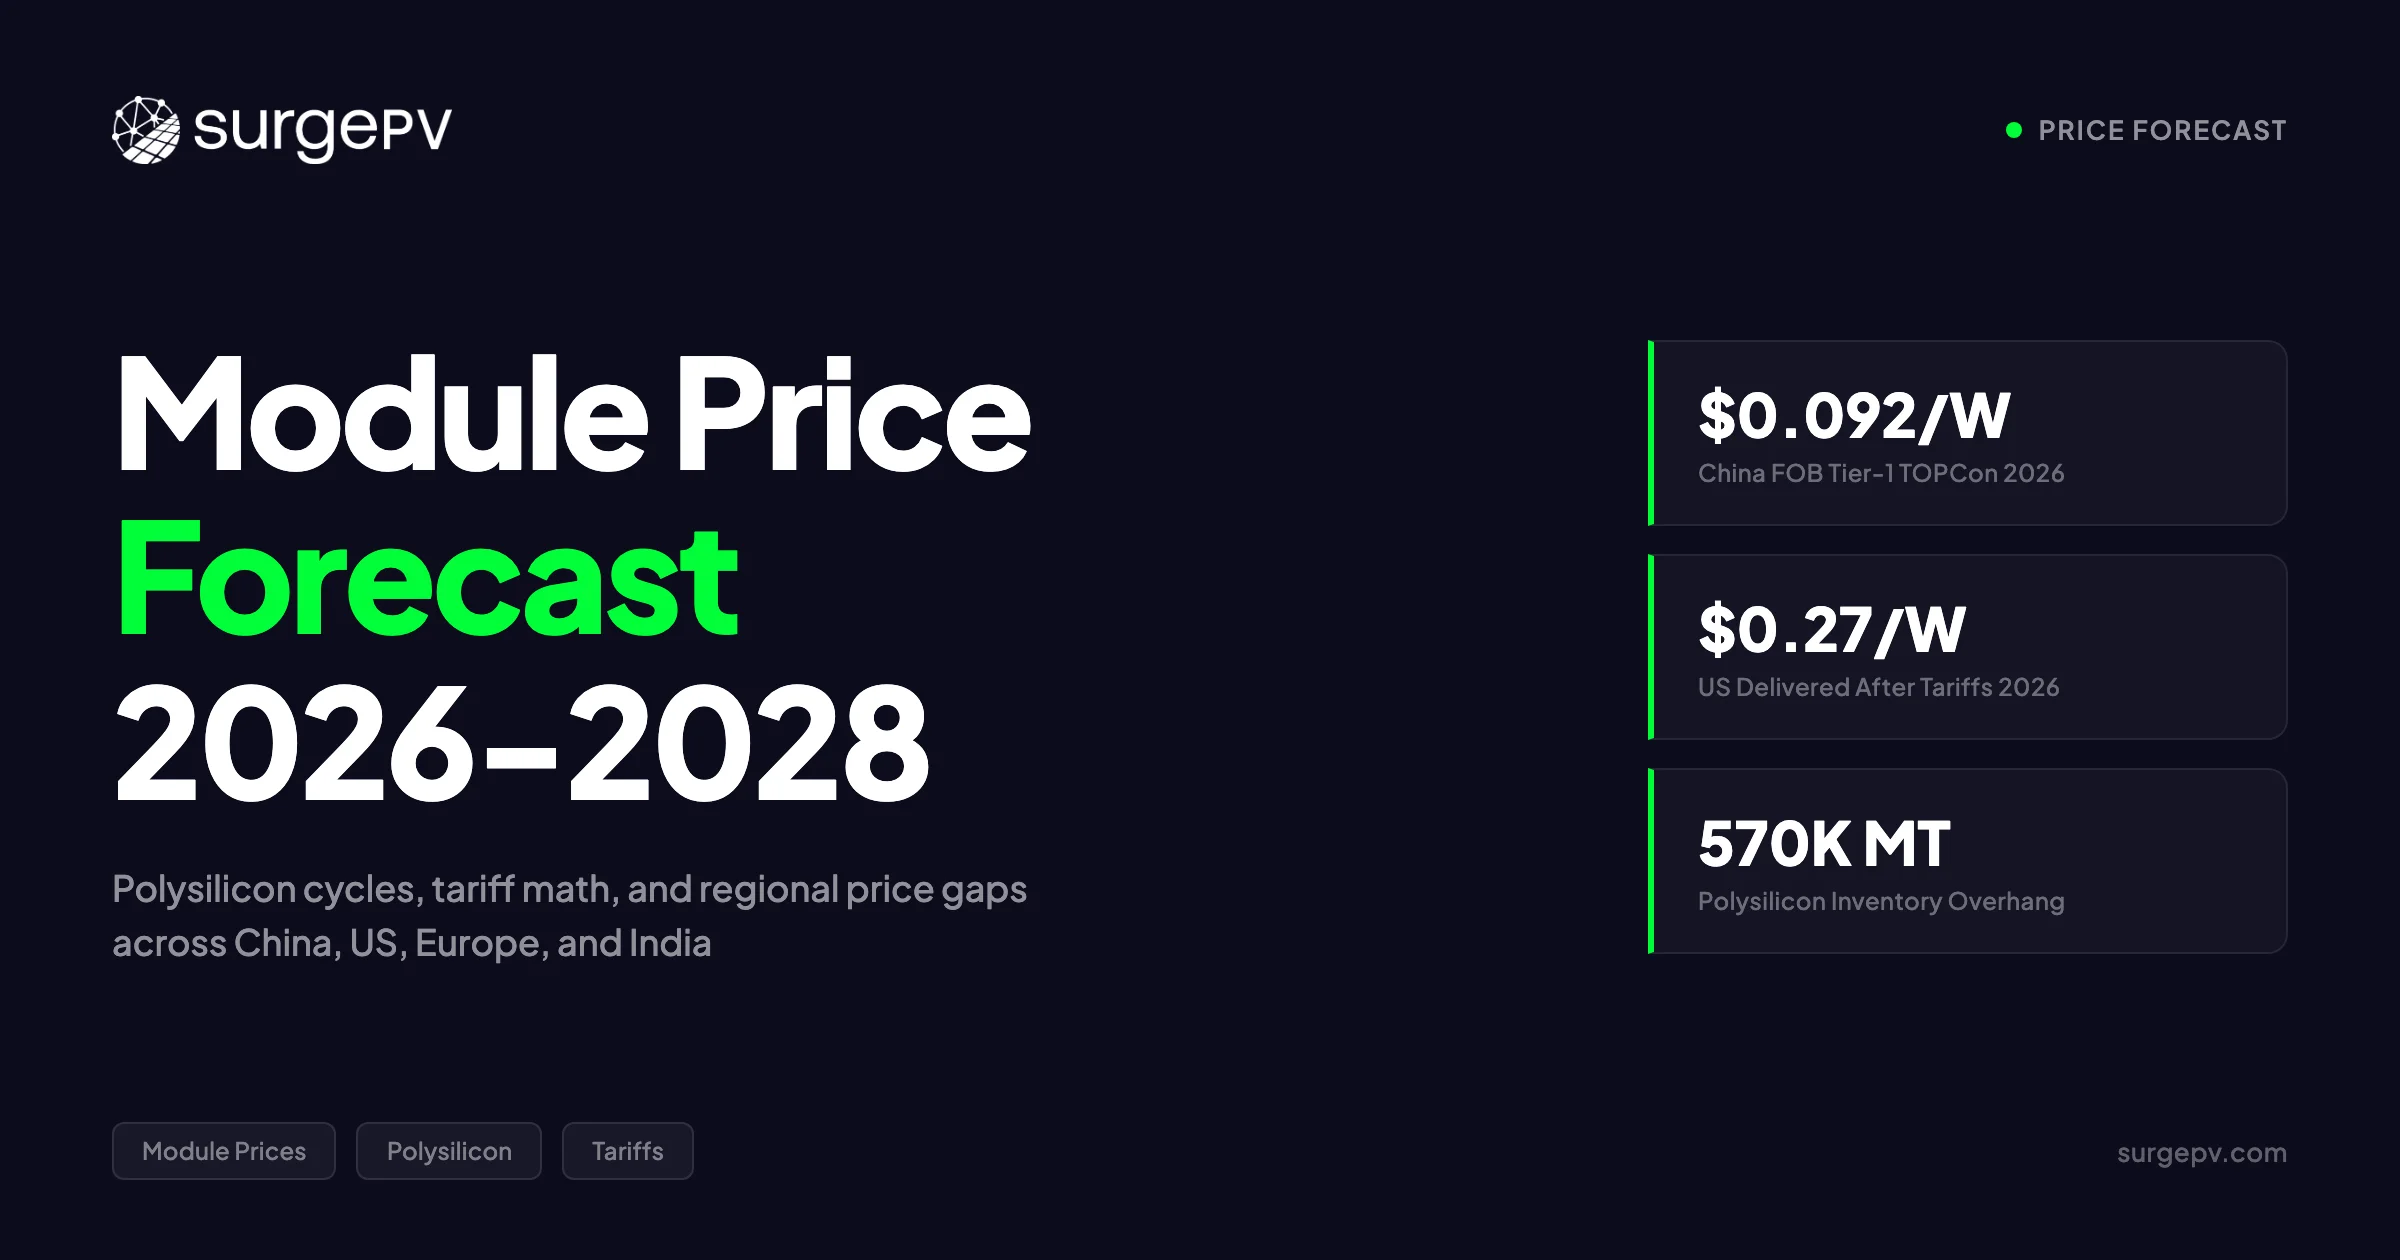
Tier-1 mono TOPCon modules from China traded at $0.085 to $0.095 per watt FOB in Q1 2026, down 38% from the post-COVID peak of $0.30/W in 2022 according to BloombergNEF. Polysilicon inventory exceeded 570,000 metric tons in early 2026 per InfoLink Consulting, equivalent to 300 GW of latent module supply. The market has reset, but the next two years will not be uniform.
Polysilicon inventory exceeded 570,000 metric tons in early 2026 per InfoLink Consulting, equivalent to 300 GW of latent module supply. A 50 MW developer locking prices in Q1 2026 is making a bet on whether industry self-regulation holds. Here is the May 2026 view across the major buying regions.
This is the most contested period in solar module pricing since the 2012 wafer collapse. China’s April 2026 VAT rebate removal, US AD/CVD duties stacked on Section 201, Indian BCD policy, and European module reshoring discussions are pulling the supply chain in opposite directions. A buyer in California pays roughly 3x what a buyer in Chennai pays for the same physical module. A 50 MW developer locking prices in Q1 2026 is making a bet on whether industry self-regulation holds. Also see: Best Solar Design Software India. Also see: European Solar Incentives.
This guide covers the full picture for 2026 through 2028: regional FOB and delivered prices, polysilicon-to-module cost cascade, TOPCon vs HJT vs mono PERC trajectories, the misconception about “fully reshored” supply chains, tariff math by destination, and a procurement playbook for installers and developers.
TL;DR — Solar Module Price Forecast 2026-2028
China FOB Tier-1 TOPCon: $0.085-$0.095/W in 2026, drifting to $0.080-$0.090/W in 2027-2028. Polysilicon: RMB 30-55/kg through 2026, below historical cash cost for mid-tier producers. US delivered: $0.27-$0.32/W after stacked tariffs. India delivered (with BCD): $0.13-$0.16/W. Europe delivered: $0.10-$0.13/W. TOPCon premium over mono PERC: 3-5%; HJT premium over TOPCon: 2-8%. Single biggest swing factor: whether China’s Ministry of Industry forces production cuts in H2 2026.
See our guide on 5kW Solar Panel Price in India for more.
In this guide:
- Where module prices stand in 2026 — region by region snapshot
- Polysilicon cycle and why it drives 60% of module cost variance
- TOPCon, HJT, and mono PERC price curves through 2028
- US tariff math — why a US buyer pays 2x to 3x the China price
- What most module price forecasts get wrong
- 2026-2028 price trajectory by technology
- Regional price gaps — Europe, US, India side by side
- Buying strategy — when to lock and when to wait
- Implications for installers and developers
Where Module Prices Stand 2026 — Regional Snapshot
Module prices in 2026 are not one number. They are a function of origin, destination, technology, and timing. Here is the May 2026 view across the major buying regions.
Q1 2026 Indicative Module Prices by Region
| Region / Channel | Tier-1 Mono TOPCon | HJT | Mono PERC (where available) | Source |
|---|---|---|---|---|
| China FOB Shanghai | $0.085 – $0.095/W | $0.090 – $0.103/W | $0.080 – $0.088/W | InfoLink, PVInsights |
| Southeast Asia FOB (Chinese poly) | $0.098 – $0.110/W | $0.105 – $0.118/W | $0.092 – $0.105/W | BloombergNEF |
| India delivered (post-BCD) | $0.13 – $0.16/W | $0.15 – $0.18/W | $0.12 – $0.15/W | Mercom India |
| Europe DDP Rotterdam | $0.10 – $0.13/W | $0.11 – $0.14/W | $0.09 – $0.12/W | pv magazine |
| US delivered (AD/CVD applied) | $0.27 – $0.32/W | $0.30 – $0.36/W | n/a (limited supply) | CEA, Wood Mackenzie |
| US domestic manufactured | $0.34 – $0.47/W | $0.42 – $0.55/W | n/a | BloombergNEF |
Prices reflect 580-720W bifacial TOPCon and HJT, M10/G12 wafer formats, Tier-1 bankability. Source: BloombergNEF Global PV Market Outlook 2026, InfoLink Consulting weekly spot price reports, PVInsights, Mercom India Solar Market Update, pv magazine European pricing tracker. Last updated May 2026. Read Bifacial Solar Panel Design Guide for a complete walkthrough. For Global-specific compliance details, see Global net-metering-by-country.
What the Numbers Reveal
The single most important number in the table is the China-to-US gap. A 600 W TOPCon module costs roughly $54 FOB China at $0.090/W. The same module delivered to a US installer costs $180 at $0.30/W. That $126 spread is not freight. It is tariff math, financing cost, and risk premium baked into US procurement.
The second important number is the BloombergNEF estimate that fully integrated US manufacturing — including upstream polysilicon — sits at $0.47/W pre-subsidy. As Youru Tan of BloombergNEF observed in the firm’s 2026 outlook: “Rebuilding the full value chain in Southeast Asia with non-Chinese polysilicon would push costs to around $0.20/W; in the US, $0.47/W.” That is a 5x premium versus China FOB for the same physical product.
Module Power Class Has Replaced “Watts” as the Spec
A 2024 buyer specified “M10 monofacial 540W.” A 2026 buyer specifies “G12R bifacial 720W TOPCon, ≥22.3% efficiency, BNEF Tier-1, T1+ insurance bankable.” Module power class has moved up roughly 12-15% in two years. Pricing tables that quote $/W without specifying power class understate the true installed cost reduction, since balance-of-system per kW scales with module count, not module wattage.
Key Takeaway — Module Price Is Now Three Variables
Quoting “module price” without origin, destination, and bankability tier is meaningless in 2026. China FOB Tier-3 modules clear at $0.065/W and end up in projects nobody will finance. China FOB Tier-1 bankable modules sit at $0.085-$0.095/W. US-delivered Tier-1 with AD/CVD applied sits at $0.27-$0.32/W. The same nameplate watt commands a 4x spread depending on these three variables.
Polysilicon Cycle — Why It Drives 60% of Module Cost
Polysilicon is the upstream raw material that pulls module prices around more than any other input. Understanding the 2026 polysilicon cycle is how you forecast 2027 and 2028 module prices.
Polysilicon Price History 2020-2026
| Period | Polysilicon (RMB/kg) | Polysilicon (USD/kg) | Module Price (China FOB) |
|---|---|---|---|
| Q4 2020 | 80 – 90 | 12 – 13 | $0.18 – $0.20/W |
| Q4 2021 | 240 – 270 | 36 – 41 | $0.26 – $0.28/W |
| Q3 2022 (peak) | 290 – 310 | 43 – 46 | $0.27 – $0.30/W |
| Q2 2023 | 60 – 80 | 8.5 – 11.5 | $0.18 – $0.22/W |
| Q4 2024 | 35 – 45 | 5 – 6.5 | $0.10 – $0.12/W |
| Q1 2026 | 48 – 55 | 6.8 – 7.8 | $0.085 – $0.095/W |
| Q2 2026 (April) | 30 – 34 | 4.2 – 4.8 | $0.083 – $0.090/W |
Source: PVInsights weekly spot prices, InfoLink Consulting monthly market reports, Bernreuter Research polysilicon price chart. Non-China polysilicon held at USD 18/kg through Q1 2026 per InfoLink, indicating the supply chain bifurcation that drives the China-vs-rest module price gap.
Why Polysilicon Is Trading Below Cash Cost
InfoLink’s April 2026 spot price commentary captured the structural problem: “Under cash flow pressure and weak market conditions, polysilicon producers have been forced into passive sales to generate cash inflows, with prices falling below the cash cost line for some mid-tier manufacturers.” Mid-tier Chinese polysilicon producers — Asia Silicon, Xinte Energy’s older facilities, several second-tier operations — are losing money on every kilogram shipped. They continue producing because shutting down a polysilicon reactor and restarting it costs more than running through the trough.
The top-five polysilicon producers in China (Tongwei, Daqo, GCL-Poly, TBEA, East Hope) hold cash costs in the RMB 25-35/kg range and remain profitable at current spot. Mid-tier and Tier-3 producers have cash costs at RMB 40-50/kg and are bleeding cash. This is the consolidation pressure that BloombergNEF expects to play out across 2026 and 2027.
Polysilicon Inventory Math
InfoLink quantified the overhang precisely: “As of early 2026, polysilicon inventories reached as much as 570,000 to 600,000 MT, equivalent to 300 to 316 GW, based on a polysilicon consumption rate of 1,900 MT/GW.” Global module demand in 2026 is forecast at 649 GW by BloombergNEF. That means roughly half a year of global module demand sits as polysilicon inventory waiting to clear.
Inventory of this magnitude does not clear quickly. The base case for 2026-2028 is gradual drawdown with periodic price spikes when individual producers idle capacity, followed by relapses when the market sees demand softness.
Polysilicon-to-Module Cost Cascade
A simplified bill of materials for a 600 W TOPCon module at Q1 2026 prices:
| Component | Quantity per Module | Unit Cost | Module Cost |
|---|---|---|---|
| Polysilicon | 1.14 kg (at 1,900 g/kW) | RMB 50/kg | RMB 57 ($8.04) |
| Wafer conversion | 60 cells (M10) | RMB 1.10/wafer | RMB 66 ($9.31) |
| Cell conversion | 60 cells | RMB 0.45/W cell | RMB 162 ($22.85) |
| Module BOM (glass, EVA, frame, junction box) | per module | RMB 145 | RMB 145 ($20.45) |
| Silver paste (TOPCon) | 75-90 mg/cell × 60 | RMB 0.65/cell | RMB 39 ($5.50) |
| Module assembly | per module | RMB 32 | RMB 32 ($4.51) |
| Total cost ex-works (China) | RMB 501 ($70.66) | ||
| Selling price at $0.090/W × 600W | $54.00 |
The math reveals a stark reality: at $0.090/W FOB, China module manufacturers are pricing below total ex-works cost. They are running on negative gross margin for the cell-to-module conversion step, recovering some value only through the integrated economics of their captive polysilicon and wafer operations. This is unsustainable at scale and is the reason BloombergNEF expects forced consolidation in 2026-2027.
Silver Is the Sleeper Variable
The silver paste line in the BOM is the one that surprised the industry in late 2025 and early 2026. Silver prices rose from $24/oz in early 2024 to $34/oz in Q1 2026. With TOPCon cells consuming 75-90 mg of silver per cell, the silver content alone in a 600 W module rose from roughly RMB 28 to RMB 39 per module — a hidden $1.50/module increase that partially offset polysilicon declines. HJT cells consume even more silver (~120 mg/cell), explaining part of the HJT premium.
Pro Tip — Watch Silver, Not Just Polysilicon
In 2022-2024, polysilicon was the dominant variable. In 2026-2028, silver paste consumption per watt and silver spot prices will explain more of the residual module price variance. Track silver alongside polysilicon when forecasting module costs. The shift to copper plating (announced by Maxwell Technologies and several HJT players) is the technology bet that could break this constraint by 2028.
TOPCon vs HJT vs Mono PERC Price Curves
The technology mix in 2026 is settling. Mono PERC is exiting the new-build market. TOPCon dominates volume. HJT holds a premium niche. Back-contact (BC) is the wildcard.
Technology Market Share — Module Shipments 2024-2028
| Year | Mono PERC Share | TOPCon Share | HJT Share | BC / xBC Share |
|---|---|---|---|---|
| 2024 | 28% | 64% | 5% | 3% |
| 2025 | 12% | 76% | 8% | 4% |
| 2026 (forecast) | 4% | 80% | 10% | 6% |
| 2027 (forecast) | 1% | 78% | 12% | 9% |
| 2028 (forecast) | 0% | 73% | 14% | 13% |
Source: BloombergNEF Solar Manufacturing Outlook 2026, InfoLink monthly shipment trackers, SolarPower Europe Global Market Outlook 2025-2029.
Why TOPCon Won the Volume Race
TOPCon won because the cost gap to mono PERC narrowed to under 5% while the efficiency advantage held at 1.0-1.5 percentage points. JinkoSolar and the Chinese Academy of Sciences certified a 26.66% efficiency for an industrial-scale TOPCon cell in February 2026, the highest verified efficiency for a commercial silicon technology. Trina Solar’s Vertex N series and JA Solar’s DeepBlue 4.0 Pro both ship in volume at 23.0-23.5% module efficiency.
For a 5 MW commercial project, TOPCon vs mono PERC saves roughly $0.005/W on module price and adds 4-7% to annual energy yield. The annual yield uplift compounds over 25 years and dominates project NPV. Mono PERC is uneconomic for new projects in 2026 unless cleared at distressed inventory prices.
The HJT Premium Has Compressed
The PowerChina 31 GW tender for 2026 is the clearest market signal we have. Per pv magazine reporting, TOPCon bids landed at CNY 0.735-0.748/W and HJT bids at CNY 0.737-0.780/W. That puts the HJT premium at 0% to 4.3% — a dramatic compression from the 15-25% premium HJT carried in 2023-2024.
HJT premiums compressed because:
- Silver consumption per cell fell from 180 mg (2023) to 120 mg (2026) through grid-line optimization
- Production yields improved from 92-93% to 96-97% at leading HJT lines
- Bifaciality reached 90-92% on commercial HJT, supporting agrivoltaic and floating projects where rear-side yield matters most
- Competition from BC technology forced HJT to discount
Back-Contact (BC) — The 2027-2028 Wildcard
LONGi has bet the company on back-contact technology, branding its hybrid passivated back-contact line as “HPBC” and shipping the EcoLife and Hi-MO 9 series in 2025-2026. AIKO Solar’s ABC line uses a different BC architecture. SPIC and several European premium installers have specified BC for residential applications where the all-black aesthetic commands a price premium of $0.02-0.04/W.
BC technology offers 24-25% module efficiency at the bleeding edge, slightly above TOPCon and competitive with HJT. The manufacturing cost is currently 8-12% above TOPCon, but LONGi’s roadmap targets parity by 2028.
Module Power Class Roadmap
| Year | Mainstream TOPCon | Premium TOPCon | HJT | BC |
|---|---|---|---|---|
| 2024 | 580-605 W | 615-625 W | 600-625 W | 605-625 W |
| 2025 | 605-635 W | 645-665 W | 635-680 W | 635-660 W |
| 2026 | 645-680 W | 695-725 W | 680-740 W | 680-710 W |
| 2027 (forecast) | 685-720 W | 735-765 W | 720-770 W | 720-750 W |
| 2028 (forecast) | 720-755 W | 770-800 W | 760-810 W | 760-790 W |
Source: TaiyangNews Top Solar Modules listings (monthly), manufacturer roadmaps from JinkoSolar, LONGi, Trina, JA Solar, Canadian Solar. For Canada-specific compliance details, see Canada comparisons/solar-design-software.
This power class progression is what underwrites the $/W price declines. A 720 W module in 2026 ships in the same physical envelope as a 580 W module in 2024 — same glass, same frame, same junction box. The watts-per-module increase reduces BOS cost per watt at the project level even when module $/W is flat.
For installers running solar design software on actual project layouts, the practical question is no longer “which technology” but “how do my mounting, racking, and clamp specifications adapt to 720-740 W modules at 26+ kg per module.”
Tariffs and Trade — Why US Buyers Pay 2x China
The single largest price determinant in 2026 is not technology or polysilicon. It is destination. US-delivered module prices sit at $0.27-$0.32/W while China FOB Tier-1 sits at $0.085-$0.095/W. The US buyer pays roughly 3x more for the identical product. Here is the tariff stack that creates that gap.
US Module Tariff Stack (2026)
| Tariff Mechanism | Rate | Affected Countries | Status |
|---|---|---|---|
| Section 201 (Trade Act) | 14% | All non-domestic | Expires February 6, 2026 (under review) |
| Section 301 (China specific) | 25-50% | China-origin | Active, escalating |
| Anti-Dumping (AD) | 0% – 271% | Cambodia, Malaysia, Thailand, Vietnam | Active since June 2025 |
| Countervailing Duty (CVD) | 14.64% – 3,521% | Cambodia, Malaysia, Thailand, Vietnam | Active since June 2025 |
| Reciprocal Tariff | 10% – 49% | Multiple | Active 2025, suspensions pending |
| Solar Manufacturing 25% Tariff | 25% on cells | India, Indonesia, Laos (proposed) | Investigation phase |
Source: US Department of Commerce final determinations April 2025, US International Trade Commission rulings June 2025, US Trade Representative reciprocal tariff orders, Norton Rose Fulbright Updated Solar Import Tariffs analysis April 2025.
Why the 3,521% Number Got Headlines
The 3,521.14% countervailing duty rate applied to certain Cambodian respondents was the highest tariff in modern US trade history. As covered in PV Tech’s April 2025 reporting on the Department of Commerce ruling, the rate was set “based on facts available with adverse inferences,” meaning the affected companies failed to provide requested data and Commerce applied the highest plausible rate. In practice, those modules will not enter the US market — the tariff is functionally a ban.
The market-relevant rates are the cooperative respondent rates:
- Hanwha Qcells Malaysia: 14.64% CVD, 0% AD (lowest)
- Major Chinese-owned Southeast Asian facilities: 50-120% combined
- Tier-2 respondents: 200-400% combined
CEA Quantified the Module Price Impact
Clean Energy Associates, the procurement and quality assurance firm, projected the AD/CVD stack would add approximately $0.15/W to US delivered module prices, with US domestic-manufactured modules rising an additional $0.10/W due to cell supply bottlenecks. That projection has played out in 2026 spot prices.
The cell supply bottleneck is the bigger structural problem. US module assembly capacity reached ~50 GW by end-2025 thanks to Inflation Reduction Act incentives. US cell manufacturing capacity sat at roughly 8-12 GW over the same period. American module assemblers without captive cell supply are forced to import cells at tariff-elevated prices, eroding their cost advantage versus delivered imports.
Why Reshoring Is Slower Than Module Capacity
Module assembly is a 6-month construction project requiring $50-80M of capex per GW. Cell production requires $200-300M per GW of capex, an 18-24 month construction timeline, and skilled operators that the US labor market does not have in volume. Wafer and polysilicon production carry even higher capex and longer timelines.
First Solar, which manufactures its own cadmium telluride thin-film modules without crystalline silicon dependencies, has emerged as the structural winner of US tariff escalation. As First Solar shares jumped 14% on the AD/CVD ruling announcement, the market priced in the company’s policy advantage. First Solar 2026 ASPs are reported in the $0.30-$0.34/W range — a substantial premium to delivered import prices that the company captures as profit.
India’s Different Tariff Story
India runs a Basic Customs Duty (BCD) of 25% on cells and 40% on modules, plus state-level taxes. The BCD is layered onto Chinese imports specifically and is designed to incentivize domestic manufacturing under the Production Linked Incentive (PLI) scheme. India’s actual landed module price of $0.13-$0.16/W shows that BCD plus freight roughly doubles the China FOB price — but unlike the US tariff stack, India’s regime has produced 70+ GW of domestic module capacity in companies like Waaree, Adani Solar, Vikram Solar, and Premier Energies.
The lesson is that tariff design matters more than tariff height. India’s PLI structure pairs tariffs with capex subsidies and offtake guarantees. The US AD/CVD regime applies tariffs without coordinated capex support, producing higher delivered prices but slower domestic capacity buildout.
What Most Module Price Forecasts Get Wrong
Industry forecasts have spent 18 months predicting that module prices are at the floor. They have been wrong six quarters running. Here is why standard module price forecasting methodology is breaking down.
Misconception: “Polysilicon Below Cash Cost Means Imminent Price Recovery”
The standard analyst assumption is that when polysilicon trades below cash cost, producers idle capacity, supply tightens, and prices rebound within two quarters. That logic worked in 2018-2020. It is failing in 2025-2026.
Three reasons:
- Chinese provincial governments subsidize idled polysilicon plants. Local governments treat polysilicon employment and tax base as strategic assets. Several Tier-2 producers received provincial cash injections in Q4 2025 to keep production running below cash cost.
- Inventory overhang is structurally different. 570,000 MT of polysilicon at 1,900 MT/GW represents 300 GW of latent module supply. Even if all production stopped tomorrow, inventory alone covers six months of global demand.
- Self-regulation has weak teeth. China’s Photovoltaic Industry Association (CPIA) issued production guidance in 2024 and 2025. The guidance was widely flouted. The next round of guidance, expected H2 2026, will face the same enforcement problem.
The contrarian view: module prices may grind lower or trade sideways through 2026 and into 2027 before any sustained rebound. BloombergNEF’s Youru Tan articulated this directly: “Overcapacity will likely remain a pain point for the industry in 2026, pressing margins… existing supply can meet expected installations of about 655 GW in 2026, and even 684 GW by 2035.”
Misconception: “US Tariffs Will Move to Cell Manufacturing Reshoring”
Many forecasts assume the AD/CVD ruling triggers US cell capacity buildout in 2026-2027, narrowing the US-vs-China price gap by 2028. The data does not support this. US cell capacity announcements totaled roughly 6 GW between the AD/CVD ruling and May 2026, against module assembly capacity announcements above 40 GW in the same period. The structural barriers — capex intensity, labor, and 18-24 month construction lead time — mean US cell self-sufficiency is a 2030 question, not a 2028 question.
Misconception: “Module Price Decline = Project Cost Decline”
Modules account for roughly 30% of total system cost globally and less than 25% in China per BloombergNEF. Module price declines from $0.30/W to $0.090/W between 2022 and 2026 should have collapsed project costs. They did not. Balance-of-system costs — racking, inverters, labor, permitting, interconnection — held flat or rose, partially offsetting module declines.
The actionable insight: project economics in 2026-2028 will be driven more by BOS, financing, and interconnection than by module price. Installers who optimize procurement and design through solar design software capture more savings than those chasing the lowest module $/W.
The Tradeoff: Bankability vs Lowest Price
Tier-1 modules from JinkoSolar, LONGi, Trina, JA Solar, Canadian Solar, and the top-five Chinese majors trade at $0.085-$0.095/W FOB. Tier-3 modules from smaller Chinese manufacturers clear at $0.060-$0.075/W. The $0.025/W gap is real, but a tier-3 module without bankable insurance, without a 25-year manufacturer warranty backed by adequate balance sheet, and without certified BNEF Tier-1 status cannot be financed by major project lenders.
For a 50 MW project at 600 W modules, the $0.025/W gap equals $1.25M in apparent savings. The financing cost of pricing in additional default risk on tier-3 modules typically exceeds that saving by a factor of two to three. The math says: take Tier-1 every time on financed projects.
A Procurement Story That Captures the Trade-Off
A UK commercial developer running a 12 MW rooftop portfolio approached procurement in March 2026 with two options. Option A: Tier-3 Chinese modules at $0.072/W delivered, ~$520K total module cost. Option B: Trina Vertex N TOPCon at $0.094/W delivered, ~$680K total module cost. The $160K gap mattered to project IRR. See our guide on Battery Solar System Design UK for more. Read more about Heritage Building Solar Case Study.
The procurement team ran both options through their lender’s bankability checklist. Tier-3 modules required a 200 basis point coverage haircut on the senior debt facility — equivalent to a £180K NPV reduction. After bank financing costs, the “cheap” option was £20K worse on NPV than the Tier-1 option. The developer locked Trina, financed the project at standard terms, and reached COD in October 2026. The lesson: procurement decisions need to consider the financing cost of bankability, not just the sticker price.
Model Module Price Sensitivity Across Your Project Pipeline
SurgePV’s generation and financial tool lets you stress-test project NPV against module price scenarios from $0.07/W to $0.40/W, with BOS, financing, and degradation built in. Stop guessing what a 10% price move does to your IRR.
Book a DemoNo commitment required · 20 minutes · Live project walkthrough
2026-2028 Price Trajectory by Technology
The base case for module prices over the next three years sees continued downward pressure with technology-dependent floor levels. Here are the technology-specific forecasts.
TOPCon Price Trajectory 2024-2028
| Period | China FOB | Southeast Asia FOB | India Landed | US Delivered |
|---|---|---|---|---|
| 2024 average | $0.105/W | $0.118/W | $0.16/W | $0.24/W |
| 2025 average | $0.094/W | $0.105/W | $0.14/W | $0.26/W |
| 2026 forecast | $0.085-$0.095/W | $0.098-$0.110/W | $0.13-$0.16/W | $0.27-$0.32/W |
| 2027 forecast | $0.080-$0.092/W | $0.092-$0.105/W | $0.12-$0.15/W | $0.26-$0.31/W |
| 2028 forecast | $0.075-$0.088/W | $0.085-$0.100/W | $0.11-$0.14/W | $0.24-$0.30/W |
Source: BloombergNEF Solar Market Outlook 2026, Wood Mackenzie Global Solar PV Market Outlook Q1 2026.
The TOPCon trajectory assumes BloombergNEF’s expectation that China module-level pricing for standard crystalline silicon panels remains in a $0.085-$0.110/W range globally through 2026. Beyond 2026, the trajectory bends modestly downward as polysilicon inventory clears and the AI data center demand pull supports incremental volume.
HJT Price Trajectory 2024-2028
| Period | China FOB | Premium HJT (Maxwell, REC, Meyer Burger) |
|---|---|---|
| 2024 average | $0.118/W | $0.16-$0.20/W |
| 2025 average | $0.108/W | $0.15-$0.19/W |
| 2026 forecast | $0.090-$0.103/W | $0.14-$0.18/W |
| 2027 forecast | $0.082-$0.098/W | $0.13-$0.17/W |
| 2028 forecast | $0.075-$0.092/W | $0.12-$0.16/W |
HJT compresses its premium versus TOPCon from roughly 6-10% in 2026 to 3-5% by 2028 as silver consumption falls and yields improve. The premium HJT segment (European-manufactured by REC and Meyer Burger, Maxwell-supplied Chinese HJT) retains a much wider premium driven by brand, warranty terms, and rooftop aesthetic positioning.
Mono PERC Sunset
| Period | China FOB Mono PERC | Notes |
|---|---|---|
| 2024 | $0.092/W | Phasing out at Tier-1 |
| 2025 | $0.084/W | Distress clearing |
| 2026 | $0.075-$0.085/W | Final inventory clearance |
| 2027 | Not in production at Tier-1 | Tier-3 inventory only |
| 2028 | Effectively unavailable | n-type dominates |
Mono PERC production at Tier-1 manufacturers ceased in stages through 2025. The remaining PERC inventory is being cleared at distressed prices in markets where bankability is less strict (small commercial, off-grid, certain emerging markets). For any project requiring 25-year performance warranty backed by Tier-1 manufacturer, PERC is functionally unavailable in 2026.
Back-Contact (BC) Premium Trajectory
| Period | LONGi HPBC / EcoLife | AIKO ABC Premium | BC Premium Over TOPCon |
|---|---|---|---|
| 2025 | $0.115/W | $0.118/W | +18-22% |
| 2026 | $0.105/W | $0.108/W | +12-15% |
| 2027 forecast | $0.095/W | $0.098/W | +8-12% |
| 2028 forecast | $0.087/W | $0.090/W | +3-7% |
LONGi’s roadmap targets BC parity with TOPCon by 2028. If achieved, BC could capture meaningful share in residential and rooftop commercial segments where aesthetic and efficiency premiums matter.
Regional Price Gaps — Europe vs US vs India
The global module market in 2026 is not one market. It is at least four distinct markets with different price levels, supply chains, and policy regimes.
Europe — The Pragmatic Buyer
European DDP Rotterdam prices sit at $0.10-$0.13/W for Tier-1 TOPCon, the closest of any major buying region to China FOB. Europe’s residential and commercial installer base buys primarily through distributors, with Krannich, Memodo, BayWa, and IBC Solar dominating channel distribution.
Europe’s policy stance has been characterized by talk of module reshoring without binding tariff escalation. The EU Net Zero Industry Act sets 40% domestic manufacturing targets for solar by 2030 but does not impose import restrictions. Meyer Burger’s continued struggle (the only major European module manufacturer, repeatedly close to insolvency) demonstrates that voluntary buy-European programs have not generated the volume Meyer Burger needs to scale.
For European installers, module pricing in 2026 is straightforwardly competitive: shop the major Chinese Tier-1 brands, ship via standard freight, accept that domestic alternatives carry a 30-50% premium and are available in limited volume. The pragmatic strategy has produced Europe’s record solar deployment, including the major German residential and rooftop commercial growth covered in our community solar projects Germany analysis. Also see: Germany solar subsidies.
United States — The Tariff-Walled Market
US-delivered modules at $0.27-$0.32/W are roughly 3x the China FOB price. The US market in 2026 has bifurcated into three segments:
- Utility-scale: Sources from US-assembled modules with imported cells, accepting tariff costs and timing risk. Project IRRs have compressed by 200-400 basis points versus 2022-2023 baselines.
- Commercial rooftop: Increasingly sources First Solar thin-film where domestic content thresholds matter for IRA bonus credits. Crystalline silicon imports continue but with reduced margin.
- Residential: National installers like Sunrun and Sunnova maintain mixed sourcing. Smaller regional installers increasingly buy Q CELLS (Hanwha Qcells Malaysia at lowest AD/CVD rate) or direct US-assembled modules.
The US market is the global outlier on price. It is also the most volatile, with tariff policy changes potentially shifting prices 20%+ within a quarter.
India — The PLI-Driven Domestic Market
India’s basic customs duty regime plus PLI capex incentives has built a domestic module industry that ships at $0.13-$0.16/W landed delivered. Indian module makers — Waaree, Adani Solar, Vikram Solar, Premier Energies, Goldi Solar — supply over 80% of domestic demand. Imports continue for premium specialty applications and where domestic capacity falls short.
India’s market has the most aggressive 2030 deployment target relative to current installation rates. The PM-Surya Ghar Muft Bijli Yojana residential program targets 10 million rooftop installations. The PLI scheme targets 65 GW of domestic module capacity by 2027. Module prices in India will be driven more by domestic capacity utilization than by global pricing.
China — The Producer Market
Chinese domestic module prices in early 2026 sat at RMB 0.71-0.76/W ($0.099-$0.106/W) per InfoLink reporting, slightly above FOB export prices because export pricing is set at the marginal cost of clearing capacity. Chinese domestic project developers — power generation groups like SPIC, CHN Energy, CGN, and China Three Gorges — buy through tenders that capture roughly 200-400 basis points of margin for module makers versus desperate export pricing.
The PowerChina 31 GW 2026 tender at CNY 0.735-0.748/W ($0.103-$0.105/W) is the most-watched indicator of Chinese domestic module pricing. The tender being filled at those prices, rather than the lower spot levels, suggests that Chinese manufacturers maintain pricing discipline in domestic tenders even while accepting losses on export.
Comparative Snapshot
| Region | Tier-1 TOPCon Price | Annual Demand 2026 | Tariff Structure |
|---|---|---|---|
| China (domestic) | $0.099-$0.106/W | 220-240 GW | None |
| Europe DDP | $0.10-$0.13/W | 65-72 GW | None (talked, not enacted) |
| India landed | $0.13-$0.16/W | 28-35 GW | 40% BCD + PLI |
| US delivered | $0.27-$0.32/W | 32-38 GW | AD/CVD stacked, 14-3,521% |
Source: BloombergNEF, SolarPower Europe 2025 Global Market Outlook, Mercom India, Wood Mackenzie. Demand figures are 2026 forecasts.
Buying Strategy — When to Lock vs When to Wait
The right module procurement strategy in 2026 depends on three variables: project COD timing, exposure to tariff jurisdiction, and counterparty bankability requirements. Here is a decision framework.
Decision Framework by Project Profile
| Project Profile | COD Timing | Tariff Exposure | Recommended Action |
|---|---|---|---|
| US utility-scale | Q4 2026 | Full AD/CVD stack | Lock now via PPA-linked supply agreement |
| US commercial rooftop | 2027 | Full stack | Source First Solar or wait for domestic capacity expansion |
| European commercial | 2026-2027 | None | Spot purchase 60 days before installation |
| European residential | 2026 | None | Standard distributor terms |
| India commercial | 2026-2027 | BCD + PLI | Domestic manufacturer with PLI subsidy pass-through |
| LATAM utility | 2026-2027 | Limited | Lock at COD - 6 months |
| Middle East / GCC | 2026-2027 | None | Direct from Chinese Tier-1, dollar-denominated |
When to Lock
- Tariff escalation risk above 5% in your jurisdiction (US specifically)
- Currency depreciation risk above 5% against USD
- Project financing requires guaranteed supply contract for closing
- Module power class upgrade window where waiting yields better $/kW (this is COD-specific)
When to Wait
- Stable tariff regime (Europe, Middle East, most LATAM)
- Project COD more than 12 months out
- Bankability requirements satisfied by spot Tier-1 procurement
- Project economics dominated by BOS or financing, not module $/W
The Currency Layer
Module prices are quoted in USD but produced primarily in China (RMB) with European and US-delivered prices subject to local currency. A European installer locking in March 2026 at $0.105/W faces 12% currency exposure on a EUR-funded project. The hedge cost on a 12-month forward is typically 1-2% — usually worth paying for projects over 5 MW.
What Procurement Teams Should Track Weekly
- PVInsights spot prices — Tuesday updates, leading indicator
- InfoLink Consulting — Wednesday and Friday updates, more granular
- Polysilicon spot (Bernreuter Research, PVInsights) — drives module price by 4-8 weeks
- CPIA production guidance — quarterly, signals coordinated cuts
- US Trade Representative announcements — tariff escalation triggers
- Major Chinese tender results (PowerChina, SPIC, CGN, CHN Energy) — sets domestic floor
A 50 MW Solar Developer’s Procurement Calendar
A solar developer with a 50 MW Texas utility project targeting Q3 2027 COD ran the following procurement timeline in 2026:
- January 2026: Term sheet with three Tier-1 module suppliers, locked technology (TOPCon 670 W bifacial)
- February 2026: Quote refresh, comparative bankability review
- March 2026: Supply agreement signed with JA Solar at $0.295/W DDP Houston, with monthly price adjustment for polysilicon variance ±10%
- April 2026: 10% deposit, locked manufacturing slot for Q1 2027 shipping
- January 2027 (planned): Final pricing locked 60 days before first shipment
The developer accepted slightly higher headline price ($0.295/W vs spot $0.27/W) in exchange for guaranteed supply, bankable warranty, and tariff pass-through protections written into the supply contract. The premium was 9% on module cost — equivalent to roughly 1.5% of total project cost. Lender accepted, project reached financial close in Q2 2026.
Pro Tip — Contract for Tariff Pass-Through
In US procurement, the single most important contract clause for 2026-2027 is tariff pass-through symmetry. A well-drafted supply agreement specifies that tariff changes — up or down — are passed to the buyer or split 50/50, depending on the cause (legislative vs administrative). Without this clause, a Section 201 expiration could leave the supplier capturing the windfall while a new AD/CVD finding could force the buyer to swallow the increase.
Implications for Installers and Developers
What does this all mean for the people actually building projects? The implications differ by segment.
For Residential Installers
Module price is a smaller share of residential project cost than commercial or utility — typically 12-18% of total installed cost. Sales conversations, financing, and operations management drive customer acquisition cost (CAC) far more than module $/W. Installers obsessed with squeezing module price from $0.30/W to $0.27/W are optimizing the wrong variable.
The bigger residential opportunity in 2026-2028: higher module wattage (720+ W versus 580 W) reduces module count for a given system size, cutting installation labor by 8-15%. The premium for the higher-wattage modules is typically $0.005-$0.010/W — easily recovered through labor savings on a typical 7-10 kW residential system.
For Commercial Rooftop Installers
Commercial systems benefit most from procurement discipline because module costs scale linearly and procurement quantities cross meaningful thresholds. A 1 MW commercial system in Europe at $0.105/W has $105K of module cost; at $0.090/W with Tier-1 bulk procurement, $90K. The $15K savings (14%) drops directly to project margin if the developer is paid by the project. See Design Commercial Solar System 1MW for detailed guidance.
Commercial installers should be running module sensitivity scenarios in solar proposal software before final quote, with optionality on Tier-1 vs Tier-1+ premium technology depending on roof aesthetic requirements.
For Utility-Scale Developers
Utility module costs are 30-40% of total CAPEX. A 100 MW project at $0.090/W modules has $9M of module cost; at $0.075/W (achievable through bulk forward contracting with Tier-1 suppliers), $7.5M. The $1.5M savings funds either project margin or PPA price reduction that wins competitive tenders.
The 2026-2028 utility procurement playbook: lock long-term supply with one of the Big Five (LONGi, JinkoSolar, Trina, JA Solar, Canadian Solar), structure tariff-adjustment clauses for US projects, hedge currency on Europe and Middle East, and use spot purchases only for residual volume.
For Solar Software Buyers
Tools like SurgePV’s solar shadow analysis software and generation and financial modeling tools matter more, not less, as module prices fall. When module price was $0.30/W, a 5% energy yield improvement from better string design moved project NPV modestly. When module price is $0.090/W, that same 5% yield improvement is a higher percentage of total economics. Cheap modules raise the relative ROI of design optimization. For a direct comparison, see Arka 360 vs SurgePV.
A Note for Manufacturers
This guide does not give advice to manufacturers, but the implied roadmap is straightforward. Companies with vertical integration, strong balance sheets, technology leadership in TOPCon or BC, and disciplined production management will gain share through the 2026-2027 trough. Companies leveraged on a single product line, dependent on third-party polysilicon, or pricing below cash cost face existential pressure. Expect consolidation announcements from Tier-2 and Tier-3 Chinese manufacturers throughout 2026 and into 2027.
The market is heading toward a structure of 8-10 vertically integrated global majors plus 2-4 specialty niche manufacturers (First Solar in thin film, Meyer Burger if it survives, REC and Maxwell in premium HJT, possibly an Indian and Korean major). The Tier-3 and Tier-4 fragments of the 2022-2024 market will largely be gone by 2028.
Further Reading
For the country-by-country LCOE picture that incorporates these module prices into project economics, see our solar LCOE by country analysis. For installation cost breakdown including module share, see solar installation cost per kWp in Europe.
Conclusion
The solar module market in 2026-2028 is the most contested supply chain in clean energy. China FOB prices below $0.090/W reflect structural overcapacity that will not clear quickly. US delivered prices above $0.27/W reflect tariff stacking that adds policy risk to procurement. Polysilicon at RMB 30-50/kg sits below cash cost for mid-tier producers but persists because Chinese local governments subsidize idle capacity.
For installers and developers, the practical implications are clear. Module $/W is no longer the dominant project economics variable in most segments — BOS, financing, and design quality matter more than they did when modules cost $0.30/W. Bankability tier matters more than absolute price for any project entering financing. Tariff-adjustment clauses in US supply contracts are more valuable than negotiated price reductions.
Three actions for 2026:
- Run module price sensitivity on every project NPV with three scenarios: 2026 base case, 10% downside, 10% upside. The right module is the one that survives all three scenarios.
- For US procurement, structure tariff pass-through clauses (symmetric, both directions) into every supply agreement. The policy environment will move; the contract should absorb the move.
- For projects with COD beyond Q3 2027, defer final price lock until Q1 2027 to capture additional polysilicon and module declines, while securing manufacturing slot reservations early to avoid supply timing risk.
For solar developers and installers building professional procurement workflows, integrating module price scenarios directly into solar software financial models replaces the spreadsheet-driven approach that breaks every time prices move 5%. The next two years will see 5% moves quarterly.
Frequently Asked Questions
What is the solar module price forecast for 2026?
Tier-1 mono TOPCon modules from China are forecast to trade at $0.085 to $0.095 per watt FOB through 2026 according to BloombergNEF, with potential dips below $0.08/W if polysilicon inventory continues to overhang the market. Modules produced in Southeast Asia using Chinese polysilicon will price near $0.10/W, while US-delivered modules will sit at $0.27 to $0.32/W after stacked AD/CVD and Section 201 duties. The April 2026 VAT rebate change in China is the single largest swing factor.
Why are polysilicon prices so important for module forecasting?
Polysilicon is the largest single cost component in a crystalline silicon module, historically contributing 25-35% of total module cost when prices were elevated, and roughly 12-18% in the 2026 oversupplied market. With polysilicon inventories at 570,000-600,000 metric tons in early 2026 according to InfoLink, prices fell below RMB 50/kg by January and approached RMB 30/kg by April. Every $1/kg move in polysilicon translates to roughly $0.002/W on module cost, which scales fast at gigawatt volumes.
Are TOPCon modules cheaper than HJT modules in 2026?
Yes. TOPCon modules from the PowerChina 31 GW 2026 tender bid in at CNY 0.735 to CNY 0.748/W, while HJT bid at CNY 0.737 to CNY 0.780/W, a premium of roughly 2-5%. The HJT premium has compressed sharply from the 15-25% gap seen in 2023 as silver consumption per cell has fallen and production yields have improved. For most utility-scale and commercial buyers, TOPCon remains the price-performance leader through 2028.
How much do US tariffs add to imported solar module prices?
US tariffs stack across four mechanisms. Anti-dumping and countervailing duties on Cambodia, Malaysia, Thailand, and Vietnam range from 14.64% (Hanwha Qcells Malaysia) to over 3,500% on adverse-inference Cambodian respondents. Section 201 tariffs at 14% expire February 2026. Reciprocal tariffs added 10-49% by country in 2025. The composite effect has lifted US-delivered module prices roughly 2-3x the China FOB price, with CEA estimating an additional $0.15/W from AD/CVD alone.
Will solar module prices fall further in 2027 and 2028?
BloombergNEF projects continued downward pressure through 2028, with China FOB module prices potentially reaching $0.07 to $0.08/W as polysilicon, wafer, and cell oversupply works through the system. However, the floor is set by industry self-regulation, with most Tier-1 manufacturers refusing to take orders below cash cost. The likeliest trajectory is volatile sideways pricing in 2026-2027 followed by a modest rebound in 2028 as supply discipline takes hold and AI data center demand absorbs excess capacity.
Should solar developers lock module prices now or wait?
It depends on currency exposure and project COD. For projects commissioning in late 2026, locking now hedges against a potential supply discipline rebound but caps upside from further declines. For 2027-2028 COD, waiting until Q3 2026 captures more visibility on Chinese consolidation and post-VAT-rebate market structure. US developers should lock as soon as a domestic content threshold is met, since tariff escalation risk dwarfs price decline upside in the US market specifically.
Which solar module manufacturers are most stable through 2028?
JinkoSolar, LONGi, Trina, and JA Solar (the Big Four) carry the strongest balance sheets, vertically integrated supply, and the technology depth to ride out the 2026-2027 trough. First Solar dominates US thin-film with policy tailwinds. Canadian Solar straddles Chinese cost structure and Western customer relationships. Tier-2 manufacturers with single-product focus and high debt loads carry consolidation risk that buyers should price into bankability assessments.
How does the April 2026 China VAT rebate removal affect module prices?
China’s Ministry of Finance abolished the VAT rebate on photovoltaic exports effective April 1, 2026, covering wafers above 15.24 cm, cells, and modules. The change removed a roughly 9-13% cost subsidy that Chinese exporters historically passed through to international buyers. Pre-April shipments surged as manufacturers front-loaded orders. Post-April, Chinese FOB prices firmed by RMB 0.03-0.05/W, but the move was partly absorbed by manufacturers preserving market share rather than fully passed to buyers.
Sources referenced:
- BloombergNEF Solar Market Outlook — Global module pricing tiers, regional cost differentials, 2026 demand forecasts
- InfoLink Consulting spot price tracker — Weekly polysilicon, wafer, cell, and module prices
- PVInsights weekly price index — Polysilicon and module spot pricing methodology
- Bernreuter Research polysilicon price trend — Historical polysilicon price data
- US Department of Commerce AD/CVD final determinations — April 2025 rulings, tariff rates by respondent
- PV Tech — Industry news, tender results, manufacturer announcements
- pv magazine — European module pricing tracker, manufacturer roadmaps


