Quick Answer
The installers who operate above that average share one thing: they know exactly which stage is dragging their number down. The ones who operate below it are usually optimizing the wrong stage entirely. If you sent 50 proposals last quarter and signed 10, your win rate is 20%. Appointment to Site Survey / Design. 80% Stage 3.
Most solar installers report their win rate as a single number. “We close about 20% of our leads.” That number is almost certainly wrong — or at least, incomplete. Win rate is not one ratio. It is the product of five sequential ratios that multiply together from first contact to signed contract. A weakness at any stage depresses the final number, and you cannot fix what you cannot isolate.
The installers who operate above that average share one thing: they know exactly which stage is dragging their number down. The ones who operate below it are usually optimizing the wrong stage entirely. If you sent 50 proposals last quarter and signed 10, your win rate is 20%.
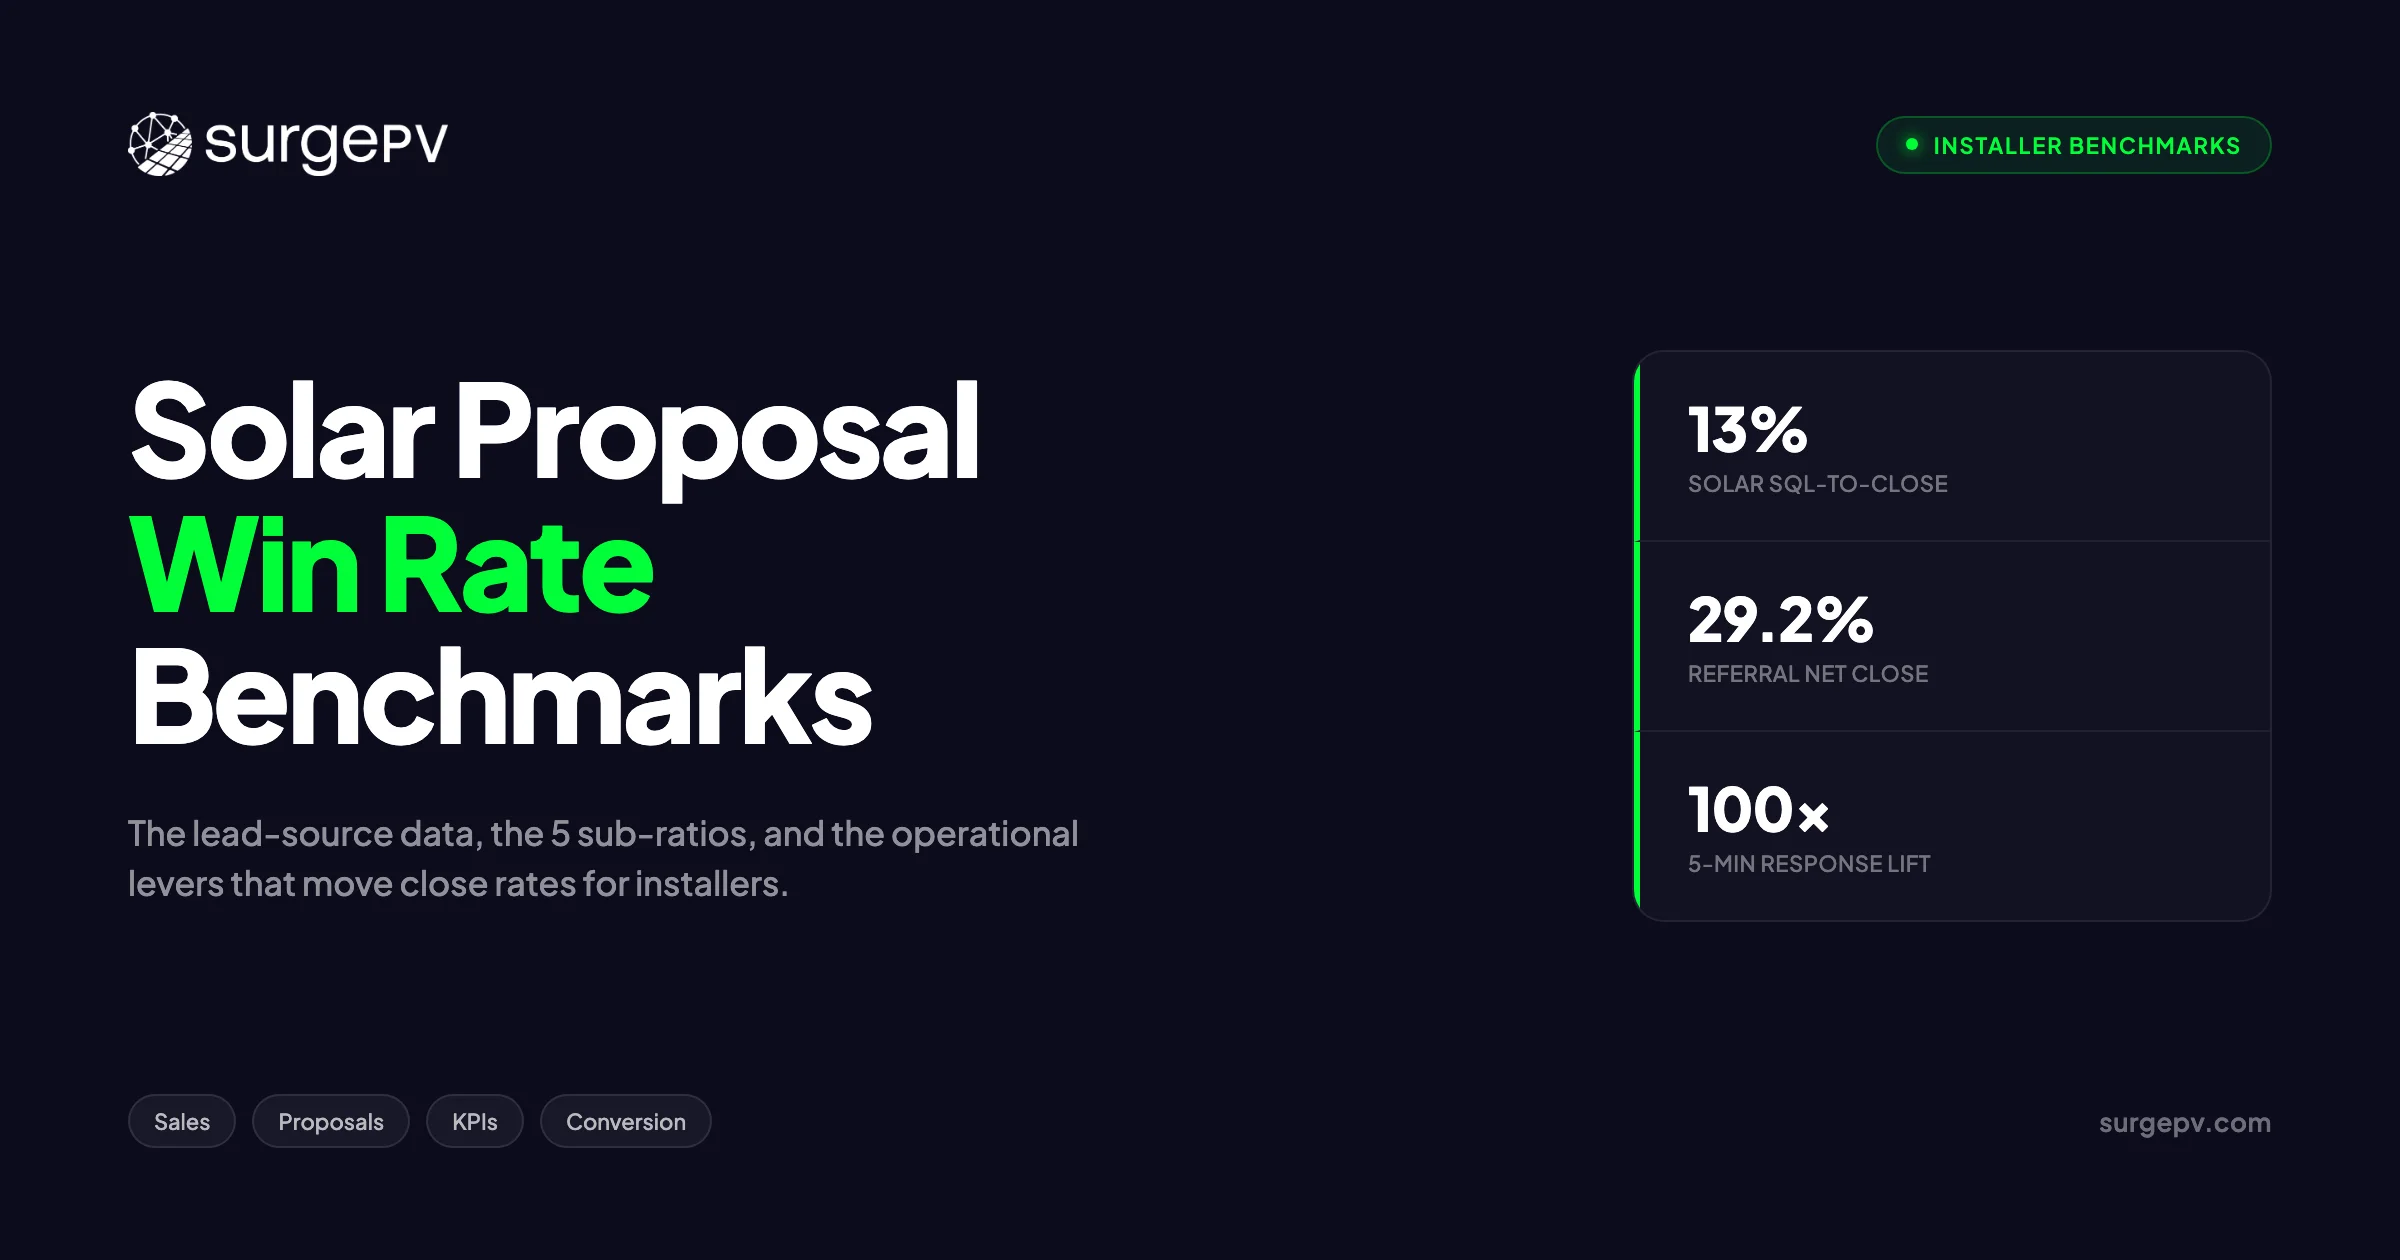
The aggregate data tells a sobering story. First Page Sage’s 2019–2025 benchmark study across millions of leads places solar’s SQL-to-closed-won rate at 13% — comparable to B2B SaaS and well below HVAC (29%) or commercial construction (16%). The installers who operate above that average share one thing: they know exactly which stage is dragging their number down. The ones who operate below it are usually optimizing the wrong stage entirely.
This guide uses verified data from First Page Sage (2019–2025), Sunvoy’s published analysis of Ipsun Solar’s 2022 production data, the Oldroyd/MIT research published in Harvard Business Review, and Aurora Solar’s 2019 industry poll. If you want a tool that connects design accuracy directly to proposal speed, solar proposal software built for installers is the place to start. The five-ratio model below is the framework that ties it all together. For software options, see 7 Best Aurora Solar Alternatives in.
TL;DR — How to Read Your Solar Win Rate
Most installers think of win rate as one number. It isn’t. It’s the product of five sequential ratios — lead to appointment, appointment to design, design to proposal, proposal to verbal yes, and verbal yes to signed contract. The industry SQL-to-closed-won average is 13% (First Page Sage, 2019–2025). Top referral-led teams hit 29–33% (Sunvoy / Ipsun Solar, 2022). The gap between average and top-quartile performance is driven by lead source mix, speed to lead, and design-to-proposal turnaround — in that order.
In this guide:
- What “win rate” actually measures and why definitions vary across teams and data sources
- Industry benchmarks by lead source, from referrals at 29.2% net to Facebook at the bottom of the range
- The five sub-ratios that multiply into your overall win rate and where each one typically breaks
- Operational levers ranked by impact — speed to lead, lead source reallocation, proposal turnaround, follow-up cadence, proposal accuracy, and financing range
- Residential vs. C&I differences in cycle length, decision-maker count, and proposal complexity
- A formula and a five-column dashboard you can implement in any CRM this week
What Counts as a “Win”? Defining Solar Proposal Win Rate
Before any benchmark means anything, you need to know what is being measured. “Win rate” in solar is used to describe at least three different things depending on who is reporting it, and mixing definitions produces comparisons that are useless at best and actively misleading at worst. For France-specific information, see Agricultural Solar Case Study. For France-specific information, see Floating Solar Farms France.
The Simple Version vs. The Real Version
The simple version: divide signed contracts by proposals sent. If you sent 50 proposals last quarter and signed 10, your win rate is 20%. Clean. Easy. Wrong — or at least, incomplete.
The real version is a five-stage multiplication model. Each stage has its own conversion rate, and those rates multiply together to produce your actual lead-to-close percentage.
| Stage | Description | Example Rate |
|---|---|---|
| Stage 1 | Lead to Appointment | 50% |
| Stage 2 | Appointment to Site Survey / Design | 80% |
| Stage 3 | Design to Proposal Sent | 90% |
| Stage 4 | Proposal to Verbal Yes | 60% |
| Stage 5 | Verbal Yes to Signed Contract | 75% |
| Combined | Lead to Closed Won | 0.50 × 0.80 × 0.90 × 0.60 × 0.75 = 16.2% |
The mathematics reveal why small improvements at one stage create outsized swings in the final number. If all five stages each run at 60%, the combined rate is 0.6 to the power of 5, which equals 7.8%. Lift Stage 4 alone — proposal to verbal yes — from 60% to 75% while holding everything else constant, and the combined rate climbs from 7.8% to 12.4%. That is a 59% improvement in closed contracts from one stage change.
This is why high-volume installers obsess over stage-level measurement. The overall win rate is an outcome. The stage ratios are the controls.
Why Definitions Vary
The same word covers different math depending on the source. First Page Sage defines win rate across Stages 4 and 5 only — SQL-to-closed-won — and reports 13% for solar. Sunvoy and Ipsun Solar report across Stages 1–2 and 4–5, producing their “under 15% lead-to-signed” aggregate. Most CRM win-rate reports cover only Stages 4–5 because Stage 1–3 data often lives in separate systems: lead management platforms, scheduling tools, and design software that don’t talk to each other.
Three mistakes installers make because of this:
-
Comparing their proposal-to-close rate against a lead-to-close benchmark. If someone tells you “top performers close 30% of leads,” they are probably describing referral-channel results. Comparing that against your all-channel proposal-to-close rate puts you in an unfair race.
-
Omitting no-shows from the denominator. If you count only appointments that happened when calculating Stage 1–2 conversion, you are hiding a real cost. No-shows cost design time and salesperson time even when no proposal gets sent.
-
Treating win rate as a single metric that marketing owns. Every stage from lead to signed is either a sales process problem or a product problem. Marketing delivers the lead. Sales owns Stages 1–5. Lumping it all into one number makes diagnosis impossible.
Pro Tip
Before benchmarking against any external data, write down the exact formula your team uses to calculate win rate today. If you cannot write it down in one sentence, you do not have a measurement — you have an estimate.
Industry Benchmarks: What’s a Normal Solar Win Rate?
Benchmarks only tell you where you stand relative to the industry. They do not tell you what is possible. That said, they are the fastest way to identify whether your process has a structural problem or a channel-mix problem.
SQL-to-Closed Won Baseline
First Page Sage’s multi-year study (2019–2025) across B2B industries is the most rigorous publicly available benchmark for SQL-to-closed-won rates. Their solar figure sits at 13%, placing the industry in the same tier as B2B SaaS (12%) and manufacturing (13%).
| Industry | SQL-to-Closed Won |
|---|---|
| HVAC | 29% |
| Construction | 16% |
| Solar | 13% |
| Manufacturing | 13% |
| B2B SaaS | 12% |
Solar operating at the SaaS tier is not flattering for a trades business. It reflects the combination of long sales cycles, complex financing decisions, high ticket sizes, and a customer base that requires significant education before committing.
What “Good” Looks Like by Channel
The 13% aggregate hides substantial variation by lead source. Sunvoy’s analysis of Ipsun Solar’s 2022 production data provides the most granular channel-level breakdown publicly available. Ipsun Solar is a DC-metro installer with $12M annual revenue and approximately 60 employees — a mid-size residential operator, not an enterprise.
| Lead Source | Book Rate | Close Rate on Appointment | Net Close Rate |
|---|---|---|---|
| Referrals | 80% | 37.5% | 29.2% |
| Solarize programs | — | — | 33% |
| Radio | 90% | 35% | 30% (approx) |
| Yelp | — | — | 23.5% |
| Phone inbound | 71% | 25% | 17% |
| Google paid | — | — | 15% |
| Facebook / aggregators | — | — | 5–10% (industry-observed; Ipsun data shows Facebook as the lowest performer but does not publish a clean rate) |
These figures apply to a specific company in a specific metro in 2022. Use them as directional benchmarks, not as targets you can guarantee by copying the channel mix.
Solar vs Other Industries
HVAC’s 29% SQL-to-close rate is roughly double solar’s 13%. The gap has three structural causes. First, HVAC sales cycles are shorter — equipment failure creates urgency that solar never has. Second, HVAC products are simpler to specify and quote; the customer does not need to understand kWh production, shade analysis, or net metering rates to say yes. Third, financing complexity in solar adds decision time and dropout risk at every stage from proposal review to loan approval.
Improving your solar win rate to HVAC levels is unrealistic for a residential solar installer. Improving it from 13% to 20% is a realistic 18-month target if you address the right stages. Good solar software helps close that gap by compressing the design-to-proposal stage where avoidable delays and accuracy errors tend to concentrate.
Key Takeaway
The 13% industry average is a baseline, not a ceiling. The installers at 29–33% are not smarter — they have a different lead source mix and faster proposal delivery. Both are controllable.
Win Rate by Lead Source: The Sunvoy Data Set
The Sunvoy / Ipsun Solar data set is one of the few publicly available channel-level analyses with specific booking and close rates attached. Read the context before applying the numbers.
Ipsun Solar’s Public Dataset
Ipsun Solar shared their 2022 conversion data publicly through Sunvoy, a solar customer management platform. The company operates in the DC metro area, carries approximately 60 employees, and runs $12M in annual revenue. They are a residential-focused installer with a mature referral program and a diversified lead mix.
The data covers lead-to-appointment booking rates and appointment-to-close rates separately for each channel. This two-stage breakdown is more useful than a single net rate because it shows where each channel breaks. A channel with a low booking rate but a high close rate on appointments has a different fix than one with a high booking rate but a low close rate.
Best Performers: Referrals, Solarize, Radio
Referrals close at 29.2% net — 80% book an appointment, and 37.5% of those appointments close. The high booking rate is the driver. Referral leads arrive with pre-established trust. They are expecting the call, they have often seen a neighbor’s system, and they have implicitly validated the category before you dial.
Solarize programs close at 33% net — the highest in the dataset. Solarize participants have self-selected into a community purchase group, which means both interest and peer accountability are already in place. The installer’s job is confirmation, not persuasion.
Radio posts 90% booking rate and approximately 30% net close rate. The high booking rate reflects the passive, inbound nature of radio response — someone who calls after hearing a radio spot has already processed the message on their own time.
Middle of the Road: Google, Yelp, Phone
Yelp at 23.5% net sits above the aggregate but well below referrals. Yelp leads are actively seeking solar but comparing multiple providers simultaneously. Close rates are sensitive to review volume, review recency, and quote competitiveness.
Phone inbound at 17% net (71% book, 25% close) reflects a lead type that expressed enough interest to call but is still in research mode. The appointment booking rate is decent; the close rate on appointments is modest.
Google paid at 15% net sits just above the aggregate. Pay-per-click leads are intent-based but highly competitive. You are competing against every other installer who bid on the same keyword, often on price alone.
The Dregs: Facebook and Aggregators
Facebook lead close rates are industry-observed at 5–10% net. The Ipsun dataset identifies Facebook as their lowest-performing channel but does not publish a clean isolated rate. The directional reality aligns with what most installers experience: Facebook leads are high-volume, low-intent, and frequently mis-targeted. The customer submitted a form in a passive scroll session, not in response to an active search.
Lead aggregators (third-party lead vendors, comparison sites) perform similarly. The lead has been sold to multiple installers, often simultaneously. You are racing to contact a prospect who did not specifically seek you out. For the latest details on France, see France Solar Feed-in Tariffs.
Three Channel-Mix Errors
-
Chasing volume without tracking channel-level close rates. A $5,000 Facebook campaign producing 100 leads at 7% close generates 7 jobs. The same $5,000 spent on a referral incentive program at 29% generates roughly 4 referrals that become 4 qualified appointments that become 1.2 jobs at minimum — and that math worsens as referral volume scales because each job generates the next referral. For more on this topic, see Solar Racking Design Guide.
-
Cutting referral program investment during slow months. Referral pipelines have a 30–90 day lag. Cutting the program now produces a pipeline hole in 2 months.
-
Attributing Google organic conversions to Google paid. The two channels have very different cost structures and close rates. If your CRM lumps them together, you are making budget decisions on bad data.
The 5 Sub-Ratios That Multiply Into Your Win Rate
The multiplication model is the only framework that makes stage-level improvement legible. A 10-point improvement at Stage 1 is worth more than a 10-point improvement at Stage 5 because it compounds through every downstream stage.
The Multiplication Model
Here is a worked example using the Ipsun Solar aggregate figures as a baseline:
| Stage | Stage Rate | Cumulative Rate |
|---|---|---|
| Lead to Appointment | 50% | 50% |
| Appointment to Design | 80% | 40% |
| Design to Proposal | 90% | 36% |
| Proposal to Verbal Yes | 60% | 21.6% |
| Verbal Yes to Signed | 83% | 17.9% |
That 17.9% compound rate is above the 13% First Page Sage average, which makes sense — Ipsun operates a mature referral program that skews their channel mix favorably. An installer running predominantly Google paid and Facebook leads would see the Stage 1 and Stage 4 rates pull the compound number below 13%.
Now run the same model with a single Stage 1 improvement — lead to appointment from 50% to 65% — holding everything else constant:
0.65 × 0.80 × 0.90 × 0.60 × 0.83 = 23.3%. A 13-point lift in one stage produces a 30% improvement in closed contracts.
Stage 1: Lead to Appointment
Speed is the primary driver of Stage 1 conversion. The Oldroyd/MIT research, published in Harvard Business Review in 2011, remains the most-cited controlled study on this point: responding within 5 minutes makes you 100 times more likely to connect with the lead and 21 times more likely to qualify them compared to a 30-minute response. The 78% first-responder rule — widely cited in solar industry training materials, attributed to Demand Local / MIT research — states that 78% of customers buy from the company that responds first.
These two data points together make a simple case: if you are not the first installer to contact a lead, you are in a recovery position before the conversation begins.
Practical Stage 1 controls:
- Automated text response within 2 minutes of form submission, with a direct phone number for the prospect to call back
- Routing rules that assign leads to the next available rep, not to the rep’s preferred territory
- No-show reduction through confirmation sequences — industry-observed data suggests confirmation sequences cut no-show rates by 30–40% from the 15–25% baseline (industry-observed; qualify for your own data before citing internally)
Pro Tip
Track time-to-first-contact separately from time-to-appointment. The first metric is a process indicator you can fix today. The second is a lagging outcome. If you only measure the outcome, you will not catch the process failure until it has already cost you three weeks of pipeline.
Stage 2: Appointment to Site Survey / Design
The primary loss at Stage 2 is no-shows. Industry-observed no-show rates in residential solar run 15–25%, with significant variation by channel (Facebook leads no-show more than referrals, directionally). Confirmation sequences — a text the day before and a call the morning of — reduce no-shows meaningfully, though the 30–40% reduction figure is industry-observed and you should measure it against your own baseline before using it in a forecast.
Secondary losses at Stage 2 come from appointment disqualification — customers who show up but are not site-qualified (wrong roof orientation, structural issues, HOA restrictions). These are best handled with a pre-qualification questionnaire before booking the site visit, not after.
Stage 3: Design to Proposal Sent
This is where most mid-size installers lose avoidable time. The handoff from site visit to design to proposal is the longest internal stage in most solar sales processes, and it is entirely within the installer’s operational control.
Aurora Solar’s 2019 industry poll (n=76 installers) documented the downstream cost of getting this stage wrong: 47% of respondents said change orders affected 10–30% of their projects, with a mean change order cost of $583. And 8% of contractors reported losing sales directly after issuing a change order. A change order is a proposal accuracy failure with a financial penalty attached.
Accurate solar design software eliminates the root cause of most change orders: shading miscalculations, wrong panel counts, and misestimated production numbers that get corrected during permitting or installation. When the design is accurate before the proposal is sent, the change order rate drops, and with it goes the 8% sale-loss risk.
The proposal turnaround time is the other Stage 3 variable. Industry-observed data in competitive residential markets suggests same-day proposals outperform 3–5-day proposals on close rate — though this is directional and the magnitude varies by market. The mechanism is simple: a customer who receives a proposal the same day they met with you has not yet had time to book appointments with three competitors.
Stage 4: Proposal to Verbal Yes
Stage 4 is where the proposal quality pays off or does not. Three factors dominate close rate at this stage.
Production accuracy and presentation. If the customer is skeptical about the production estimate, they shop. Solar shadow analysis software that generates site-specific shade reports gives the customer verifiable production data rather than a salesperson’s assurance. Generation and financial tool modeling that shows month-by-month production, payback period, and 25-year savings trajectory in a customer-readable format reduces the “I need to think about it” response.
Financing clarity. Customers who do not understand the financing structure do not sign. This is a presentation problem, not a product problem.
Proposal aesthetics and professionalism. A visually inconsistent or difficult-to-read proposal extends the decision cycle. The customer’s unconscious logic is: “If the proposal looks like this, what does the installation look like?”
Stage 5: Verbal Yes to Signed Contract
Stage 5 losses are almost entirely follow-up failures. A verbal yes that does not convert to a signed contract within 14 days has a high probability of falling out entirely — to a competitor who followed up more persistently, to buyer’s remorse, or to a financing application that stalled without anyone from your team addressing it.
Industry-observed data across published solar sales training programs suggests 6–8 follow-up touches over 14 days lifts Stage 5 conversion compared to 1–2 touches. This is not a controlled study result — qualify it as industry-observed if you cite it internally. The pattern holds across multiple coaching programs and is consistent with general B2B follow-up research.
A practical Day 1/3/5/7/10/14 cadence works as follows: Day 1 — confirm verbal yes and send DocuSign link; Day 3 — check that financing application is moving; Day 5 — offer to walk through any remaining questions by phone; Day 7 — share a project timeline so the customer can visualize installation; Day 10 — follow up on any open financing or HOA items; Day 14 — direct close ask with a deadline tied to equipment availability or incentive timing.
Where Solar Deals Break Down After the Proposal
Most installers focus on pre-proposal problems — lead quality, appointment booking, show rate. Post-proposal failures are less visible because they feel like “the customer decided not to buy” rather than “we failed to close.” That distinction matters. Many post-proposal losses are recoverable with operational changes.
Speed-to-Lead Failures
The first-responder advantage does not apply only to initial lead contact. It applies to every stage where the customer is waiting for something. A customer waiting 5 days for a proposal after a site visit has time to book three more appointments with competitors. The 78% first-responder rate is the macro version of this dynamic — the installer who delivers first wins a disproportionate share of the market.
Speed-to-lead failures are systemic. They happen because design takes too long, because proposal templates require too much manual customization, or because the rep who ran the site visit is also responsible for generating the proposal instead of a dedicated design team.
Design Accuracy Failures
Aurora Solar’s 2019 data (47% of installers, change orders on 10–30% of projects, mean $583, 8% lose the sale) documents what installers already know intuitively: a change order is a trust rupture. When a customer signed a proposal for a $28,000 system and is now being told the price is $28,583 because the original shade analysis was wrong, they do not just feel financially exposed — they feel misled.
The fix is upstream. Accurate shading data before the proposal goes out eliminates the most common root cause of change orders. The cost of better design tooling is a fraction of 8% of closed deals.
Financing Presentation Failures
Two financing-related issues consistently kill post-proposal momentum. The first is a lack of options. A customer who cannot qualify for a solar loan and is not offered TPO (lease or PPA) typically does not come back. Solo’s 2026 Trends Report documents the scale of TPO adoption in markets where financing alternatives matter: Michigan saw TPO share climb from 1.16% to 38.96% as installers adapted to customer financing constraints.
The second issue is the expiration of the 30% federal residential investment tax credit, which expired December 31, 2025. Proposals that still reference the 30% residential ITC as an available incentive will trigger customer pushback, follow-up questions, and trust damage when the customer does their own research. Every proposal template should reflect current federal incentive status, which may vary by state and installation type. Battery attach rates in markets like Hawaii (83.41% per the Solo 2026 Trends Report) show how quickly customer incentive structures shift — your proposal template needs to match the current environment.
Follow-Up Failures
Industry-observed data across solar sales coaching programs consistently shows that most installers give up after 1–2 follow-up attempts. The customer goes quiet; the rep interprets silence as a no; the deal falls out of the pipeline. Many of those silent customers had not said no — they had stalled on a financing decision or were waiting for a spouse to review the proposal.
A structured follow-up cadence (see Stage 5 above) is not aggressive sales behavior. It is serving a customer who expressed interest but got stuck.
First-Responder Advantage at the Proposal Stage
The 78% first-responder principle applies at every “delivery” moment in the sales cycle, not just at initial lead contact. The installer who delivers the proposal first, who sends the DocuSign link first, who follows up with financing status first — that installer wins a disproportionate share of deals that are genuinely competitive. The advantage compounds across stages.
Key Takeaway
Post-proposal losses look like customer decisions. Many are process failures. Isolate each stage, measure the dropout rate, and you will find at least one that is recoverable within 60 days.
Operational Levers That Move Win Rate (Ranked)
These six levers are ranked by the combination of magnitude of impact and speed of implementation. The ranking is directional, not absolute — your specific stage-level data may shift the order.
Lever 1: Speed to Lead
The Oldroyd/MIT/HBR research is definitive. A 5-minute response window produces 100x connection rates versus 30-minute response. The 78% first-responder rule means your competitors are also trying to get there first. Speed to lead is a tie-breaker in every competitive market.
Implementation: automate the first contact. A text from a real phone number (not a shortcode) within 2 minutes of form submission, followed by an immediate call attempt from the assigned rep, covers the initial window. CRM routing rules that eliminate manual assignment are the infrastructure requirement.
Lever 2: Lead Source Reallocation
The channel-level close rate data makes the budget math explicit. Assume $5,000 of monthly lead budget:
- Allocated to Facebook at a 7% industry-observed net close rate: approximately 3.5 additional jobs (assuming $1,000 cost per Facebook lead acquired, which is directional)
- Allocated to a referral incentive program at 29.2% net close rate: the math depends on your referral incentive structure, but the principle is clear — you are buying dramatically better close probability per dollar
The reallocation does not mean abandoning digital acquisition. It means running channel-level close rate attribution, identifying which channels operate below your average, and shifting spend toward channels where close rate compensates for higher cost-per-lead.
Lever 3: Proposal Turnaround
Same-day proposals outperform 3–5-day proposals in competitive residential markets — this is industry-observed and directional, not a controlled study result. The mechanism is that delay creates a consideration window during which the customer books competitor appointments.
Cutting design-to-proposal time requires either dedicated design capacity (a team member whose only job is converting site survey data into proposals) or solar design software that allows same-session design completion. The second option is faster to implement and does not require a headcount addition. If a site survey takes 90 minutes and the design can be completed before the rep leaves the customer’s house, the proposal can be reviewed in the driveway. That is a different customer experience than “we’ll send you something in a few days.”
Lever 4: Follow-Up Cadence
Six to eight follow-up touches over 14 days — industry-observed across published sales training programs — outperforms the typical 1–2 touch approach. The Day 1/3/5/7/10/14 template from Stage 5 above is a starting point. Track which days produce responses and optimize the cadence over time.
The primary implementation barrier is CRM automation. If your follow-up relies on rep memory, it will not happen consistently. Automated task creation and email sequences with rep review at each step is the minimum viable infrastructure.
Lever 5: Proposal Accuracy and Presentation
Every inaccuracy in a proposal is a conversion risk. Every visual inconsistency is a trust signal. Proposals built from accurate design data, with production and financial modeling that the customer can verify and understand, close faster and generate fewer objections.
Solar proposal software that integrates design output directly into the customer-facing document eliminates the transcription errors and rounding errors that typically originate in manual proposal builds. It also enforces visual consistency across all reps — which matters when you have three salespeople and two of them are more careful about formatting than the third.
Lever 6: Financing Options Range
A customer who cannot qualify for a loan needs a TPO path. A customer who is tax-positive but has limited cash needs a loan path. A customer who is cash-positive and values simplicity needs a cash path. Presenting only one financing structure means you lose every customer whose situation does not fit that structure.
Battery attach rates (Hawaii: 83.41% per the Solo 2026 Trends Report) and TPO adoption patterns (Michigan: 1.16% to 38.96%) show that markets change faster than most installer financing menus do. Review your financing option range quarterly against what your market is actually demanding.
Key Takeaway
Lever 1 and Lever 2 — speed to lead and lead source reallocation — produce the fastest win rate lift because they affect the largest number of deals at the earliest stage. Lever 3 and Lever 5 produce more durable improvements because they raise close rate per proposal, compounding over time.
See How SurgePV Compresses the Design-to-Proposal Gap
Same-session 3D design and branded proposals — built for installers who close on the first visit.
Book a DemoNo commitment required · 20 minutes · Live project walkthrough
Residential vs. Commercial Solar Win Rate Differences
Residential and commercial solar share the same physics but operate in very different sales environments. The five-ratio framework applies to both, but the rates at each stage look different, and the levers that move them differ as well.
Decision-Maker Count
Residential solar typically involves one or two decision-makers: the homeowner and sometimes a spouse or partner. The proposal-to-verbal-yes stage is primarily a financial and trust decision.
Commercial and industrial solar frequently involves four to eight stakeholders: the facilities manager, the CFO, the legal team reviewing the PPA or lease, the board or ownership group, and in some cases an outside energy consultant. Each additional stakeholder extends the sales cycle and adds a new objection surface. The Stage 4 and Stage 5 dropout rates are substantially higher in C&I deals as a result.
Sales Cycle Length
Residential solar cycles from first contact to signed contract typically run 2–8 weeks, depending on lead source and financing complexity. Commercial solar cycles frequently run 3–18 months, with RFP processes, multiple site visits, independent engineering reviews, and utility interconnection discussions each adding time.
The longer cycle means every stage dropout is more expensive — the cost of reaching a late-stage C&I deal is substantially higher than the cost of reaching a late-stage residential deal, making Stage 4 and Stage 5 accuracy critical.
Proposal Complexity
Residential proposals typically cover system size, production estimate, financial model (cash / loan / PPA), and visual mockup. Commercial solar proposals for commercial solar customers must often also include demand charge analysis, time-of-use modeling, battery feasibility, structural engineering summaries, interconnection timelines, and scenario analysis across multiple financing structures.
Proposal complexity at the C&I level means that proposal accuracy failures (wrong demand charge assumptions, incorrect utility rate structure) are more common and more damaging. A change order on a 500 kW C&I project costs more than $583 — though Aurora’s poll data does not segment by system size, so we are extrapolating directionally.
One Practical Benchmark
There is no clean, segmented public benchmark for C&I solar SQL-to-close rates across deal sizes. What is directionally observable across industry reporting and published case studies: competitive bid C&I projects (where you are one of three or more bidders) close at 10–20%; sole-source or referral-led C&I projects close at 25–40%. These are directional figures, not controlled study results. Treat them as calibration points, not targets.
The practical implication: C&I win rate is much more sensitive to deal qualification at Stage 1 than residential win rate. Walking away from a competitive bid where you have no existing relationship and no product differentiation is often the right call — it preserves design and proposal capacity for deals where you have a structural advantage.
How to Calculate and Track Your Own Win Rate
External benchmarks are useful for calibration. Your own stage-level data is the only thing you can actually act on. Here is the minimum viable measurement system.
The Formula
Overall win rate = (Signed contracts in period) / (New leads in period × same-period lag)
The lag adjustment is necessary because leads generated in January may not close until March. Use a 60–90 day lag window for residential, 180–360 days for C&I. Without the lag adjustment, your current-period win rate will always understate reality because the denominator includes leads that have not had time to close.
Stage-level formula (repeat for each of the 5 stages):
Stage N conversion = (Deals that entered Stage N+1) / (Deals that entered Stage N)
What to Log
Five columns in your CRM are sufficient to run the stage-level model:
| Column | What to Capture |
|---|---|
| Lead source | Channel: referral, Google paid, Facebook, Yelp, phone inbound, Solarize, radio, other |
| Stage entered | 1 through 5 — update when deal moves |
| Stage exit reason | Won / Lost / Stalled / Disqualified |
| Time in stage | Days from stage entry to stage exit |
| Lost reason | Speed / Price / Competitor / Financing / No response / Other |
The “lost reason” column is the one most installers skip and most need. Without it, you cannot distinguish a price problem from a speed problem from a competitor problem — and each requires a different fix.
Interpreting Scenarios
| Scenario | Signal | Action |
|---|---|---|
| A: High Stage 1 dropout, good Stage 4 close rate | Speed-to-lead failure or channel mismatch | Improve response time; audit lead source mix |
| B: Good Stage 1, low Stage 4 close rate | Proposal quality or accuracy problem | Audit change order rate; improve production modeling |
| C: Good Stage 4, low Stage 5 close rate | Follow-up failure or financing stall | Implement structured follow-up cadence; add financing options |
Most installers have a mix of all three scenarios running simultaneously, which is why the overall win rate appears stable even when the underlying drivers are shifting.
Review Cadence
Review stage-level conversion rates monthly. Review channel-level close rates quarterly. Do not make channel budget changes based on a single month of data — small sample sizes produce noise. Look for consistent patterns over 60–90 days before reallocating budget.
Conclusion
Solar’s 13% SQL-to-closed-won average (First Page Sage, 2019–2025) is not a ceiling. It is a baseline that most installers accept because they have not decomposed it into the five sub-ratios that actually drive it. The installers at 29–33% are not operating in easier markets — they have better lead source mix, faster proposal delivery, and more structured follow-up. All three are controllable.
Three actions that move the number within 90 days:
-
Audit your stage-level ratios. Pull the last 90 days of deals and calculate conversion at each of the five stages. Identify the single stage with the highest dropout rate. Fix that stage before touching anything else.
-
Reallocate lead source budget toward higher-close channels. Calculate your channel-level close rate for each source. If any channel is running below 10%, consider whether that budget would compound better as a referral incentive or co-marketing spend with a high-close channel.
-
Cut your design-to-proposal time in half. If your current turnaround is 5 days, target 2–3. If it is 2–3 days, target same-day or next-day. The proposal is the last thing you fully control before the customer makes their decision. Getting it there first matters more than getting it perfect later.
Ready to Close More of the Proposals You’re Already Sending?
SurgePV’s design and proposal tools are built for installers who want to move faster without sacrificing accuracy.
Book a Free DemoNo commitment required · 20 minutes · Live project walkthrough
Frequently Asked Questions
What is a good close rate for solar sales?
A good residential solar proposal-to-signed close rate is 30% or higher when leads come from referrals or community Solarize programs. The industry SQL-to-closed-won average is 13% (First Page Sage, 2019–2025), comparable to B2B SaaS rather than other trades. Anything below 10% across all channels typically signals a process problem rather than a market problem. The most reliable way to assess whether your rate is “good” is to decompose it by lead source — a 15% overall rate driven by Google paid and phone inbound is a better outcome than a 15% rate that includes referrals at 29%. For more on this topic, see Community Solar Business Model.
How many solar leads turn into sales?
Across all sources combined, fewer than 15% of leads turn into signed contracts (Sunvoy / Ipsun Solar, 2022 — 50% lead-to-appointment rate multiplied by 30% appointment-to-close rate). The figure varies sharply by source: referrals close at 29.2% net, Solarize programs at 33%, while Google paid closes at 15% net and Facebook leads at 5–10% (industry-observed). The aggregate is a weighted average of those channel rates — which means your aggregate improves automatically as you shift budget from low-close to high-close channels, even without changing your sales process.
Why are my solar proposals not closing?
Four causes account for most lost proposals: the proposal arrived too late and the customer signed elsewhere; production or shading numbers were inaccurate and the customer lost confidence; financing options were unclear or limited; or follow-up stopped after one or two touches. Each maps to a specific stage in the five-ratio model. Stage 3 failures (design to proposal) show up as slow delivery or change orders. Stage 4 failures (proposal to verbal yes) show up in objections about production estimates or financing. Stage 5 failures (verbal yes to signed) show up as deals that go silent after a verbal commitment.
How fast should I send a solar proposal after the site visit?
Same-day or within 24 hours. The 78% first-responder advantage — widely cited in solar industry training, attributed to Demand Local / MIT research — applies to proposal delivery as much as to initial contact. Each day of delay is a day the customer can book three more competitor appointments. Aurora Solar’s 2019 industry poll data reinforces this: 47% of installers see change orders on 10–30% of their projects (mean cost $583), and 8% lose sales after a change order. Fast proposals built from accurate data avoid both problems — the competitive delay and the accuracy penalty.
Are solar referrals more likely to close?
Yes. Referrals close at 29.2% net — 80% book an appointment, and 37.5% of those appointments close — compared to the 13% SQL-to-closed-won aggregate (Sunvoy / Ipsun Solar, 2022; First Page Sage, 2019–2025). The booking rate is the larger driver. Referral leads arrive expecting the call, with pre-established trust and often direct visibility into a neighbor’s or colleague’s system performance. That compresses Stage 4 objections (production credibility is already established) and Stage 5 friction (the social proof is already in place). A structured referral incentive program — typically $300–$500 per referral that closes — is the highest-ROI acquisition investment most residential installers can make.
What is the solar industry average close rate?
First Page Sage reports 13% SQL-to-closed-won for solar (2019–2025), comparable to B2B SaaS (12%) and lower than HVAC (29%). Sunvoy / Ipsun Solar reports under 15% lead-to-signed across all sources (aggregate of 50% lead-to-appointment times 30% appointment-to-close). Best-in-class referral-focused residential installers operate at 29–33%. The spread between 13% and 33% is driven primarily by lead source mix and proposal turnaround speed — not by market conditions or pricing. An installer in a competitive metro with a mature referral program and same-day proposal delivery will outperform an installer in an easy market relying on Facebook leads and 5-day proposal turnaround every time.