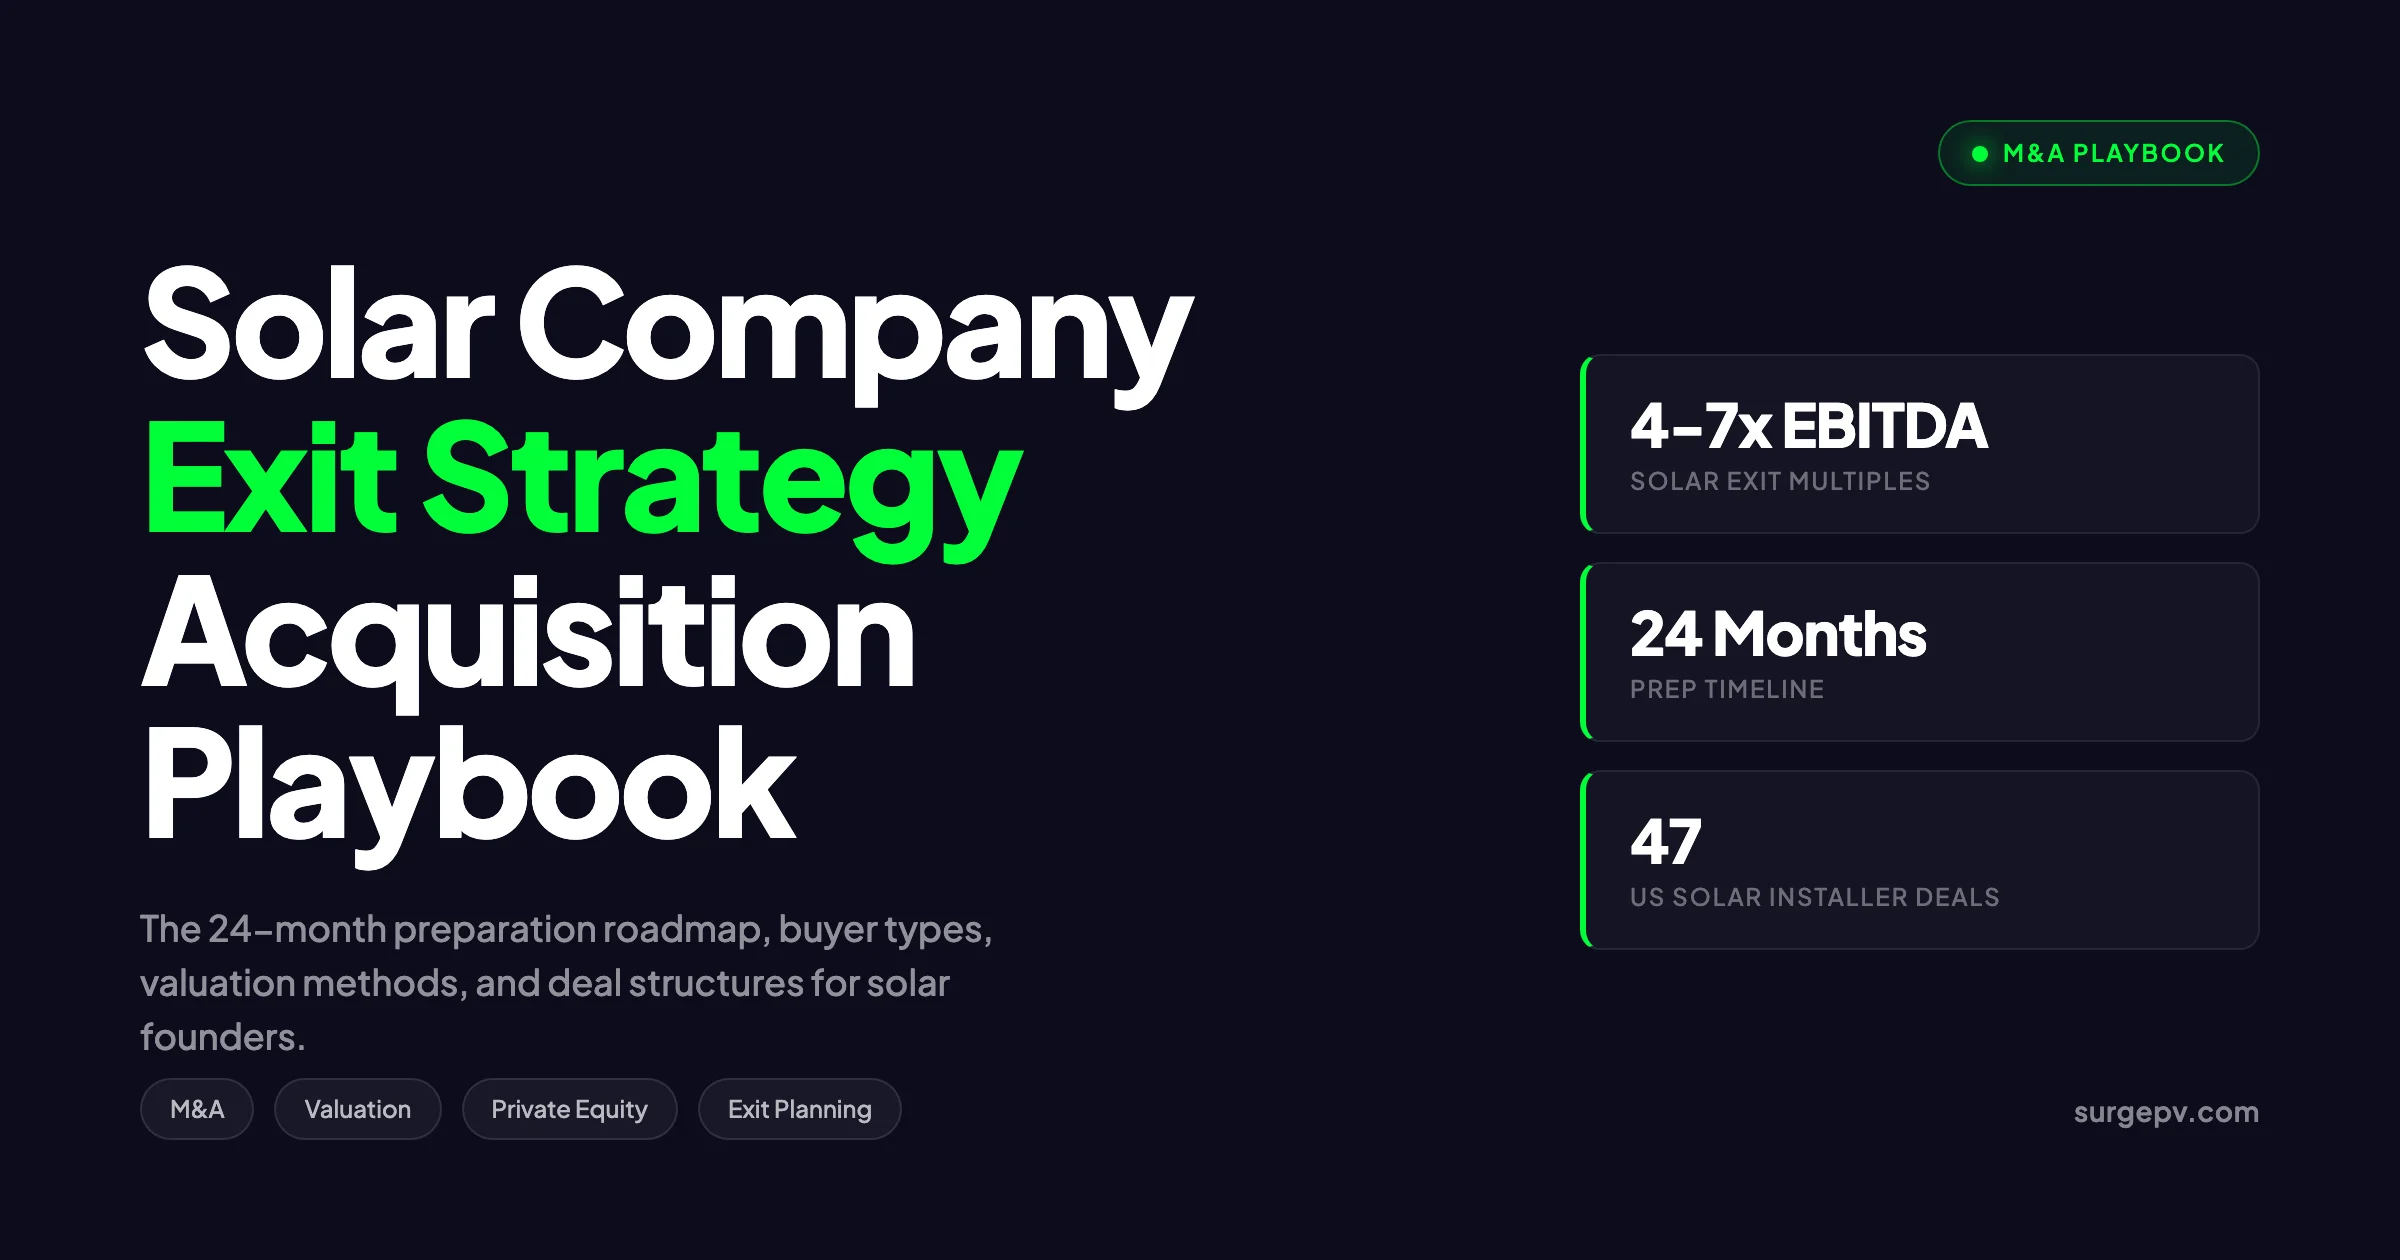
The US solar M&A market saw 96 mergers and acquisitions across the broader solar sector in 2025, up 17 percent from 82 in 2024 per Mercom Capital Group. Median EV/EBITDA multiples for lower-middle-market installer transactions settled between 4x and 7x. Premium platform deals like EQT’s take-private of OX2 cleared 19x. The pattern is clear: deal count is up, headline multiples are down, and well-prepared founders are getting paid.
This guide covers how solar founders structure exits, what buyers pay, and the 24-month playbook that gets you from “the business runs me” to a closed transaction.
Quick Answer
A solar installation business typically sells for 3.5x to 7x adjusted EBITDA, depending on segment, recurring revenue, and customer mix. Plan 24 months ahead. Clean the financials first, build management depth second, and grow EBITDA on a defensible baseline third. Choose the right buyer type for your goals, not the highest headline number.
Key Takeaways
- Solar M&A activity rose 17 percent in 2025 even as funding dollars declined
- Residential installer multiples sit at 3.5x to 5x adjusted EBITDA, commercial at 5x to 7x
- Adjusted EBITDA, not reported EBITDA, drives the price
- Earnouts pay out at 50 to 70 percent of headline value on average
- A clean 24-month preparation cycle adds 1x to 2x to the exit multiple
- Private equity buyers offer rollover equity and a second exit, but cash at close is lower
In this guide:
- Why founders are planning exits now, with current market data
- Five exit paths: acquisition, merger, recap, roll-up, roll-out
- The four buyer types and what each pays
- Valuation methods used by sell-side bankers
- A month-by-month 24-month preparation roadmap
- Deal structures, earnouts, and rollover equity
- Pre-sale operational, financial, and legal cleanups
- The mistakes that kill deals during diligence
- Life after the sale: earnouts, non-competes, founder roles
Why Solar Founders Plan Exits in 2026
Three forces are driving exit conversations across the installer market.
The first is sector consolidation. Wood Mackenzie reports the top 10 US residential solar installers held 39 percent of market share in 2024, up from 31 percent in 2021. Private equity-backed platforms are rolling up regional installers at a steady pace. Owners who stay independent face thinning margins and rising customer acquisition costs. Independents who fight back invest in solar design software to lift gross margin without adding headcount.
The second is founder fatigue. Many solar founders started their companies in the 2017 to 2020 window. They are now in year six to nine of operating. The job has changed from sales and design to managing 50-plus employees, fleet logistics, and regulatory compliance.
The third is interest rate and policy uncertainty. The 30 percent federal residential ITC expired December 31, 2025. State-level incentives are in flux. Buyers want platforms with diversified revenue. Sellers want certainty before the next regulatory cycle.
Pro Tip
The best time to start exit planning is during a growth year, not a flat year. Buyers value trajectory. Selling after two flat years almost always means a discount.
A Denver-based residential installer with $14M revenue and $1.8M adjusted EBITDA sold to a PE-backed platform in Q4 2024. The deal closed at 5.2x adjusted EBITDA, with 65 percent cash at close, 20 percent rollover equity in the platform, and 15 percent earnout tied to 2025 and 2026 EBITDA. The founder kept his CEO role for 24 months. He told us the earnout paid out at 71 percent of target, which was better than most.
Types of Exits: Acquisition, Merger, Recap, Roll-Up, Roll-Out
Founders use the word “exit” to mean different things. Five distinct paths exist.
Full Acquisition
The buyer purchases 100 percent of the equity. The founder receives cash, stock, or a mix at close. Most strategic buyers and many private equity deals fit this model. This is the cleanest exit. You hand over the keys and walk.
Merger of Equals
Two similarly sized companies combine. Founders of both companies stay on, often with split executive roles. True mergers of equals are rare in solar installation. Most “mergers” in the industry are really acquisitions dressed up to soften the news for staff.
Recapitalization
A private equity firm buys a controlling stake, typically 60 to 80 percent. The founder rolls 20 to 40 percent of proceeds into the new entity. The PE firm grows the business for 4 to 6 years, then sells the whole thing. The founder gets a “second bite” on the rollover equity.
Recaps work well when the founder wants partial liquidity now and bigger upside later. They work poorly when the founder wants to retire.
Roll-Up
The founder sells into a platform that is acquiring multiple regional installers. The platform standardizes operations, brand, and back office. Each acquisition adds to a growing EBITDA base. The platform sells to a larger buyer at a higher multiple than any individual installer could achieve alone. For more on this topic, see Solar Operations and Maintenance.
This is the dominant private equity model in solar installation right now. Sungage Financial, Palmetto, and Lumio have all played this game with different mixes of organic and acquired growth.
Roll-Out
The founder uses outside capital to expand into new geographies before exiting. This is closer to a growth investment than an exit. It works when the brand and operations are highly replicable.
Solar Buyer Types: Strategics, PE, Roll-Ups, Public Companies
Each buyer type has different valuation methods, deal structures, and post-close priorities.
| Buyer Type | Typical Multiple | Cash at Close | Founder Role | Best Fit |
|---|---|---|---|---|
| Strategic (industry) | 5x to 7x EBITDA | 80 to 100 percent | 12 to 24 month transition | Clean exits, fast process |
| Private equity (platform) | 5x to 6x EBITDA | 60 to 80 percent | 3 to 5 year operator | Founder wants second bite |
| PE-backed roll-up | 4x to 6x EBITDA | 70 to 90 percent | 12 to 36 month earnout | Mid-size regional installers |
| Public solar company | 4x to 6x EBITDA | 50 to 80 percent | Variable | Acquihire of design or service team |
| Family office | 4x to 6x EBITDA | 70 to 90 percent | Longer hold, slower process | Sellers wanting cultural continuity |
Strategic Buyers
Strategic buyers are other solar companies, electrical contractors, or HVAC platforms moving into solar. They pay the highest cash at close because they capture cost synergies. They also tend to integrate hard and fast, which often means layoffs in your back office.
Examples include Sunrun acquiring Vivint, SunPower acquiring Blue Raven, and HVAC platforms like Service Experts adding solar capabilities.
Private Equity Firms
Private equity firms buy either to build a platform or to add to an existing platform. Platform deals require enterprise value of $50M or more and a strong management team. Add-on deals can be smaller.
PE firms value EBITDA growth potential more than current EBITDA. They will pay a premium if you can show 20 percent annual EBITDA growth on a clean baseline.
PE-Backed Roll-Ups
Roll-ups are the most active buyer category for solar installers between $5M and $50M revenue. They have a defined acquisition thesis, a deal team, and ready capital. Process moves fast, often 90 to 120 days from LOI to close.
The trade-off is that roll-ups apply standard playbooks. Your brand may disappear within 24 months. Your customer-facing systems will be replaced with the platform’s tools.
Public Solar Companies
Public solar firms occasionally buy installers, but most prefer organic growth or asset purchases. They are picky about EBITDA quality and growth trajectory. Reporting requirements add scrutiny that smaller acquirers skip.
Valuation Methods: EBITDA Multiples, Revenue Multiples, Asset Sales
Three valuation methods dominate solar installer M&A.
Adjusted EBITDA Multiple
This is the standard method for installers above $1M EBITDA. EV is calculated as adjusted EBITDA times an industry multiple. Adjusted EBITDA normalizes for:
- Excess owner compensation versus market-rate salary
- One-time legal fees, settlements, or restructuring costs
- Non-recurring revenue items
- Personal expenses run through the business
- Discontinued business lines
The adjustments often add 15 to 30 percent to reported EBITDA. They must be defensible with documentation.
| Solar Segment | EV/EBITDA Multiple Range | Notes |
|---|---|---|
| Residential installer | 3.5x to 5x | Lower for owner-dependent shops |
| Commercial and industrial installer | 5x to 7x | Higher for recurring O&M contracts |
| O&M-only platform | 6x to 9x | Long-term contracts drive premium |
| Solar financing platform | 6x to 10x | Recurring revenue and gross margin |
| EPC and developer | 4x to 8x | Pipeline quality matters most |
| Module distributor | 4x to 6x | Working capital intensive |
Source: ACT Capital Advisors, Phoenix Strategy Group, and Mercom Capital Group reports, 2024 to 2025.
Revenue Multiple
Used when EBITDA is small, negative, or volatile. Solar installers typically trade at 0.4x to 0.8x revenue. Solar SaaS and proposal software companies trade at 4x to 10x revenue.
Revenue multiples are common in distressed sales or when the buyer is paying for a customer book rather than ongoing profits.
Asset Sale
Used when the seller has valuable assets but not a saleable business. Common in distressed situations. The buyer purchases trucks, inventory, customer lists, and select contracts. The seller retains liabilities and winds down the entity.
Asset sales typically clear 40 to 70 percent of what an equity sale would deliver. They are faster and less risky for the buyer.
Why “Adjusted” Matters More Than “Reported”
Two installers with identical $10M revenue might report $800K and $1.4M in EBITDA, but both have $1.5M adjusted EBITDA after normalization. The price gap closes at the negotiating table only if both sellers can document their adjustments with payroll records, contracts, and bank statements. Verbal adjustments do not survive diligence.
The 24-Month Exit Preparation Roadmap
The data is consistent: founders who prepare 24 months in advance close at 1x to 2x higher multiples than those who run a rushed 6-month process. Here is the month-by-month plan.
| Months | Phase | Key Actions |
|---|---|---|
| 1 to 3 | Foundation | Hire CPA review of last 3 years, fix cap table, document key contracts |
| 4 to 6 | Financial cleanup | Switch to accrual accounting, build trailing-twelve-months EBITDA, identify add-backs |
| 7 to 9 | Operational depth | Hire or promote second-in-command, document SOPs, reduce owner dependency |
| 10 to 12 | Growth investments | Add recurring revenue lines (O&M, monitoring), diversify customers, improve gross margin |
| 13 to 15 | Market mapping | Identify likely buyers, attend industry M&A events, talk to bankers informally |
| 16 to 18 | Pre-marketing prep | Build the CIM data room, run a sell-side QofE study, choose advisors |
| 19 to 21 | Active marketing | Engage banker, send teaser, host management meetings, collect IOIs |
| 22 to 24 | LOI to close | Pick the LOI, run buyer diligence, negotiate definitive agreements, close |
Months 1 to 3: Foundation Work
Get a CPA to review the last three years of financials. Fix the cap table. Many founders forget about a small option grant or a vesting milestone. These come back during diligence and create days of delay.
Document every key contract: customer agreements, supplier MOUs, leases, IP assignments. Make a master list with key dates and assignment provisions.
Months 4 to 6: Financial Cleanup
If you are still on cash accounting, switch to accrual. Buyers will normalize to accrual anyway, but they discount the work to do it.
Build a trailing-twelve-months EBITDA calculation. Identify add-backs and document each with source records. A defensible add-back schedule is worth 20 to 30 percent of the price.
Months 7 to 9: Operational Depth
Buyers pay less for businesses that depend on the founder. If you sign every proposal, approve every install, and own every customer relationship, the multiple drops by 0.5x to 1.5x.
Hire or promote a second-in-command. Give them authority over operations or sales. Document standard operating procedures. Move customer relationships into a CRM the company owns, not a founder’s contacts list.
This is also the right time to invest in solar design software that lets your team produce proposals without the founder. A tool like SurgePV’s design tools removes the founder bottleneck on technical accuracy. For a direct comparison, see Arka 360 vs SurgePV.
Months 10 to 12: Growth Investments
Add or grow recurring revenue lines. O&M contracts, monitoring subscriptions, and warranty programs all command higher multiples than one-time install revenue.
Diversify customer mix. If 35 percent of revenue comes from one homebuilder, fix that before going to market. Buyers heavily discount customer concentration.
Improve gross margin. Tighten procurement, reduce rework, and use better generation and financial modeling on every proposal to avoid pricing leaks.
Sell Your Solar Business at a Higher Multiple
Clean proposals, accurate financial models, and standardized design tools all push your exit multiple higher. See how SurgePV helps solar founders professionalize operations before a sale.
Book a DemoNo commitment required · 20 minutes · Live walkthrough
Months 13 to 18: Market Mapping and Prep
Identify the 30 to 50 likely buyers across strategic, PE, and roll-up categories. Track recent deals in your segment. Attend RE+ and other industry events to read the room.
Choose your advisors. A sell-side banker takes 3 to 6 percent of deal value. A small-business broker takes 8 to 10 percent. For deals above $3M EBITDA, a banker almost always pays for itself.
Run a sell-side Quality of Earnings study. This is a third-party CPA report that pre-empts buyer challenges to EBITDA. Cost runs $40K to $90K. It often adds $500K to $2M to the final price.
Months 19 to 24: Active Process and Close
The banker sends a teaser to your buyer list, then a Confidential Information Memorandum to interested parties. You host management meetings with the top 5 to 8 bidders. You collect Indications of Interest, then Letters of Intent.
You pick the LOI based on price, structure, and cultural fit. Then you survive 90 to 120 days of diligence and definitive document negotiation. Close.
Deal Structures: Cash, Earnout, Rollover Equity
Headline price is one number. Take-home cash is another.
Cash at Close
This is the wired amount on closing day. For strategic deals, expect 80 to 100 percent of headline price. For PE deals, expect 60 to 80 percent. For roll-ups, expect 70 to 90 percent.
A working capital adjustment runs through closing. The buyer expects a certain level of net working capital to operate the business. If you deliver less, you owe the buyer the difference. If you deliver more, the buyer owes you.
Earnouts
Earnouts defer payment based on post-close performance. Typical structures pay an extra 10 to 25 percent of headline price over 1 to 3 years.
Targets can be EBITDA, revenue, or specific milestones like permit volume or customer count. Most earnouts pay out at 50 to 70 percent of the maximum. Buyers find ways to deflate the metric. Sellers should negotiate caps, floors, and clear definitions.
Rollover Equity
The seller takes part of the proceeds as equity in the new (post-close) company. Standard rollover is 10 to 30 percent of total consideration.
The pitch is the “second bite.” If the buyer doubles the platform value in 5 years, your rollover doubles too. The risk is that rollover equity is illiquid, may be diluted by future raises, and depends on the buyer executing well.
Seller Notes
Less common in solar M&A, but seen in smaller deals. The seller finances part of the purchase with a note. The buyer pays interest and principal over 3 to 5 years. Subordinated to bank debt. Higher risk, higher headline price.
Why Founder Rollover Equity Often Disappoints
The standard PE pitch is that rollover equity gives founders a “second bite at the apple.” Roll 20 percent of proceeds into the platform, watch the buyer 3x the business in 5 years, and your rollover 3x’s too. The reality is messier.
Three problems show up consistently.
First, the rollover is often valued at the same multiple the founder just sold at, but the founder paid taxes on the cash portion. The rollover dollar is a pre-tax dollar competing against post-tax dollars elsewhere.
Second, PE firms layer on debt during their hold. By exit, the rollover often sits behind preferred returns to the PE fund and behind senior debt. Even a successful sale at 1.5x money for the PE fund can return 0.8x to 0.5x for the founder’s rollover.
Third, dilution from add-on acquisitions and management options eats the rollover share. A 20 percent rollover at year 1 might be 11 percent by year 5.
The founders who win on rollover are the ones who stay involved as operators, negotiate ratchets on management equity, and read the actual capital structure documents. Founders who roll passively and trust the PE firm’s projections see disappointing outcomes more often than not.
Negotiate the Rollover Documents, Not Just the Headline
The LOI shows the rollover percentage. The definitive agreement shows the preferred return, the catch-up provisions, the tag-along rights, and the drag-along rights. The latter set is where founders win or lose. Hire a lawyer who has closed at least 10 PE buyout deals on the sell side.
Pre-Sale Cleanups: Financials, Operations, Legal
Buyers run diligence in three workstreams. Each one can kill a deal.
Financial Cleanups
- Convert to accrual accounting if not already done
- Recognize revenue per ASC 606 (or local equivalent)
- Reserve properly for warranty obligations
- Document all add-backs with source records
- Run a sell-side Quality of Earnings study
- Reconcile bank, AR, AP, and inventory to the trial balance
- Clean up any related-party transactions
The single most common diligence finding is under-reserved warranty liability. Buyers will demand a reserve adjustment that hits EBITDA. A 1 percent reserve on $10M revenue is $100K, which at a 5x multiple is $500K off the price.
Operational Cleanups
- Document SOPs for sales, design, install, and service
- Move customer data into a single CRM
- Standardize the proposal and design workflow with solar proposal software
- Verify NABCEP and other certifications are current
- Audit subcontractor labor classification (1099 versus W-2)
- Reduce customer concentration below 20 percent for any single account
- Build a key employee retention plan (stay bonuses, equity grants)
Labor classification is a hidden landmine. The IRS, state regulators, and the Department of Labor have all increased enforcement. A buyer’s diligence team will look at every 1099 contractor and ask why they are not a W-2 employee.
Legal Cleanups
- Fix the cap table; resolve any disputed shares or options
- Get IP assignment agreements from every developer and designer
- Review and renew key contracts (suppliers, landlords, key customers)
- Resolve any open litigation or settle pending claims
- File trademark assignments and update Secretary of State records
- Confirm all licenses (electrical, contractor, sales tax) are in good standing
- Document any environmental remediation obligations on owned property
For solar installers, an often-overlooked item is the assignability of customer contracts. If your standard PPA or finance agreement requires customer consent on transfer, a buyer will demand a contract amendment process before close. For more on this topic, see Solar PPA Negotiation Guide.
Common Mistakes That Kill Deals
Five mistakes show up over and over. Each one is preventable.
Mistake 1: Selling on Reported EBITDA Without Add-Back Documentation
Founders pitch reported EBITDA of $800K and tell the buyer “but really it’s $1.5M after add-backs.” Without source documents, the buyer credits maybe 40 percent of the verbal add-backs. The price drops accordingly. Fix this with a third-party Quality of Earnings report.
Mistake 2: Customer Concentration Above 30 Percent
If one customer is more than 25 to 30 percent of revenue, buyers either discount the multiple by 0.5x to 1.5x or require an earnout tied to retention of that customer. Diversify before going to market.
Mistake 3: Owner Doing Everything
If the founder personally signs every proposal, approves every install, manages every key customer, and is the only one who knows pricing logic, the multiple drops by 1x to 1.5x. Build management depth and demonstrate it during management meetings.
Mistake 4: Skipping the Sell-Side QofE
A sell-side Quality of Earnings report runs $40K to $90K. It validates the EBITDA, identifies add-backs, and gives the buyer one less thing to negotiate. Companies that skip it see headline multiples shaved during diligence on average by 0.4x to 0.8x.
Mistake 5: Treating M&A Like a Side Project
The CEO can run the company or run the deal. Not both. Most failed processes happen because the founder gets distracted by an operational fire and misses two weeks of buyer questions. Hire a banker. Designate an internal M&A point person, usually a CFO or VP Finance.
Myth Busting: “We Don’t Need an Investment Banker”
The data is consistent: bankers add 15 to 30 percent to final price net of their fee. The exception is a single known buyer making a strong direct offer, which happens about 10 percent of the time. For all other cases, hire the banker.
Myth Busting: “Our Multiple Will Be Higher Because We Are a Solar Company”
Solar gets a small premium versus generic specialty contractors, but only when the business looks like a specialty contractor at scale. A $3M revenue residential installer with no recurring revenue trades like an HVAC shop, not like a software company.
After the Sale: Earnouts, Non-Competes, Founder Roles
The deal closes. Then what?
The Transition Period
Most deals require the founder to stay for 12 to 36 months. Strategic acquirers often want 12 months. PE firms typically want 24 to 36 months. Roll-ups want 24 months on average.
During this period, the founder usually keeps an executive title (CEO of the brand, President of the region, EVP of integration). Compensation is a base salary plus the earnout if applicable.
Earnout Mechanics in Practice
Earnouts are tracked against a defined metric. EBITDA earnouts are the most common, then revenue, then unit count.
The most-fought issues in earnout disputes are: cost allocations from the buyer that depress EBITDA, working capital draws that hurt revenue recognition, and changes in pricing or product mix imposed by the buyer.
Negotiate clear definitions and protective covenants up front. Allow only “ordinary course” changes during the earnout period. Require the buyer to operate the business as a separate P&L if needed.
Non-Compete and Non-Solicit
Standard solar M&A non-competes run 3 to 5 years. They cover the same geographic markets and customer types. Non-solicits cover customers and employees for 2 to 3 years.
Negotiate carve-outs for unrelated business lines (commercial real estate, software, consulting) if you plan to do something else.
What Founders Do Next
Common paths after a solar exit:
- Stay 24 months, then start a new venture in adjacent solar (financing, software, O&M)
- Stay 36 months and roll into a senior platform role with the PE firm
- Take a 6 to 12 month break, then advise other solar founders
- Move into solar-adjacent sectors (storage, EV charging, smart home)
The founders who exit best are the ones who knew before the deal what their next chapter looked like. Founders who plan no next step often regret the sale within 18 months.
How Solar Software Tools Affect Exit Multiples
Buyers pay more for solar businesses with standardized, software-driven operations. The reasons are simple: standardized operations are easier to scale, easier to integrate, and easier to value. Founders who run their teams on professional-grade solar software walk into diligence with cleaner data and exit at higher multiples.
Specific tools that affect diligence:
- Design software: A shadow analysis and design platform that the team uses on every job reduces rework and protects gross margin
- Proposal software: Standardized solar proposals make pricing logic transparent and defensible
- AI assistants: Tools like Clara AI handle initial customer engagement and qualification at scale
- Financial modeling tools: Consistent generation and financial models build buyer confidence in unit economics
- CRM and project management: A CRM the company owns (not the founder’s contacts) is required for any deal
Founders who professionalize tooling 12 to 24 months before sale see the cleanest diligence and the strongest multiples. Last-minute software adoption looks like staging and gets discounted.
For broader context on what affects unit economics before exit, see our solar business profitability guide and our piece on solar installer profit margins.
ROI of Exit Preparation
Is 24 months of preparation worth it? The numbers say yes.
| Preparation Level | Typical Multiple | $1.5M EBITDA Sale Price |
|---|---|---|
| No prep, owner-dependent, cash accounting | 3x | $4.5M |
| 6-month prep, basic cleanup | 4x | $6.0M |
| 12-month prep, banker engaged | 4.5x | $6.75M |
| 24-month prep, sell-side QofE, depth in management | 5.5x | $8.25M |
The 24-month prep adds $3.75M to the price on a $1.5M EBITDA business. The cost of preparation, including the QofE, banker fees, and management depth investment, is typically $300K to $500K. The ROI is 7x to 12x.
For a $5M EBITDA business, the math gets even better. The same 1x to 2x multiple uplift translates to $5M to $10M of additional consideration on prep costs of $500K to $1M.
For more on scaling decisions that affect exit value, see our guides on scaling a solar installation business and solar business growth strategies. For benchmarks on what large players look like, see top solar companies by revenue 2026.
Conclusion: Three Action Steps for Founders Considering a Sale
- Start 24 months ahead. Today, hire a CPA to review the last three years of books and identify cleanup work. Run an internal Quality of Earnings exercise to identify add-backs and gaps.
- Build management depth. Promote or hire a second-in-command in the next 90 days. Move customer relationships into a company CRM. Document SOPs. Reduce owner dependency to the point where you can take a 4-week vacation without disruption.
- Engage advisors at month 18. Interview at least three sell-side bankers and pick one. Engage an M&A attorney with a portfolio of at least 10 closed sell-side deals. The right team adds 15 to 30 percent to final price.
The solar M&A window in 2026 favors prepared sellers. Buyers have capital. Multiples are stable. The ones who get paid most are the ones who treat preparation as the actual deal, not as the warm-up.
For context on the wider market, the latest Mercom Capital Group report tracks deal counts and funding totals quarterly. Wood Mackenzie publishes installer market share data. SEIA tracks industry trends and policy. PitchBook covers private market transactions, and BloombergNEF reports broader clean energy investment flows.
Get Your Solar Business Acquisition-Ready
SurgePV helps founders standardize design, proposal, and financial modeling workflows. Cleaner operations mean higher exit multiples.
Book a DemoNo commitment required · 20 minutes · Live walkthrough
For pricing and tools that fit your operation, see SurgePV pricing. For solar installer-specific features and channel manager workflows, explore the product pages.
Frequently Asked Questions
How much is a solar installation business worth?
A residential solar installer with $5M to $20M in revenue typically sells for 3.5x to 5x adjusted EBITDA. Commercial installers and O&M-heavy businesses fetch 5x to 8x. A $2M EBITDA residential company would price between $7M and $10M. Recurring service revenue, crew retention, and clean financials push the multiple higher.
What multiple of EBITDA do solar buyers pay?
Solar installer multiples in 2025 ranged from 3.5x to 7x adjusted EBITDA, per ACT Capital Advisors and Mercom data. Residential installers trade closer to 4x to 5x. Commercial and industrial installers hit 5x to 7x. O&M platforms with long-term contracts can reach 8x. Adjusted EBITDA margins near 10 percent are required for top-end pricing.
How long does a solar company sale take?
A full M&A process takes 9 to 14 months from kickoff to close. Preparation runs 3 to 6 months. Marketing the deal and collecting bids takes 2 to 3 months. Diligence and documentation runs another 3 to 5 months. Founders who start cleanup work 24 months ahead see the highest multiples.
Should I sell to private equity or a strategic buyer?
Strategics pay more upfront and integrate fast, but they often cut your team. Private equity pays less cash, asks for rollover equity, and keeps management in place for a second bite at the apple. Choose strategics if you want a clean exit. Choose private equity if you want to grow the platform and exit again in 4 to 6 years.
What are earnouts in solar M&A?
An earnout is deferred payment tied to post-close performance. Buyers use earnouts when they think your forecast is aggressive or when permit pipeline conversion is uncertain. A typical structure pays 70 percent at close, with 30 percent over 2 to 3 years based on EBITDA or revenue targets. Most earnouts pay out at 50 to 70 percent of the headline number.
When should I start preparing for an exit?
Start 24 months before your target close date. Months 1 to 6 fix financial reporting and clean the cap table. Months 7 to 12 build management depth and standardize operations. Months 13 to 18 grow EBITDA on a clean baseline. Months 19 to 24 hire advisors and run the process.
What kills solar M&A deals during diligence?
Five issues kill the most deals: unrecorded warranty liabilities, customer concentration above 25 percent, missing labor classification documentation, undocumented related-party transactions, and cap table errors. Each adds weeks to diligence and shaves 0.5x to 1.5x off the multiple. Fix these before going to market.
Do I need an investment banker to sell my solar company?
Companies above $3M EBITDA should hire a sell-side banker or M&A advisor. Their fee runs 3 to 6 percent of deal value but raises the final price by 15 to 30 percent on average. Smaller deals can use a business broker at 8 to 10 percent. Direct sales to a known strategic save fees but cost negotiating leverage.


