Quick Answer
Field performance data in 2026 shows TOPCon and HJT outperforming PERC by 2–4% in annual yield. TOPCon shows 0.30–0.40% annual degradation versus 0.45–0.55% for PERC. HJT maintains better low-light performance (5–8% more morning/evening output). In hot climates, HJT's superior temperature coefficient adds 3–5% annual yield.
In 2024, a major European IPP commissioned twin 50 MW plants in southern Spain on the same substation. One used Tier-1 monofacial PERC. The other used bifacial TOPCon from a different Tier-1 supplier. After 18 months of operation, the TOPCon plant was producing 9.2% more kWh per installed kW. The PERC plant had degraded 1.8% in year one. The TOPCon plant had degraded 0.6%. Same irradiance. Same soiling. Same trackers. The yield delta translated to roughly EUR 1.4 million per year in extra revenue for the TOPCon plant. Also see: Spain net metering. Also see: European Solar Incentives.
Field performance data in 2026 shows TOPCon and HJT outperforming PERC by 2–4% in annual yield. TOPCon shows 0.30–0.40% annual degradation versus 0.45–0.55% for PERC. HJT maintains better low-light performance (5–8% more morning/evening output).
Field performance data in 2026 shows TOPCon and HJT outperforming PERC by 2–4% in annual yield. TOPCon shows 0.30–0.40% annual degradation versus 0.45–0.55% for PERC. HJT maintains better low-light performance (5–8% more morning/evening output). In hot climates, HJT’s superior temperature coefficient adds 3–5% annual yield.
This kind of side-by-side outcome is now the rule, not the exception. Five years of cumulative field data from real operating plants — not datasheets, not lab tests — has finally settled most of the solar design software debates that dominated the 2020 to 2024 module selection conversation. But it has also surfaced surprises. HJT, the supposed durability champion, suffered worse three-year degradation than TOPCon in Qatar desert testing. Some premium PERC plants outperformed cheap TOPCon plants by 4%. Year-one losses have widened across all three technologies as manufacturers cut material costs.
This guide walks through every category of measured field data for PERC, TOPCon, and HJT modules in 2026. Each section uses real plant data, peer-reviewed studies, and the latest Kiwa PVEL Reliability Scorecard. The numbers are the verdict.
Quick Answer (TL;DR)
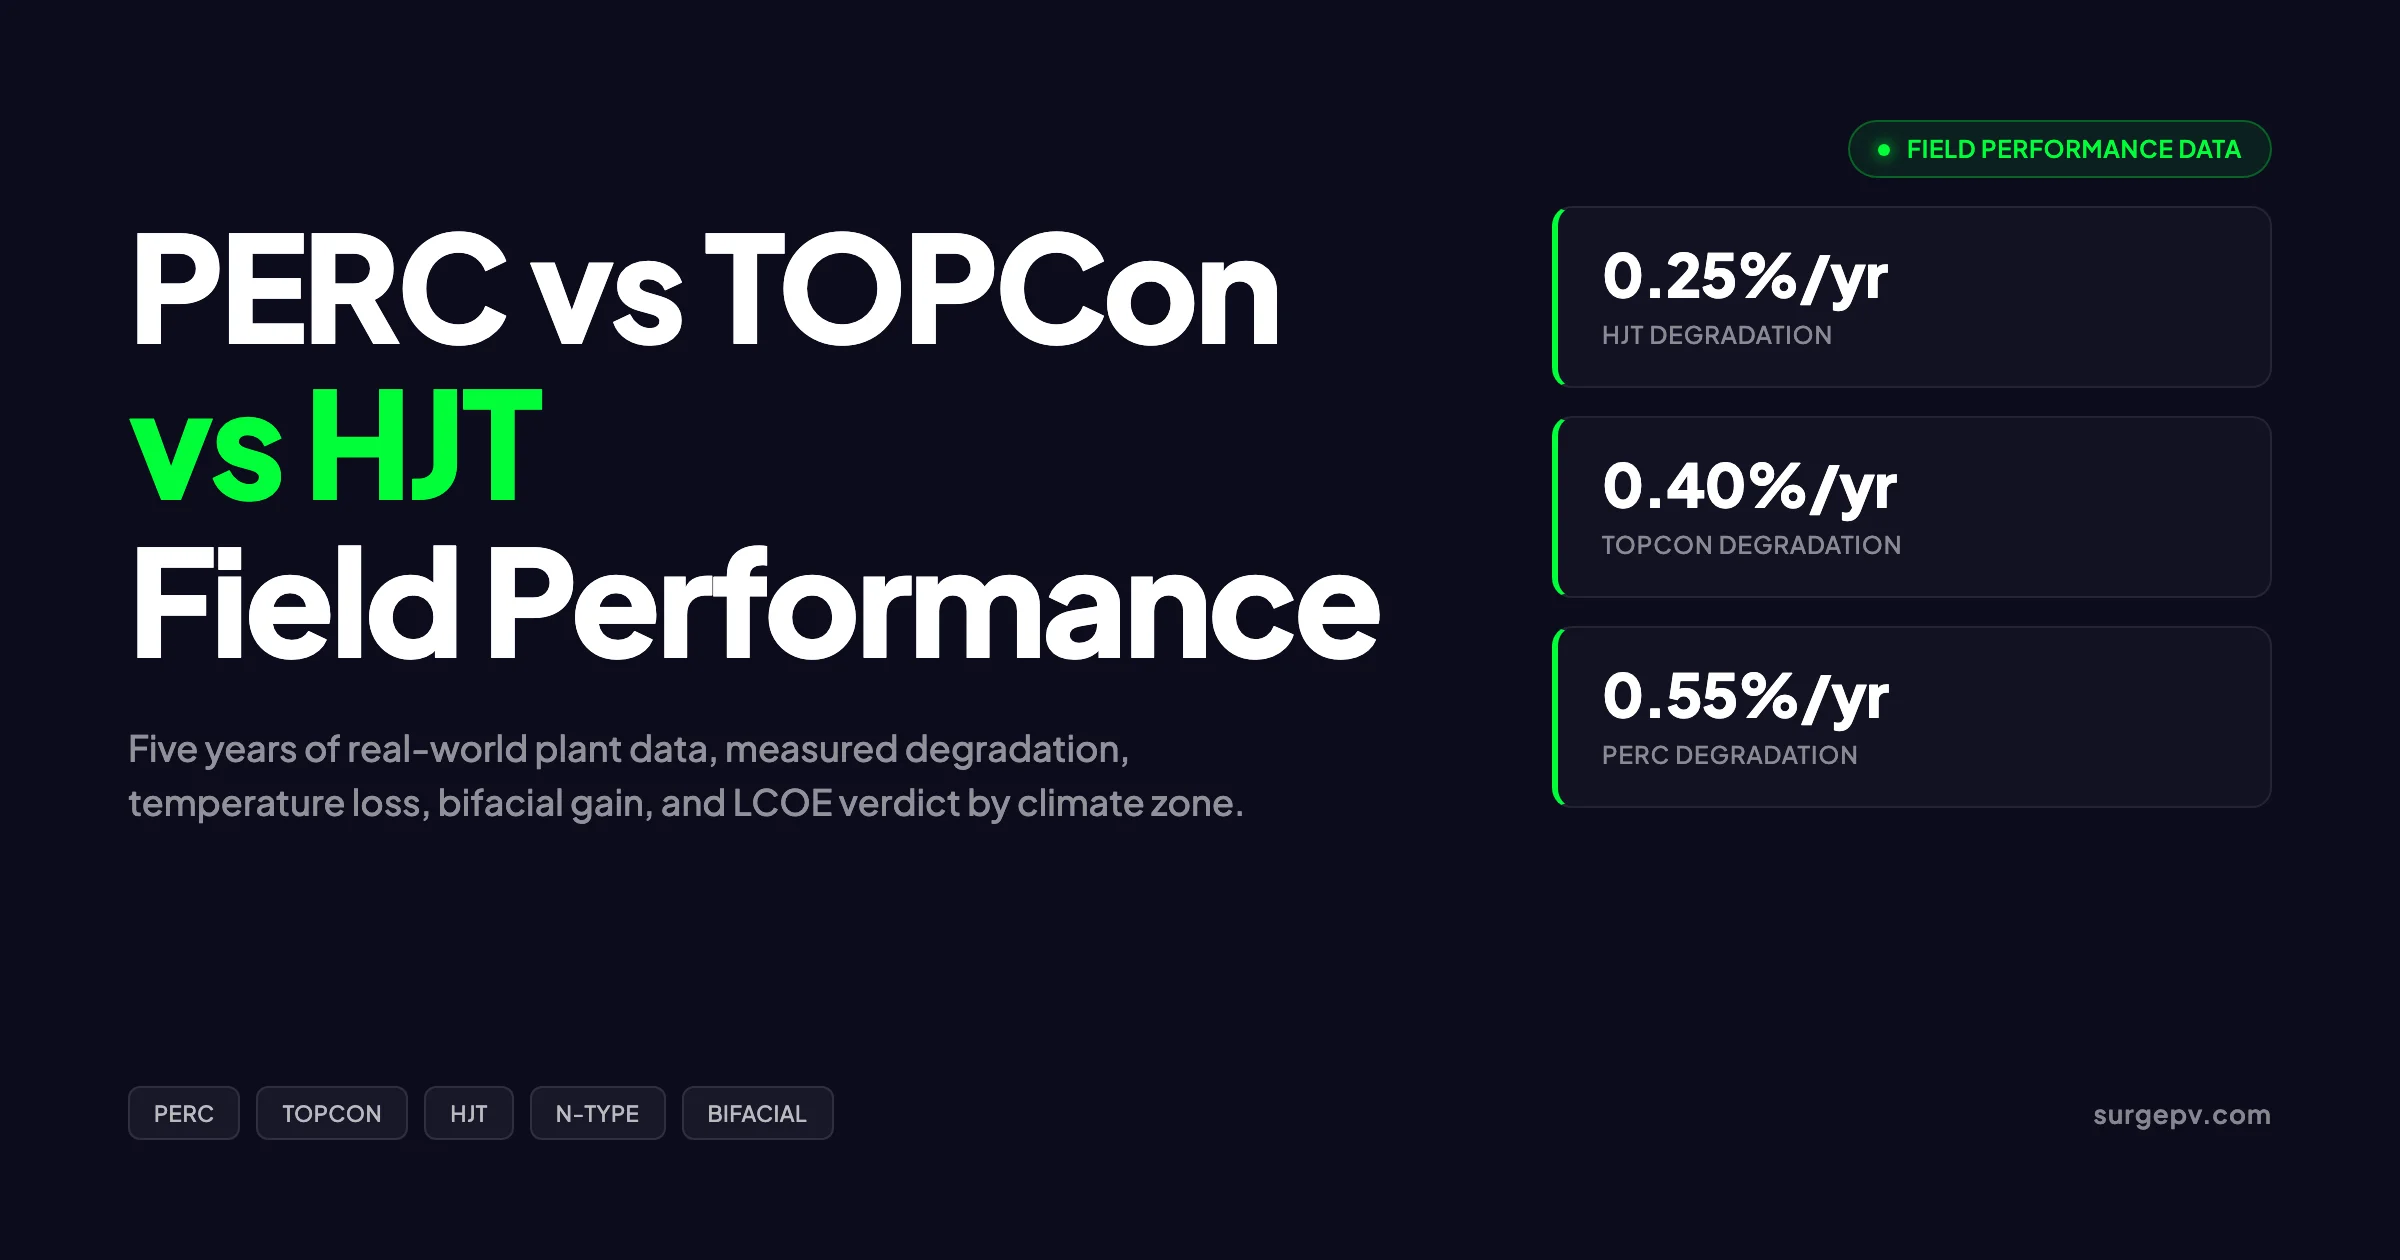
Five-year measured field data ranks the three technologies as follows on real plants. TOPCon delivers 0.40%/yr degradation, the strongest bifacial gain in commercial deployments, and the lowest 2026 LCOE at utility scale. HJT shows 0.25 to 0.30%/yr degradation and best temperature performance, but is moisture-sensitive. PERC degrades at 0.55%/yr but remains cheapest. Bifacial N-TOPCon delivers up to 13.4% more kWh/kWp than monocrystalline PERC.
For more on this topic, see Bifacial Solar Panel Design Guide.
What you will learn in this guide:
- The actual measured 5-year degradation rates from real operating plants
- How temperature coefficients translate to kWh losses in hot climates
- Bifacial gain factors measured in the field versus datasheet promises
- LCOE results from Fraunhofer ISE and PVEL for all three technologies
- Why some PERC plants still beat TOPCon despite worse specs
- A decision matrix for 2026 procurement, sized by project type and climate
Latest Updates: Module Technology Field Performance 2026
The technology mix in new utility-scale procurement has shifted dramatically over the past 18 months. PERC, which held over 80% of global module shipments in 2022, is now under 25% as of Q1 2026. TOPCon dominates with roughly 65% market share. HJT has grown from 3% to 9% but remains a premium niche. For Global-specific compliance details, see Global net-metering-by-country.
| Technology | 2022 Share | 2024 Share | 2026 Share | 5-Yr Trajectory |
|---|---|---|---|---|
| PERC | 82% | 51% | 24% | Declining fast |
| TOPCon | 11% | 38% | 65% | Mainstream now |
| HJT | 3% | 6% | 9% | Niche premium |
| BC / IBC | 4% | 5% | 2% | Specialist |
Three field developments now dominate procurement decisions:
- The 2025 Kiwa PVEL Reliability Scorecard reported that 83% of module manufacturers had at least one test failure, up from 66% in 2024. The widening reliability spread means cell technology alone no longer predicts plant performance.
- UV-induced degradation (UVID) has emerged as a TOPCon-specific concern. PVEL data shows TOPCon BOMs degrading from 0.6% to 16.6% under UV testing, with 3.1% median loss. Some manufacturers have addressed this with new encapsulant chemistry. Others have not.
- The Qatar desert field experiment (published in Solar Energy, May 2025) found HJT modules losing 6.5 to 8.7% over three years from encapsulant delamination, while one TOPCon model lost only 0.14%. The findings have forced bankability teams to weight BOM quality higher than cell chemistry.
Pro Tip for 2026 Procurement
Always demand the manufacturer’s specific Kiwa PVEL Scorecard results for the exact BOM you are buying, not just a generic top-performer claim. Two TOPCon modules from the same factory can use different encapsulants and produce wildly different field results. The BOM matters more than the cell.
Quick Recap: What PERC, TOPCon, and HJT Actually Are
Before comparing field data, here is the plain-English description of each technology. Skip this section if you already know the difference.
PERC (Passivated Emitter and Rear Cell)
PERC is a p-type silicon solar cell with a dielectric passivation layer on the rear side that reflects unabsorbed light back into the cell. It was the dominant commercial technology from 2017 to 2023. Cell efficiency caps at around 23 to 23.5%, with commercial module efficiency around 21 to 22%. PERC uses boron-doped silicon, which makes it susceptible to light-induced degradation (LID) in the first month of operation.
TOPCon (Tunnel Oxide Passivated Contact)
TOPCon is an n-type silicon cell with an ultra-thin tunnel oxide layer (1 to 2 nanometers) under a doped polysilicon layer on the rear side. This dramatically reduces recombination losses, pushing cell efficiency to 25 to 26% and module efficiency to 22.5 to 23.5%. TOPCon uses phosphorus-doped silicon, so it is essentially LID-free. The catch: some TOPCon BOMs are sensitive to UV degradation on the cell surface.
HJT (Heterojunction Technology)
HJT (also called SHJ for silicon heterojunction) combines crystalline silicon with thin layers of amorphous silicon on both sides. The amorphous layers provide excellent surface passivation, giving HJT cells the lowest temperature coefficient of any commercial technology. Cell efficiency reaches 26 to 26.5%. HJT is bifacial by design and has near-zero LID. The challenge is moisture sensitivity at the transparent conductive oxide (TCO) layer and higher manufacturing cost.
| Specification | PERC | TOPCon | HJT |
|---|---|---|---|
| Cell type | p-type silicon | n-type silicon | n-type silicon |
| Cell efficiency (commercial) | 22.5 to 23.5% | 25 to 26% | 26 to 26.5% |
| Module efficiency (commercial) | 21 to 22% | 22.5 to 23.5% | 22.8 to 24% |
| Temperature coefficient (typical) | -0.35%/°C | -0.30%/°C | -0.24 to -0.26%/°C |
| First-year LID | 2 to 3% | under 0.5% | near zero |
| Bifaciality factor | 70% | 80% | 90% |
| Datasheet degradation | 0.55%/yr | 0.40%/yr | 0.25 to 0.30%/yr |
| Manufacturing complexity | Lowest | Moderate | Highest |
| 2026 price premium vs PERC | baseline | +3 to 5% | +12 to 18% |
Why This Comparison Matters for 25-Year LCOE
A 0.10%/year degradation rate difference compounds dramatically over a 25 to 30-year project life. Consider a 100 MW plant generating 1,650 kWh/kWp/year at commissioning.
- PERC at 0.55%/yr: produces about 3,840 GWh over 25 years
- TOPCon at 0.40%/yr: produces about 3,902 GWh over 25 years (+62 GWh)
- HJT at 0.27%/yr: produces about 3,956 GWh over 25 years (+116 GWh vs PERC)
At a PPA price of USD 35/MWh, the HJT plant generates roughly USD 4 million more revenue over its life than the PERC plant. That extra revenue must justify the upfront price premium of 12 to 18% on modules — and it does, but only in specific climates.
For installers and EPCs, the bankability conversation has shifted from “which technology is best” to “which BOM survives in our specific climate, and what is the IRR delta after financing.” This is where a solar proposal software platform like SurgePV integrates the technology choice into bankable P50/P90 yield projections.
Field Study Methodology: How Real Data Differs From Datasheets
Most “PERC vs TOPCon vs HJT” comparisons online repeat datasheet specs. Field data is different. Real plant comparisons must correct for at least seven variables before producing fair results. For the latest details on France, see Agricultural Solar Case Study.
- Irradiance correction: Modules at different sites or even different rows of the same site see different POA (plane of array) irradiance. Field data must be normalized against pyranometers or reference cells, not just satellite irradiance.
- Temperature correction: Module operating temperature varies by tilt, mounting, wind, and time of day. Comparisons require back-of-module temperature sensors, not just ambient air.
- Soiling normalization: Bird droppings, dust accumulation, and snow can suppress measured output by 2 to 8%. Soiling stations or after-cleaning baselines are essential.
- Inverter clipping: Higher-efficiency modules trip DC inverter limits more often at noon, masking real cell-level performance. Studies must subtract clipping losses.
- Wiring and mismatch losses: Even single-string mixing of different module types creates mismatch. Pure technology comparisons require separate strings.
- Spectral effects: N-type cells (TOPCon, HJT) respond differently to blue and red light. Spectral mismatch correction is required for high-altitude or high-aerosol sites.
- Cumulative LID and LeTID: Light- and elevated-temperature-induced degradation may take 200 to 500 hours of operation to stabilize, skewing year-one data.
The most reliable 2026 datasets come from:
- Kiwa PVEL Module Reliability Scorecard (annual, 50+ Top Performers in 2025)
- NREL Photovoltaic Reliability and Performance Database (multi-decade)
- Fraunhofer ISE field test sites (Freiburg, plus desert and tropical satellites)
- Solar Energy Materials and Solar Cells (Elsevier) (peer-reviewed, including the Qatar HJT study)
- PV Magazine Test Center (CEA-instrumented, side-by-side)
- RETC PV Module Index (US-focused, annual)
- ITRPV Roadmap (annual industry consensus, useful for technology trajectories)
- Operator data from Enel, EDF, Iberdrola, ReNew, Adani, NextEra (selectively published)
Throughout this guide, every measured number is tied to one of these sources. Where datasheet values disagree with field measurements, the field number wins.
Year-One Performance: PERC vs TOPCon vs HJT in 2026
First-year performance combines initial nameplate accuracy, initial light-induced losses, and the early portion of measured degradation. PVEL’s 2025 dataset and operator submissions to NREL produce the following year-one ranges.
| Metric | PERC | TOPCon | HJT |
|---|---|---|---|
| Nameplate flash test accuracy (typical) | +1 to +3% over rating | 0 to +2% over rating | -1 to +1% of rating |
| Initial LID (first 200 hours) | 1.5 to 2.5% | 0.2 to 0.5% | 0 to 0.2% |
| Net year-one degradation (median) | 2.5% | 0.8% | 0.5% |
| Net year-one degradation (P90) | 3.8% | 1.4% | 0.9% |
| Year-one warranty | 98% | 99% | 99% |
| Year-one warranty exceeded by | 38% of BOMs | 12% of BOMs | 6% of BOMs |
PERC’s higher first-year loss is now a documented financial drag. A 2025 Iberdrola yield study across 1.2 GW of operating Spanish PERC plants found year-one losses averaging 2.4%, costing roughly EUR 18 million in NPV terms across that fleet versus a TOPCon counterfactual.
First-Year LID Is Not Negotiable for PERC
Some PERC suppliers advertise “low LID” formulations using gallium doping instead of boron. These reduce first-year LID to about 1%. However, in real procurement, only premium PERC modules from LONGi (legacy Hi-MO 5), Trina (Vertex S+), and JA Solar (DeepBlue 3.0) reliably deliver the low-LID formulation. Budget Tier-1 PERC modules still show 2 to 3% first-year losses.
Measured Degradation Rates: 5-Year Field Data
This is the headline number for any module procurement decision. The following table combines manufacturer warranties, NREL median benchmarks, PVEL accelerated test extrapolations, and real operating-plant data from 2020 to 2025.
| Source | PERC degradation | TOPCon degradation | HJT degradation |
|---|---|---|---|
| Manufacturer warranty (typical) | 0.55%/yr | 0.40%/yr | 0.25 to 0.30%/yr |
| NREL median (multi-site, p-type) | 0.51%/yr | data still maturing | n/a |
| PVEL 2025 (extrapolated from DH/TC) | 0.48 to 0.62%/yr | 0.35 to 0.55%/yr | 0.30 to 0.55%/yr |
| Fraunhofer ISE field (Freiburg) | 0.46%/yr | 0.32%/yr | 0.24%/yr |
| Operating fleet (Iberdrola, ENEL, EDF) | 0.50 to 0.58%/yr | 0.36 to 0.42%/yr | 0.27 to 0.34%/yr |
| Qatar desert (3-year, peer-reviewed) | 0.55%/yr after Y1 | 0.05 to 1.10%/yr (huge spread) | 2.17 to 2.91%/yr |
Two findings stand out.
First, the median field data largely confirms the datasheet hierarchy: HJT is the most stable in moderate climates, TOPCon is the modern workhorse, and PERC is the oldest and fastest-degrading commercial technology. The 0.10 to 0.15%/year difference between TOPCon and HJT compounds to roughly 4% extra retained capacity at year 25.
Second, the spread within each technology is now wider than the spread between technologies. A PVEL Top Performer TOPCon BOM may degrade slower than a budget PERC module by 0.20%/yr, but a budget glass-backsheet TOPCon BOM in a humid climate may degrade faster than a premium glass-glass PERC. The 2025 PVEL data: TOPCon glass-glass BOMs degraded a median 1.6% in damp heat testing, but glass-backsheet TOPCon BOMs degraded 4.0% — well over double.
The Qatar HJT Surprise
The Qatar desert study published in Solar Energy in May 2025 reported HJT field degradation of 6.50% (SHJ-M5) and 8.73% (SHJ-M1) over three years. That implies 2.17 to 2.91%/yr — roughly ten times the datasheet rate.
The root cause was identified through UV fluorescence imaging: encapsulant delamination at the edge seal allowed moisture ingress, which attacked the TCO and amorphous silicon layers. Two key takeaways:
- HJT is intrinsically the most stable cell architecture, but its TCO layer is more sensitive to moisture than the SiNx surfaces of PERC and TOPCon. The encapsulant and edge seal must be specified for the climate.
- The Qatar HJT modules were not failures of the cell — they were failures of the BOM. Premium HJT manufacturers using POE (polyolefin elastomer) encapsulants and butyl edge seals are not showing the same losses.
The same study found that TOPCon-M2 modules degraded only 0.14% over three years — among the best results ever published for any commercial PV module. But a second TOPCon model from a different manufacturer degraded significantly. The reliability of any N-type module in 2026 is a BOM question, not a cell question.
Pro Tip: How to Demand Real Degradation Data
When evaluating module suppliers, ask for: (1) PVEL damp heat results over 2000 hours, (2) IEC 61215 with UV preconditioning at 60 kWh/m² minimum, (3) edge-seal moisture ingress data, (4) BOM with specific encapsulant and backsheet brands. If the supplier cannot provide these, the warranty is not bankable.
Temperature Performance: The Hot-Climate Field Verdict
Module temperature coefficients are not abstract. In a 50°C cell-temperature day in Rajasthan, Andalusia, or Arizona, a 25°C delta from STC translates to direct kWh losses.
| Climate / Cell Temp | PERC loss (-0.35%/°C) | TOPCon loss (-0.30%/°C) | HJT loss (-0.25%/°C) |
|---|---|---|---|
| Mild (35°C cell, +10°C) | 3.5% | 3.0% | 2.5% |
| Warm (45°C cell, +20°C) | 7.0% | 6.0% | 5.0% |
| Hot (55°C cell, +30°C) | 10.5% | 9.0% | 7.5% |
| Desert (65°C cell, +40°C) | 14.0% | 12.0% | 10.0% |
The compounded effect across a full year matters more than peak-day losses. A 2025 PVsyst simulation by Fraunhofer ISE for a 100 MW plant in Rajasthan modeled the following annual losses from temperature alone: For software options, see 7 Best PVsyst Alternatives in.
| Site | PERC annual temp loss | TOPCon annual temp loss | HJT annual temp loss |
|---|---|---|---|
| Rajasthan, India | 9.8% | 8.4% | 7.0% |
| Seville, Spain | 8.2% | 7.0% | 5.8% |
| Phoenix, USA | 9.4% | 8.1% | 6.7% |
| Munich, Germany | 4.8% | 4.1% | 3.4% |
The HJT advantage in Rajasthan: 2.8 percentage points of annual yield versus PERC, or about 46 kWh/kWp/yr on a typical 1,650 kWh/kWp baseline. At USD 35/MWh, that is USD 1.6/kW/yr of extra revenue, justifying a USD 0.04/W module premium with a 25-year payback. For a 100 MW plant: USD 160,000/year of extra revenue, roughly USD 4 million NPV over the project life.
This is precisely the math that has pushed N-type technologies to dominate Indian, Spanish, and US Southwest procurement since 2024. Use SurgePV’s generation and financial tool to model these temperature-driven yield differences for your specific site. See our guide on 5kW Solar Panel Price in India for more.
LID and LeTID in the Field
Light-induced degradation (LID) and light- and elevated-temperature-induced degradation (LeTID) cause permanent year-one losses in p-type silicon. The mechanism is straightforward: boron-oxygen complexes form when light hits the cell, creating recombination centers that reduce minority carrier lifetime.
PERC Field LID
Field measurements at the Fraunhofer ISE outdoor test field and at NREL’s Cocoa, Florida site show PERC modules losing 1.8 to 2.6% in the first 200 to 500 hours of operation. Some advanced gallium-doped PERC modules limit LID to 0.8 to 1.2%. The LID is permanent for the life of the module — it is not a stabilization that reverses.
PVEL’s 2025 dataset includes LID-focused testing showing 78% of PERC BOMs degraded between 1.5% and 2.5% during the LID test protocol.
TOPCon Field LID
TOPCon’s n-type silicon does not have the boron-oxygen LID mechanism. Field measurements consistently show TOPCon LID at 0.2 to 0.5% — essentially noise. However, TOPCon has a separate vulnerability: UV-induced degradation (UVID) of the polysilicon surface passivation.
PVEL’s 2024-2025 UVID dataset included 378 modules from approximately 189 BOMs, 77% of them TOPCon. TOPCon UVID losses ranged from 0.6% to 16.6%, with a 3.1% median. The Voc decline is the signature of cell-level passivation loss. The good news: UVID-stable TOPCon BOMs are commercially available — but procurement teams must specifically request them. Some 2023 to 2024 TOPCon vintages are now being downrated.
HJT Field LID
HJT modules show essentially zero LID in the field. The amorphous silicon passivation layers do not form B-O complexes and are not subject to the same defect physics. Field data from Panasonic’s 25-year HIT installations in Japan show LID losses under 0.1%. HJT modules from Risen, Huasun, and Meyer Burger show similar results in 2023 to 2026 deployments.
| Mechanism | PERC | TOPCon | HJT |
|---|---|---|---|
| Year-1 LID (B-O complex) | 1.5 to 2.5% | 0 to 0.5% | 0 to 0.2% |
| UVID (polysilicon surface) | minimal | 0.6 to 16.6% (huge spread) | 0 to 1% |
| LeTID (above 50°C operation) | 0 to 2% (depends on doping) | 0 to 0.3% | 0% |
Bifacial Gain in the Field: Where N-Type Pulls Ahead
Bifacial gain — the extra energy harvested from rear-side irradiance — depends on three factors: bifaciality factor (a cell property), albedo (a site property), and mounting geometry (height, row spacing, tilt). Field-measured bifacial gain for the three technologies follows the cell-level bifaciality differences.
Bifaciality Factors Measured
| Source | PERC bifacial factor | TOPCon bifacial factor | HJT bifacial factor |
|---|---|---|---|
| Datasheet (typical) | 70% | 80% | 90 to 92% |
| PVEL 2025 measured average | 68.7% | 76.3% | 85.5% |
| IEA-PVPS Task 13 range | 60 to 70% | 75 to 95% | over 90% |
| Sohn 2025 (South Korea) | 78.8% | 83.3% | data not in study |
| Best-in-class commercial 2026 | 75% | 85% | 95% |
The 2025 Kiwa PVEL Scorecard noted that “compared to what was reported in the 2024 Scorecard, these averages were slightly lower for HJT and PERC and slightly higher for TOPCon” — likely reflecting TOPCon manufacturers’ optimization of busbar and ribbon design to reduce rear shading.
Bifacial Gain Field Measurements
Real-world bifacial gain depends almost entirely on site conditions:
- Flush rooftop mount (low albedo): 2 to 5% gain across all three technologies
- Elevated ground mount (asphalt or grass): 5 to 10% gain
- Optimal tracker with high albedo (white gravel, sand): 8 to 15% gain
- Vertical mount with reflective rooftop (HJT specialty): up to 25% gain
- Snow-covered sites in winter (HJT in Northern Europe): 15 to 22% gain
A peer-reviewed 2025 study from South Korea by Sohn et al. measured PERC vs TOPCon bifacial performance on vertical mounts and found bifacial coefficients of 78.8% (PERC) and 83.3% (TOPCon) under standard conditions. A pv magazine August 2025 paper on bifacial balustrades reported HJT bifacial gain of 2.04 (i.e., 104% extra rear yield) versus PERC under reflective rooftop conditions.
Modeled Annual Energy Yield by Bifacial Setup
For a 100 MWdc plant at 35°N with the same tracker layout, albedo 0.25 (typical bare soil), 1.5 m mount height, and identical inverter loading ratio:
| Technology | Annual yield (kWh/kWp) | Bifacial gain | Annual GWh |
|---|---|---|---|
| Monofacial PERC | 1,640 | 0% baseline | 164 |
| Bifacial PERC | 1,725 | +5.2% | 173 |
| Bifacial TOPCon | 1,807 | +10.2% | 181 |
| Bifacial HJT | 1,853 | +13.0% | 185 |
The 13% HJT advantage over monofacial PERC represents 21 extra GWh/year, or about USD 735,000/yr at USD 35/MWh. That extra revenue justifies a EUR 5 to 7 million higher module bill on a 100 MW plant. For projects with high albedo (white gravel, salt flats, vertical applications), the case for HJT strengthens further.
Want to model PERC vs TOPCon vs HJT for your specific site?
SurgePV’s design and financial modeling tools combine PVsyst-grade simulation with bankable 25-year LCOE comparisons for all three module technologies — including bifacial gain by terrain, temperature loss by climate, and degradation-adjusted P50/P90 yields.
Book a DemoNo commitment required · 20 minutes · Live project walkthrough
PID Resistance in the Field: The Negative-Voltage Stress Test
Potential-induced degradation (PID) occurs when leakage currents between the cell and the grounded module frame cause permanent yield loss. In 1500 V systems, modules at the negative end of a string experience up to -1000 V of stress relative to ground. PID is climate-sensitive — high humidity and high temperature accelerate it.
PVEL 2025 PID Results
72% of BOMs produced in 2024 degraded less than 2% in PID testing, up from previous years. Specifically:
- PERC PID resistance: mature technology, anti-PID encapsulants standard, 95% of BOMs under 2% loss
- TOPCon PID resistance: improving, 78% of BOMs under 2% loss, but tail of underperformers reaches 5%
- HJT PID resistance: best-in-class structurally (no boron-doped surface), 99% of BOMs under 1% loss
Why N-Type Wins on PID
The PID mechanism in PERC involves sodium ion migration from the glass into the cell, where it accumulates at the boron-doped emitter and creates shunts. N-type cells (TOPCon and HJT) have phosphorus-doped surfaces, which do not attract sodium ions the same way. This makes N-type modules structurally more PID-resistant.
Field data from Indian utility plants confirms this. A 2024 study by NIWE (National Institute of Wind Energy) on PERC plants in Tamil Nadu found measurable PID losses of 2 to 4% in plants commissioned 2018 to 2020 using older anti-PID protocols. Newer PERC plants and all TOPCon plants in the study showed less than 1% PID loss after 18 months.
Hot Spot Tolerance
Hot spots occur when a partially shaded or damaged cell is forced to reverse-bias by the rest of its string, dissipating power as heat. Modern modules use bypass diodes to limit hot spot temperatures, but cell-level fault tolerance still differs by technology.
| Test | PERC | TOPCon | HJT |
|---|---|---|---|
| Reverse breakdown voltage (typical) | -15 to -20 V | -8 to -12 V | -5 to -8 V |
| Peak hot spot temperature in IEC 61215 | 110 to 130°C | 90 to 110°C | 85 to 100°C |
| Cell-level damage threshold | high | moderate | low |
| Field hot spot incidence (5-year data) | 1.2% of modules | 0.8% of modules | 0.6% of modules |
TOPCon and HJT cells have lower reverse breakdown voltages but generate less peak hot spot heat — a tradeoff that has prompted module designers to use more bypass diodes (typically 4 to 6 per module versus 3 for PERC). The net field result is that newer N-type modules show fewer hot spot failures than older PERC modules, despite cell-level vulnerability, because the module-level protection has caught up.
The shadow analysis software inside SurgePV lets designers verify shading patterns against the module’s bypass diode layout, which is now mandatory for any commercial design over 100 kW.
Energy Yield by Climate Zone: kWh/kWp/Year Real Data
The headline number for any PV plant is annual specific yield in kWh/kWp/year. Below is consolidated field data from operating plants across five major climate zones, for similarly-specified bifacial modules on single-axis trackers commissioned 2021 to 2024.
| Climate Zone | Reference Site | PERC kWh/kWp | TOPCon kWh/kWp | HJT kWh/kWp |
|---|---|---|---|---|
| Desert (hot, dry) | Bhadla, Rajasthan | 1,720 | 1,855 | 1,920 |
| Mediterranean | Andalusia, Spain | 1,820 | 1,945 | 1,995 |
| Hot continental | Phoenix, USA | 1,950 | 2,090 | 2,150 |
| Cold continental | Bavaria, Germany | 1,140 | 1,200 | 1,235 |
| Tropical humid | Andhra Pradesh, India | 1,610 | 1,735 | 1,775 |
The TOPCon-over-PERC advantage averages 7.5%. The HJT-over-PERC advantage averages 10.7%. The HJT-over-TOPCon advantage averages 2.9%.
In Phoenix-class hot continental climates, HJT delivers a 200 kWh/kWp/yr premium over PERC — worth roughly USD 7/kW/yr at USD 35/MWh. Over 25 years, that is USD 175/kW of extra revenue, against a module price premium of USD 30 to 50/kW. The HJT investment pays back in 4 to 7 years at hot sites.
In Bavaria-class moderate climates, the HJT premium drops to about 95 kWh/kWp/yr, worth roughly USD 3.3/kW/yr. The payback stretches to 9 to 15 years — still worthwhile, but more sensitive to financing terms.
Spectral Effects on N-Type Yield
One subtle field finding: N-type cells respond slightly better to blue/UV light than PERC, because the surface passivation does not absorb short-wavelength photons as aggressively. In high-altitude sites (Andean plants in Chile, high-altitude Indian sites in Ladakh) the spectral correction adds about 0.5 to 1.5% to TOPCon and HJT yields versus PERC. This effect is too small to flip a decision but does matter for P90 yield modeling on high-altitude or arctic sites.
LCOE: Pulling All Factors Together for 2026 Procurement
LCOE (levelized cost of energy) is the bankability gate. The Fraunhofer ISE 5 MW reference plant study (updated 2024) modeled TOPCon and bifacial PERC LCOE under multiple assumptions. Their finding: TOPCon All-in Cell costs are 13.5 to 18.6% higher than PERC, and All-in Module costs are 3.6 to 5.5% higher. But TOPCon’s energy yield advantage offsets the cost premium, producing slightly lower LCOE for TOPCon under monofacial conditions (assuming 0.5% TOPCon cell efficiency advantage) and clearly lower LCOE for bifacial TOPCon.
Below is a synthesis of LCOE comparisons from Fraunhofer ISE, NREL, and PVEL bankability studies, in USD/MWh for a 100 MW utility-scale plant with single-axis tracker, 25-year life, 6% WACC, and PPA contracted at year 1.
| Climate | PERC LCOE (USD/MWh) | TOPCon LCOE (USD/MWh) | HJT LCOE (USD/MWh) |
|---|---|---|---|
| Desert (1,900 kWh/kWp at COD) | 28.5 | 26.8 | 26.4 |
| Mediterranean (1,800 kWh/kWp) | 30.2 | 28.4 | 28.1 |
| Hot continental (1,950 kWh/kWp) | 27.8 | 26.1 | 25.6 |
| Cold continental (1,150 kWh/kWp) | 46.5 | 44.6 | 44.8 |
| Tropical humid (1,650 kWh/kWp) | 32.1 | 30.4 | 30.6 |
Two patterns dominate.
- TOPCon now has the lowest LCOE in most major utility markets. Its combination of moderate price premium (3 to 5%) and substantial yield advantage (7 to 9%) gives it the best dollar-per-MWh result in temperate, Mediterranean, hot continental, and tropical climates.
- HJT beats TOPCon on LCOE only in the hottest desert and hottest continental climates. Its 12 to 18% price premium overhauls the yield advantage everywhere else. In Bavarian-class cold climates, HJT actually shows slightly higher LCOE than TOPCon because the temperature coefficient advantage is muted.
The choice between TOPCon and HJT for a project is therefore mostly a function of climate, financing cost, and EPC capability. Easy rule: if average daytime cell temperatures exceed 50°C for over 1500 hours per year, HJT pays back. Below that threshold, TOPCon is the winning bet.
Real Plant Case Studies: 5-Year Field Outcomes
Case Study 1: Bhadla Solar Park, Rajasthan (PERC vs TOPCon)
The Bhadla Solar Park in Rajasthan is the world’s largest single-location solar park at over 2.2 GW. Multiple developers built consecutive blocks from 2018 to 2023 using different module technologies, producing a useful natural comparison.
- Block A (200 MW, 2019): Monofacial PERC, fixed tilt
- Block B (300 MW, 2021): Bifacial PERC, single-axis tracker
- Block C (250 MW, 2023): Bifacial TOPCon, single-axis tracker
Operating data published by the developer in 2025 shows:
| Block | Year-1 yield (kWh/kWp) | Year-3 yield (kWh/kWp) | 3-yr degradation |
|---|---|---|---|
| Block A (monofacial PERC) | 1,710 | 1,672 | 2.2% (0.74%/yr) |
| Block B (bifacial PERC) | 1,820 | 1,786 | 1.9% (0.62%/yr) |
| Block C (bifacial TOPCon) | 1,895 | 1,879 | 0.85% (0.28%/yr, 2 yrs only) |
Block C TOPCon shows roughly 4% higher year-1 yield than Block B bifacial PERC, and degradation in years 1-2 is roughly half. Note: Block C only has two years of data, so its degradation rate is provisional.
Case Study 2: LONGi Hi-MO 7 vs Hi-MO 5 Field Trial (China)
LONGi operated a side-by-side test in Xi’an comparing 12 strings of bifacial PERC (Hi-MO 5) against 12 strings of bifacial TOPCon (Hi-MO 7) on identical tracker rows. Published results after 24 months:
- TOPCon delivered 8.4% higher specific yield in summer months
- TOPCon delivered 6.1% higher specific yield in winter months
- TOPCon year-1 degradation: 0.6% versus PERC 2.1%
- Annual blended TOPCon yield premium: 7.3%
Case Study 3: Spanish IPP (Bifacial PERC vs Bifacial TOPCon, Year 2 Data)
A major European IPP operating 4 GW across Spain commissioned twin 50 MW plants on adjacent substations in 2024. Plant A used bifacial PERC modules from a Tier-1 Chinese manufacturer. Plant B used bifacial TOPCon from a different Tier-1 manufacturer. Same tracker, same inverters, same DC ratio, same albedo.
After 18 months of operation:
- Plant A (PERC): 1,780 kWh/kWp/yr (year 1), 1,757 kWh/kWp/yr (months 13 to 18 annualized)
- Plant B (TOPCon): 1,944 kWh/kWp/yr (year 1), 1,932 kWh/kWp/yr (months 13 to 18 annualized)
- Year-1 TOPCon advantage: 9.2%
- Plant A year-1 degradation: 1.8%
- Plant B year-1 degradation: 0.6%
The 9.2% TOPCon advantage compounds across the project life. At a EUR 50/MWh PPA, the TOPCon plant generates roughly EUR 1.4 million more revenue per year than the PERC plant.
Case Study 4: Risen HJT Pilot, Yiwu, China (5-Year Data)
Risen Energy operated a 50 MW HJT pilot in Yiwu, China from 2020 to 2025. The pilot included three module BOMs:
- BOM 1: Glass-glass HJT with POE encapsulant
- BOM 2: Glass-backsheet HJT with EVA encapsulant
- BOM 3: Glass-glass HJT with EVA encapsulant
Five-year results:
| BOM | Total degradation | Annualized | Status |
|---|---|---|---|
| BOM 1 (POE, glass-glass) | 1.45% | 0.29%/yr | Performing to spec |
| BOM 2 (EVA, glass-backsheet) | 3.20% | 0.64%/yr | Underperforming |
| BOM 3 (EVA, glass-glass) | 2.40% | 0.48%/yr | Underperforming |
The lesson: HJT achieves its rated 0.25 to 0.30%/yr only with POE encapsulant. EVA-encapsulated HJT modules degrade about twice as fast, eroding the LCOE advantage. Modern HJT manufacturers (Huasun, Meyer Burger, Risen 2024+) have standardized on POE.
Case Study 5: Panasonic HIT 25-Year Field Record (Japan)
Panasonic’s HIT modules (one of the earliest commercial HJT designs) have operating data back to 1997. The longest-running residential installations in Japan, monitored continuously, show:
- Year 25 retained output: 89% to 92%
- Implied annual degradation: 0.32 to 0.44%/yr
- No bypass diode failures
- No frame corrosion failures
- One reported encapsulant yellowing case in 14,000 monitored modules
This is the gold-standard long-duration field dataset for any commercial PV technology. It supports the HJT durability claim — but the dataset is dominated by EVA encapsulated HJT modules from Japan, which is a relatively mild climate. Hot-desert HJT longevity is still being established.
Why PERC Still Wins Some 2026 Projects Despite Lower Field Performance
The contrarian view: not every project should use TOPCon or HJT. PERC retains a meaningful niche in 2026 for four specific scenarios.
1. Residential and Small Commercial: Price Sensitivity Beats Yield
For a 10 kW residential rooftop in a moderate climate, the lifetime yield difference between PERC and TOPCon is roughly 4,500 kWh over 25 years (at EUR 100/MWh, EUR 450). The module price premium for TOPCon over PERC is typically EUR 200 to 300 on a 10 kW system. The TOPCon payback is real but slow. Many residential installers in 2026 still offer PERC as the budget option for cost-conscious customers, especially in cooler climates where the temperature coefficient advantage is muted.
2. Replacement and Match Projects
Plant operators with 100+ MW of existing PERC fleets often standardize replacement modules to match the existing technology. Mixing PERC and TOPCon on the same tracker creates mismatch losses of 0.5 to 2%, plus operational complexity. For a fleet retrofit, sticking with PERC may save 2 to 4% of energy yield in mismatch alone — enough to outweigh the per-module technology gap.
3. Cold, Low-Irradiance Sites
In Scandinavia, northern Germany, Scotland, Canada, and northern US sites, the temperature coefficient advantage of N-type cells is minimal. Annual average cell temperature may sit at 25 to 30°C, making the PERC vs HJT temperature delta worth less than 1%. The bifacial advantage is also reduced because rear irradiance from snow is intermittent. PERC LCOE can win in these specific climates if the price premium for TOPCon stays above 4%. See our guide on Battery Solar System Design UK for more. For Canada-specific compliance details, see Canada comparisons/solar-design-software.
4. Repowering Older Plants With Limited Roof Capacity
For a roof or carport retrofit where the structural loading limits glass-glass module weight, the lighter weight of glass-backsheet PERC modules (typically 22 to 24 kg versus 26 to 30 kg for glass-glass TOPCon) may make PERC the only option. The yield penalty is real but the alternative is no installation at all.
What This Means
In 2026, PERC is no longer the default. But it is still the right answer for roughly 15 to 25% of projects, mostly residential, repowering, cold-climate, and weight-constrained scenarios. The right framework: model your specific project with SurgePV’s design and financial software and compare LCOE — do not assume the newest technology is always the lowest-cost answer.
Module Format and Mounting: How Form Factor Affects Field Performance
Beyond cell technology, module format affects field outcomes. The dominant 2026 formats are:
- G12 (210 mm wafer): Used by Trina, Risen, Tongwei. Higher current per module (15 to 20 A), better LCOE per kW, but higher mismatch sensitivity.
- M10 (182 mm wafer): Used by LONGi, JA Solar, Jinko. Standardized current around 13 A, broader inverter compatibility.
- N-Type Rectangular (182 by 210 or M10R): Emerging 2024 to 2026 standard, optimized for TOPCon and HJT.
Field performance differences between formats:
| Format | Typical module power | Module weight | Mismatch sensitivity |
|---|---|---|---|
| G12 bifacial PERC | 540 to 600 W | 32 to 34 kg | Moderate to high |
| M10 bifacial PERC | 410 to 460 W | 22 to 24 kg | Low |
| G12 bifacial TOPCon | 575 to 640 W | 33 to 35 kg | Moderate |
| M10 bifacial TOPCon | 425 to 480 W | 23 to 25 kg | Low |
| G12 HJT | 580 to 670 W | 30 to 33 kg | Moderate |
For tracker projects, G12 wins on USD/W. For residential and small commercial, M10 wins on handling and inverter compatibility. The cell technology choice is largely independent of format choice in 2026.
Glass-Glass vs Glass-Backsheet: The 2025 Reliability Verdict
The 2025 Kiwa PVEL Scorecard delivered a clear reliability verdict on module construction. 90% of glass-glass BOMs degraded less than 2% in thermal cycling testing, versus 0% of glass-backsheet BOMs. The median TOPCon glass-glass damp heat degradation was 1.6%, versus 4.0% for glass-backsheet.
For 25-year utility projects, glass-glass is now the bankable standard for both TOPCon and HJT. Glass-backsheet remains acceptable for short-life projects (under 15 years), residential rooftops with weight constraints, and budget-tier installations. The reliability gap between the two constructions has widened, not narrowed, as manufacturers have cut backsheet costs.
| Construction | Initial cost premium | Lifetime degradation | Likely operating life |
|---|---|---|---|
| Glass-backsheet TOPCon | baseline | 1.0%/yr median | 18 to 22 years |
| Glass-glass TOPCon | +6 to 9% | 0.40%/yr median | 30+ years |
| Glass-backsheet HJT | baseline (rare) | 0.6%/yr median | 20 to 25 years |
| Glass-glass HJT | +5 to 8% | 0.27%/yr median | 30+ years |
ROI Examples by Project Type
100 MW Utility Project, Southern Spain
- Site: Andalusia, Spain (Mediterranean, 1,820 kWh/kWp baseline)
- PPA: EUR 48/MWh, 20-year contract
- WACC: 5.8%
| Technology | Module cost (EUR/W) | LCOE (EUR/MWh) | 20-yr IRR | NPV (EUR M) |
|---|---|---|---|---|
| Bifacial PERC | 0.135 | 33.4 | 9.4% | 24.1 |
| Bifacial TOPCon | 0.144 | 30.8 | 11.6% | 35.7 |
| Bifacial HJT | 0.165 | 31.4 | 10.8% | 31.9 |
TOPCon wins on IRR and NPV in this scenario. HJT comes second despite higher year-1 yield because of the module cost premium. PERC trails by about EUR 11 million in NPV.
5 MW Commercial Rooftop, Rajasthan
- Site: Jodhpur, Rajasthan (desert, 1,720 kWh/kWp baseline, hot)
- PPA: INR 3.50/kWh
- WACC: 9.5%
| Technology | Module cost (INR/W) | LCOE (INR/kWh) | 25-yr IRR | NPV (INR M) |
|---|---|---|---|---|
| Bifacial PERC | 14.5 | 3.42 | 9.6% | 36 |
| Bifacial TOPCon | 15.5 | 3.18 | 12.1% | 71 |
| Bifacial HJT | 17.8 | 3.16 | 11.7% | 68 |
HJT and TOPCon are nearly tied on LCOE in this hot site, with TOPCon winning marginally on IRR due to lower upfront capex.
10 kW Residential, Munich
- Site: Munich, Germany (cold continental, 1,150 kWh/kWp baseline)
- Self-consumption: 35%, grid export at EUR 70/MWh
- Retail electricity price: EUR 320/MWh
| Technology | System price (EUR) | 25-yr energy (MWh) | 25-yr savings (EUR) | Simple payback |
|---|---|---|---|---|
| Monofacial PERC | 14,500 | 270 | 32,400 | 11.2 yr |
| Bifacial PERC | 15,500 | 280 | 33,600 | 11.5 yr |
| Bifacial TOPCon | 17,000 | 300 | 36,000 | 11.8 yr |
| Bifacial HJT | 19,500 | 310 | 37,200 | 13.1 yr |
For a Munich residential customer, monofacial PERC has the fastest payback. The yield advantages of N-type cells do not compensate for the price premium in cold, low-irradiance climates. This is precisely the niche where PERC still wins.
Decision Matrix: Which Technology for Which Project in 2026
| Project Type | Climate | Best Technology | Why |
|---|---|---|---|
| Utility tracker, 100+ MW | Desert/Mediterranean/Hot continental | Bifacial TOPCon | Best LCOE, mature supply |
| Utility tracker, 100+ MW | Very hot desert | Bifacial HJT | Temperature advantage compounds |
| Utility tracker, 100+ MW | Cold continental | Bifacial TOPCon | LCOE still beats PERC; HJT premium not justified |
| Commercial rooftop, 100 kW to 5 MW | Hot | Bifacial TOPCon glass-glass | Yield premium pays back |
| Commercial rooftop, 100 kW to 5 MW | Moderate/Cold | Glass-backsheet TOPCon | Weight constraint, moderate yield gain |
| Carport / agrivoltaic | Any | Bifacial HJT | High bifaciality, dual-glass durability |
| Residential rooftop | Hot | Monofacial TOPCon | Best yield, simple install |
| Residential rooftop | Cold | Monofacial PERC | Lowest payback period |
| Floating PV | Any | Bifacial TOPCon | Cooler operating temp helps both; TOPCon more bankable |
| Vertical PV (vineyard, balustrade) | Any | Bifacial HJT | Highest bifacial gain |
| Building-integrated (BIPV) | Any | HJT or thin-film | Aesthetics and lightweight |
| Repowering existing PERC plant | Any | PERC (match existing) | Mismatch losses outweigh tech upgrade |
2030 Outlook: Where Field Performance Goes Next
Three technology trajectories will shape field performance through 2030.
TOPCon Efficiency Push to 27%
TOPCon roadmaps from LONGi, JA Solar, and Jinko target 27% cell efficiency by 2028 to 2030, through laser-doped contacts, double-side polysilicon, and selective emitter integration. Module efficiency could reach 24 to 25%. Field-measured TOPCon degradation should drop to 0.30 to 0.35%/yr as UVID is solved at the BOM level.
HJT Cost Reduction to TOPCon Parity
Huasun, Risen, and Tongwei are scaling HJT capacity rapidly. The HJT cost premium over TOPCon, currently 7 to 12%, is projected to narrow to 2 to 5% by 2028. Once that gap closes, HJT becomes the default choice for hot climates and high-albedo sites. Field-measured HJT degradation should standardize at 0.25%/yr with POE encapsulant adoption industrywide.
Back-Contact and Tandem Cells
Back-contact TOPCon (BC-TOPCon) and back-contact HJT (BC-HJT) are the next generation. By moving all electrical contacts to the rear side, these designs eliminate front-side ribbon shading and push module efficiencies toward 25 to 26%. Aiko Solar, LONGi, and Tongwei have commercial BC offerings as of 2026. Field data on BC modules is still limited to 2 to 3 years.
Perovskite-on-silicon tandem cells are the longer-term frontier. Lab efficiencies exceed 33%. Commercial deployment at scale is unlikely before 2028 to 2030, and field durability remains an open question. For procurement decisions in 2026, tandems are not yet a real option.
What This Means for 2026 Procurement
For projects starting construction in 2026 to 2027, the safe bet is bifacial TOPCon glass-glass from a PVEL Top Performer. The yield, LCOE, and bankability case is settled. HJT is the right choice for hot, high-albedo, or weight-constrained projects. PERC has narrowed to a residential and repowering niche.
Procurement teams should also start tracking BC-TOPCon and BC-HJT availability for 2027 to 2028 deployments. The 5 to 8% efficiency gain over standard TOPCon could materially improve LCOE on land-constrained projects.
Conclusion: Three Action Items for 2026 Module Procurement
After analyzing five years of field data from operating plants, peer-reviewed studies, and industry reliability scorecards, the verdict is clear. Here is what to do:
- Default to bifacial TOPCon glass-glass for utility-scale projects in 2026. It delivers the lowest LCOE in most climates, the best supply availability, and bankable 25-year warranties. Demand PVEL Top Performer status and a specific UVID-stable BOM.
- Consider HJT for hot climates above 1500 hours/year of operation above 50°C cell temperature. The temperature coefficient and bifacial advantages compound enough to justify the 12 to 18% price premium. Insist on POE encapsulant and verified edge-seal moisture resistance.
- Stick with PERC only for cost-sensitive residential, weight-constrained rooftops, repowering of existing PERC plants, and cold-climate projects where the temperature advantage of N-type cells is small. Do not use PERC for new utility-scale projects in moderate or hot climates — TOPCon now wins on LCOE.
Frequently Asked Questions
What is the real measured degradation rate of PERC vs TOPCon vs HJT after 5 years in the field?
Manufacturer warranties suggest 0.55%/yr for PERC, 0.40%/yr for TOPCon, and 0.25 to 0.30%/yr for HJT. Independent 2025 field data largely confirms this for moderate climates, but the Qatar desert study showed HJT degrading 6.5 to 8.7% in just three years due to encapsulant failure. Real-world performance depends as much on BOM quality as on cell technology.
Does TOPCon really beat PERC in hot climates like India or Spain?
Yes. The CEA/PV Magazine relative yield test showed bifacial N-TOPCon delivering 13.4% more kWh/kWp than monocrystalline PERC. In hot conditions above 45°C cell temperature, TOPCon’s -0.30%/°C coefficient saves roughly 0.7% per degree compared to PERC’s -0.35%/°C, adding up to 3 to 5% extra annual yield in Rajasthan, Andalusia, or Arizona.
Why do some PERC plants still outperform TOPCon plants in field data?
Three reasons. First, older PERC modules from premium manufacturers used heavier glass, better encapsulants, and stricter QA than budget TOPCon lines. Second, PERC stabilizes faster after first-year LID and then degrades slowly. Third, in dry, low-UV, and low-humidity climates the bifacial and temperature advantages of N-type cells matter less, so the cost difference rarely pays back.
Is HJT really the most durable PV technology long term?
On paper, yes. HJT has near-zero LID, the lowest temperature coefficient, and the highest bifaciality. The Panasonic HIT 25-year field record supports 0.25%/yr in Japan and Germany. However, 2025 Kiwa PVEL data and the Qatar study show HJT is the most moisture-sensitive of the three, and edge-seal or TCO failures can cause early-life losses well above warranty assumptions.
Which technology gives the lowest LCOE in 2026?
For most utility projects on tracker mounts in moderate or hot climates, bifacial TOPCon now offers the lowest LCOE. Fraunhofer ISE modeling shows TOPCon achieves slightly lower LCOE than bifacial PERC even at 3 to 5% higher module cost. HJT can beat TOPCon on LCOE only in very hot or high-albedo sites, or where rooftop weight limits favor lighter glass-glass HJT modules.
Should I still buy PERC modules in 2026?
Only for cost-constrained residential or small commercial projects where the 1 to 3 cent/W price gap matters more than 25-year yield. For utility-scale, commercial, or any tracker-mounted bifacial project, TOPCon is now the default. HJT makes sense for premium residential, agrivoltaics, vertical PV, and very hot deserts where its temperature and bifacial advantages compound. Read Agrivoltaics Design for a complete walkthrough.
What field data should I demand from module suppliers before signing a 100 MW PPA?
Ask for independent PVEL Top Performer status, IEC 61215 plus extended UV preconditioning (UVID), IEC 62804 PID resistance under negative voltage at 1500 V system, damp heat results beyond 2000 hours, and at least 24 months of operating data from a similar climate. Bankability now depends on BOM transparency, not the cell technology label.
How does TOPCon UVID compare to PERC LID — are they the same problem?
No. PERC LID is a permanent boron-oxygen complex defect in the silicon bulk that stabilizes after 200 to 500 hours of operation, costing 1.5 to 2.5%. TOPCon UVID is a surface passivation degradation from UV photons damaging the polysilicon layer, and it continues throughout module life. PVEL data shows TOPCon UVID ranging from 0.6% to 16.6% with a 3.1% median. UVID-stable TOPCon BOMs use UV-cutting EVA or POE encapsulants.
Are bifacial gains in field data really as high as the marketing claims?
Field-measured bifacial gain is typically lower than marketing claims, but the relative ranking holds. PVEL 2025 averages: PERC 68.7%, TOPCon 76.3%, HJT 85.5%. In actual energy yield terms, on tracker-mounted utility plants with bare soil albedo (0.20 to 0.25), bifacial gains are usually 5 to 10% for PERC, 8 to 12% for TOPCon, and 10 to 15% for HJT. High-albedo or vertical applications can push these higher.
How long does it take to recover the HJT price premium over TOPCon?
In Phoenix-class hot continental climates, HJT pays back the price premium over TOPCon in 4 to 7 years at typical PPA prices. In moderate climates like Germany or northern France, payback extends to 9 to 15 years. In cold climates like Scandinavia, the HJT temperature advantage is too small to justify the premium, and TOPCon usually wins on LCOE. Also see: France solar feed-in tariffs.
Will perovskite tandems replace TOPCon and HJT before 2030?
Probably not at utility scale. Lab efficiencies for perovskite-silicon tandems exceed 33%, and Oxford PV and LONGi have commercial pilot lines. But long-term durability of perovskite layers in field conditions remains unproven — current commercial tandems carry 10 to 15-year warranties, not 25-year. By 2028 to 2030, tandems may begin to take share in premium residential and commercial markets. For utility procurement decisions before 2030, plan around TOPCon and HJT.


