

A 5 MW commercial rooftop project wins board approval on a $6.2 million P50 budget. Six months later, the EPC contract comes in higher, the interconnection upgrade costs more than expected, and the lender asks for a P90 sensitivity. The project now needs $7.4 million to close. The board is surprised. The finance team is not.
This is the P50 trap. A P50 cost estimate is the median — the number with a 50/50 chance of being enough. It is a useful planning figure, but it is not a safe budget for a financed project. Solar developers and EPCs who confuse P50 with a funding ceiling create the conditions for cost overruns, broken covenants, and missed returns.
In this guide, you will learn:
- What P50 and P90 mean for cost estimates, not just energy yield
- How probabilistic cost estimates are built from base estimates and contingencies
- Why lenders use P90 for debt sizing and contingency reserves
- How P50/P90 applies to both CAPEX and revenue in solar finance
- Common mistakes in using P50 and P90, and how to avoid them
- A worked example for a commercial solar project
Quick Answer
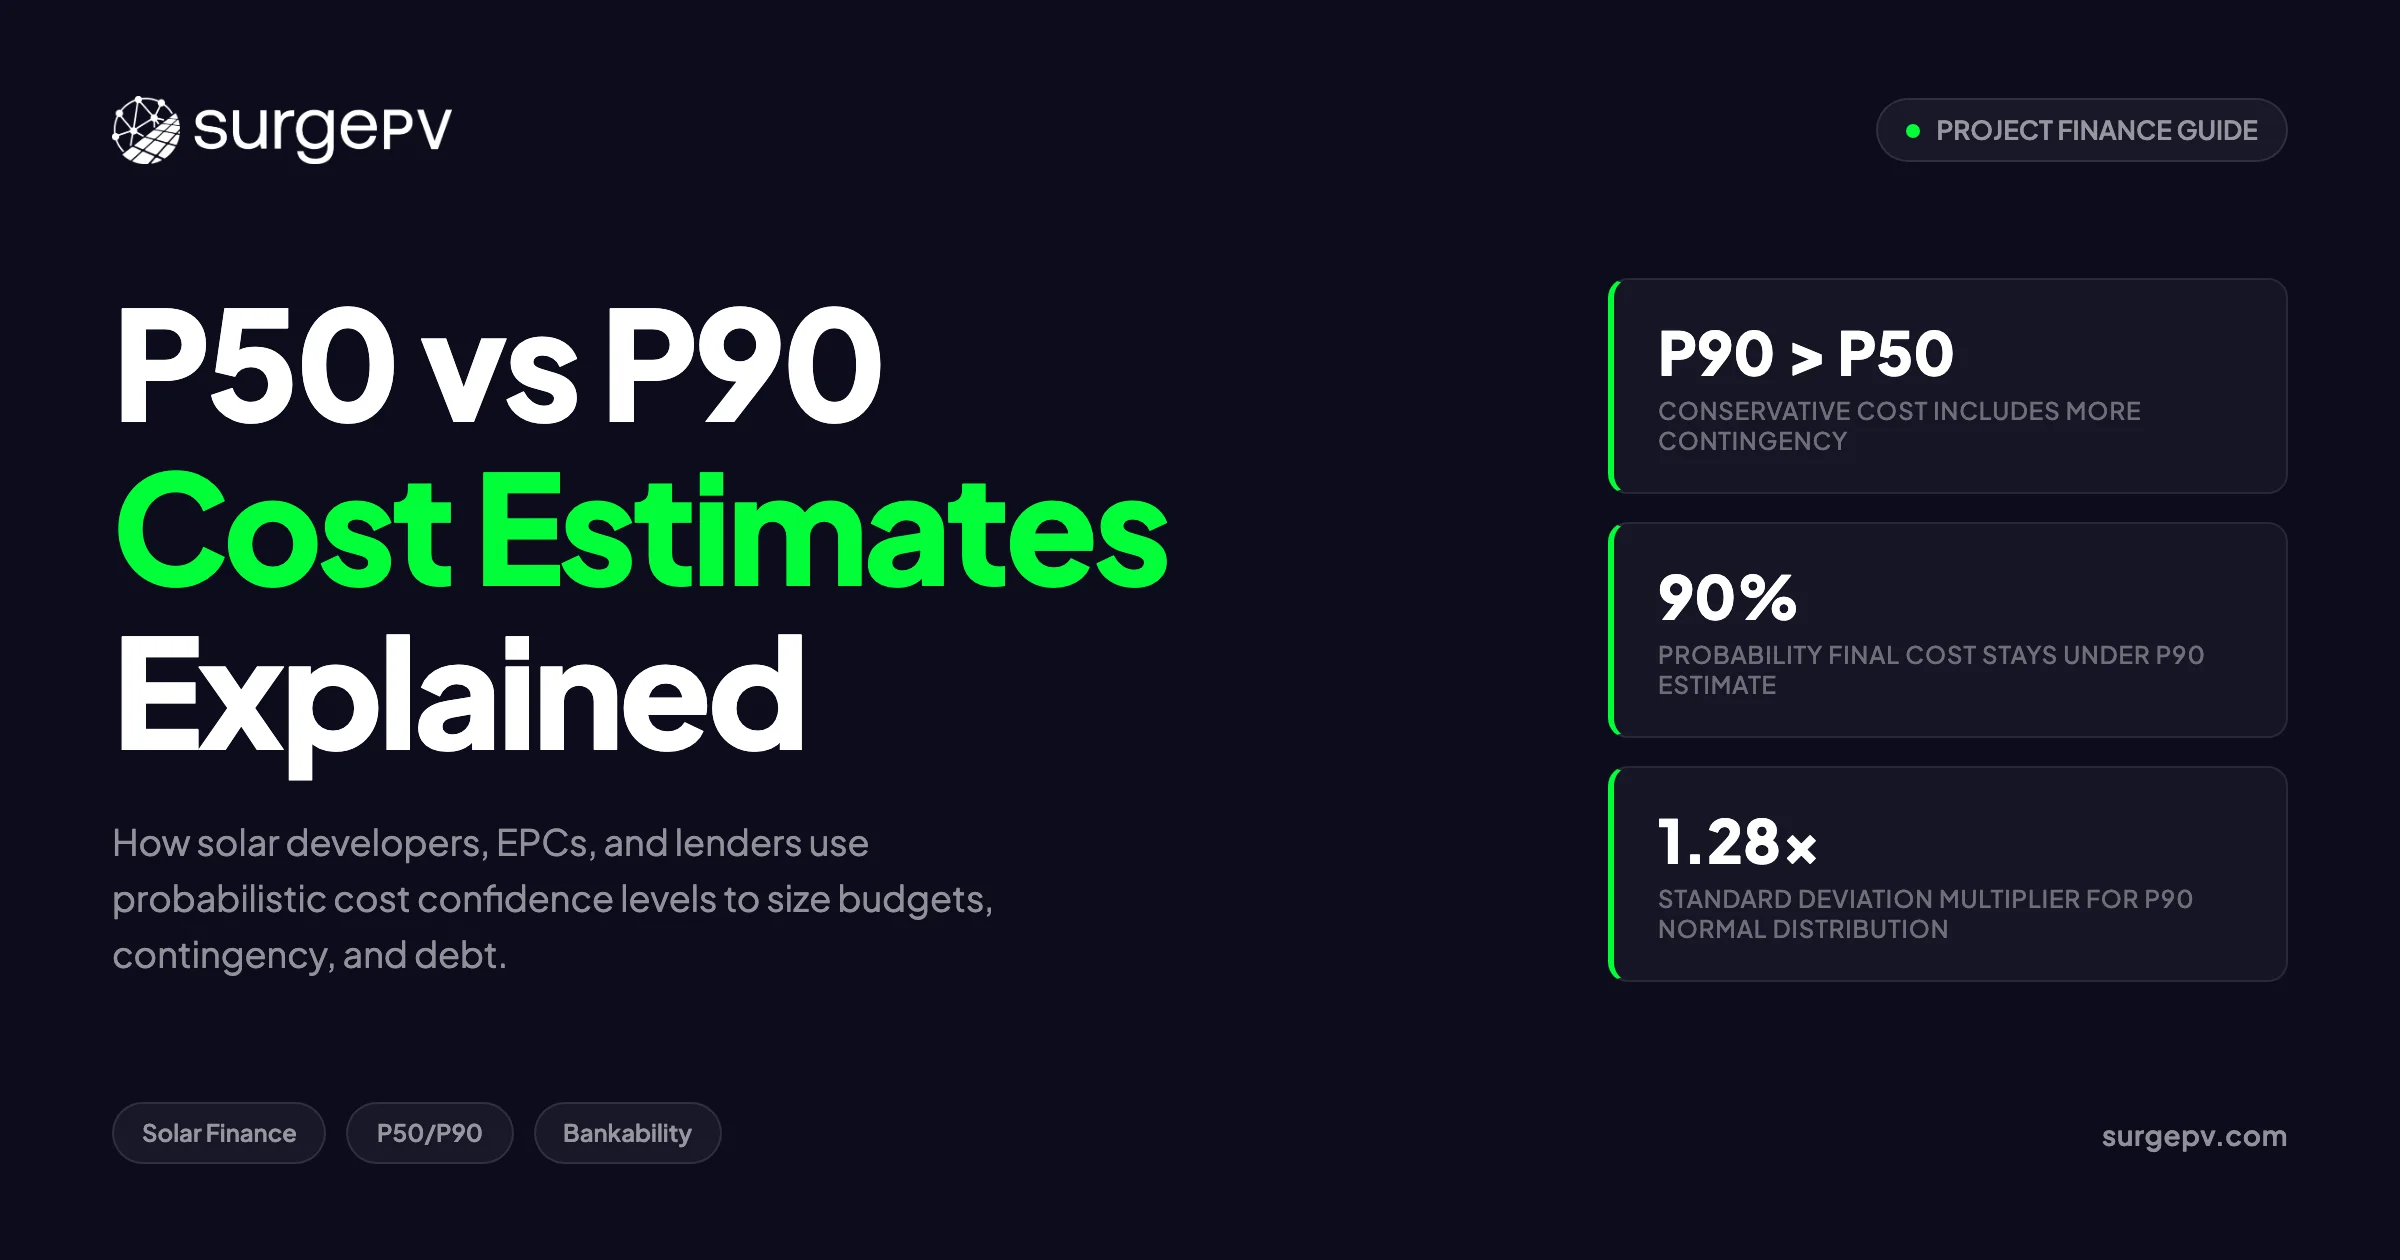
P50 and P90 are confidence levels for cost estimates. P50 means there is a 50% chance the final cost will be at or below the estimate. P90 means there is a 90% chance. P90 is the conservative figure lenders and risk managers use to size contingency and debt.
What P50 and P90 Mean for Cost Estimates
P50 and P90 come from probabilistic estimation. Instead of producing one deterministic number, the estimator models ranges of uncertainty and reads percentiles from the resulting distribution. The same logic applies to energy yield estimates, where P50 is median production and P90 is the conservative floor.
P50 cost estimate is the median. Half of simulated outcomes fall below it, and half fall above it. It represents the expected outcome if the project is repeated many times under the same conditions. For internal planning and investor presentations, P50 is the base case.
P90 cost estimate is the conservative percentile. In 90% of simulated outcomes, the final cost is at or below this number. Only 10% of outcomes are worse. P90 includes more contingency and is the figure typically used for funding approval, lender covenants, and board risk reporting.
The gap between P50 and P90 is not a fudge factor. It reflects real uncertainty: commodity price volatility, geotechnical conditions, permitting delays, labor availability, equipment lead times, and scope changes. The wider the gap, the more uncertainty the project carries.
Pro Tip
Treat P50 as the expected cost and P90 as the funding limit. If you only have one number in front of the board, make it P90. P50 is for internal target-setting, not for committed budgets.
How P50/P90 Cost Estimates Are Built
The standard method is Monte Carlo simulation. Each cost element is assigned a probability distribution — usually a triangular or beta distribution based on minimum, most likely, and maximum values. The model runs thousands of iterations and produces an S-curve of possible total costs.
The steps are:
- Break down the cost estimate into line items: modules, inverters, racking, labor, EPC management, interconnection, civil works, permitting, and contingency.
- Assign uncertainty ranges to each item. Modules may have a narrow range if prices are locked. Civil works may have a wide range if geotechnical data is limited.
- Run Monte Carlo simulation for 5,000 to 10,000 iterations, sampling from each distribution.
- Read the percentiles from the output curve. P50 is the median. P90 is the 90th percentile.
- Add escalation if the estimate is in nominal dollars for a future out-turn date.
For projects where full simulation is not practical, a simplified approach uses the normal distribution approximation:
P90 ≈ Mean + (1.28 × Standard Deviation)The multiplier 1.28 corresponds to the 90th percentile of a standard normal distribution. If total cost uncertainty is 8%, the P90 cost is roughly 10.2% above the mean.
The Australian Government’s Department of Infrastructure, Transport, Regional Development, Communications and the Arts (DITRDCA) provides a worked example: a $100 million base estimate becomes a $115 million P50 project estimate and a $140 million P90 project estimate. After applying 2.5% escalation, the P50 out-turn cost is $124.33 million and the P90 out-turn cost is $151.36 million, according to the Commonwealth Cost Estimation Guidance.
For Commonwealth-funded projects above $25 million in anticipated out-turn cost, probabilistic estimation with Monte Carlo simulation is mandatory. Below that threshold, deterministic approximations are permitted but probabilistic methods are still recommended where practical.
P50 vs P90 in Solar: CAPEX and Energy Yield
Solar projects face two distinct P50/P90 applications: cost and energy yield. Both matter to project finance, but they move in opposite directions.
CAPEX P50/P90 estimates the total cost to build the project. P90 is higher than P50 because it includes upside cost risk.
Energy yield P50/P90 estimates annual production. P90 is lower than P50 because it reflects downside production risk from weather variability, modeling uncertainty, and equipment performance.
A lender looks at both. Higher CAPEX P90 means more capital is needed. Lower energy yield P90 means less revenue is available to service debt. The combination determines whether the project is bankable.
| Application | P50 Meaning | P90 Meaning | Direction |
|---|---|---|---|
| CAPEX | Median construction cost | Conservative construction cost | P90 > P50 |
| Energy yield | Median annual production | Conservative annual production | P90 < P50 |
| Revenue | Expected annual revenue | Conservative annual revenue | P90 < P50 |
This dual application is why solar financial models run separate scenarios. The equity investor usually focuses on P50 production and P50 cost to calculate expected IRR. The lender focuses on P90 production and P90 cost to calculate debt service coverage ratio (DSCR).
A solar design platform that models both energy yield uncertainty and project cost ranges in the same workspace makes this analysis far easier than passing spreadsheets between teams. For community-scale projects, the same principle applies: see how community solar design handles P50/P90 yield modeling for lender bankability.
Why Lenders Care More About P90 Than P50
Project finance is non-recourse or limited-recourse lending. The lender’s repayment depends on project cash flows, not the sponsor’s balance sheet. If costs overrun or production underperforms, the lender is exposed. A strong solar proposal makes this risk explicit by showing both P50 and P90 scenarios side by side.
P90 gives the lender a buffer. By sizing debt to P90 revenue and requiring contingency reserves based on P90 cost, the lender creates a margin of safety. The project can still service debt even if costs are high and the sun year is poor.
Key lender metrics tied to P90 include:
- Debt service coverage ratio (DSCR): Typically calculated using P90 revenue divided by annual debt service. Most lenders require a minimum DSCR of 1.20x to 1.35x at P90.
- Debt sizing: The maximum loan amount is often set so that P90 revenue covers debt payments with the required DSCR.
- Contingency release: Some lenders hold P90 contingency in reserve and release it only when demonstrated need arises, similar to the Commonwealth’s approach to P90 funding.
A wide P50/P90 spread signals high uncertainty. That uncertainty translates directly into higher cost of capital, lower leverage, or additional sponsor equity. Tightening the spread with better data, firmer contracts, and on-site measurements improves bankability. PV shade analysis is one of the most effective ways to reduce yield uncertainty on complex sites.
Common Mistakes and How to Avoid Them
Mistake 1: Presenting P50 as the committed budget
A P50 estimate has a 50% chance of being exceeded. Using it as a fixed budget means the project is underfunded half the time. For financed projects, the committed budget should be P90 or include a separate contingency that bridges P50 to P90.
Mistake 2: Ignoring correlation between cost risks
Monte Carlo models often treat cost items as independent. In reality, risks correlate. A delay in permitting can increase labor costs, extend equipment storage, and push work into worse weather. Build correlation assumptions into the model or the P90 will be too optimistic.
Mistake 3: Confusing energy yield P90 with cost P90
New project finance analysts sometimes add the two together or treat them as interchangeable. They are separate distributions. Energy yield P90 affects revenue. Cost P90 affects CAPEX. Both flow into the same financial model, but they should not be mixed in the same calculation.
Mistake 4: Using outdated escalation assumptions
A base estimate in 2026 dollars is not the same as an out-turn cost in 2028 dollars. Escalation must be applied before reading P50 and P90 percentiles, or the funding request will fall short.
Mistake 5: Forgetting soft costs and owner costs
EPC contracts, legal fees, development costs, insurance, and financing fees are often excluded from early estimates. These can add 10–20% to the base EPC number. A P50 cost estimate that omits them is not really P50.
Practical Guidance: When to Use Which P-Value
Different stakeholders need different confidence levels.
Use P50 when:
- Setting internal targets and expected-case IRR
- Reporting to equity investors who understand probabilistic estimates
- Comparing projects on an expected-return basis
- Building management dashboards and KPIs
Use P90 when:
- Submitting funding requests to lenders or government agencies
- Setting board-approved project budgets
- Calculating contingency reserves
- Writing fixed-price EPC contracts with limited change-order flexibility
- Reporting to risk-averse owners or public-sector clients
Use P75 or P80 when:
- A middle ground is needed between optimism and conservatism
- European project finance conventions apply
- Contingency sizing follows AACEI or similar industry guidelines
For solar developers, the rule is simple: P50 is for the pitch deck, P90 is for the term sheet.
P50/P90 Across the Solar Project Lifecycle
The relevance of P50 and P90 changes as the project moves from early development to operation.
Development and pre-feasibility
At this stage, cost estimates are based on limited information. Geotechnical studies may not be complete, interconnection capacity is assumed, and equipment pricing is indicative. The P50/P90 gap is wide — often 20–30% or more. P50 is useful for screening and go/no-go decisions. P90 is too uncertain to be a reliable budget, but it signals the funding range the sponsor should prepare for.
Final investment decision (FID)
By FID, major contracts are in negotiation and technical studies are complete. The P50/P90 gap narrows, typically to 10–15%. This is when lenders commit and the board approves a P90 budget. Contingency is sized to bridge the gap between the expected cost and the conservative cost.
Construction
During construction, the focus shifts from probabilistic estimates to actual costs and contingency drawdown. A well-structured project releases P90 contingency only against demonstrated need. If the project finishes below P90, the remaining contingency returns to equity or reduces debt.
Operations
In operations, P50 and P90 apply to energy production and revenue, not cost. Actual production is compared to the P50 estimate to judge performance. Debt service is tested against P90 production to ensure coverage in poor weather years.
| Stage | P50 Use | P90 Use | Typical Gap |
|---|---|---|---|
| Pre-feasibility | Screening returns | Funding range indicator | 20–30% |
| Development | Expected budget | Lender/board budget | 10–20% |
| FID | Base-case IRR | Committed budget and contingency | 7–15% |
| Construction | Target cost | Contingency reserve cap | Narrows as costs firm |
| Operations | Expected production | Debt service floor | 8–15% |
How Contingency Links P50 and P90
Contingency is the bridge between P50 and P90. It is not a slush fund for scope growth. It is a calculated reserve for identified risks that have not yet been priced precisely.
There are two common ways to set contingency:
Deterministic contingency
The estimator reviews each risk and assigns a specific dollar amount. For example, geotechnical uncertainty might add $50,000, and interconnection upgrade risk might add $100,000. The sum becomes the contingency. This method is transparent but can underestimate combined risk if risks interact.
Probabilistic contingency
The Monte Carlo model calculates the contingency needed to reach a target percentile. If the P50 cost is $5.15 million and the P90 cost is $5.80 million, the probabilistic contingency to reach P90 is $650,000. This method captures the combined effect of multiple risks and correlations.
The Australian DITRDCA guidance uses a hybrid approach. It requires probabilistic estimation for large projects but allows deterministic approximations for smaller ones. The key is to document the method and the assumptions behind each uncertainty range.
A common error is to set contingency as a flat percentage of the base estimate, such as 10%. This ignores the actual risk profile. A project with fixed-price equipment and a simple site needs less contingency than a project with custom civil works and uncertain permitting.
Communicating P50 and P90 to Non-Technical Stakeholders
Board members, homeowners, and procurement officers often interpret a single number as a guarantee. Probabilistic estimates require explanation.
Use plain language:
- “The P50 cost of $5.15 million is our best estimate. There is a 50/50 chance the final cost will be higher or lower.”
- “The P90 cost of $5.80 million is our conservative budget. We expect the final cost to come in at or below this number 90% of the time.”
- “The $650,000 between P50 and P90 is contingency for risks we can identify but not yet price exactly.”
Avoid statistical jargon in customer-facing materials. Present a range instead of percentiles when possible. For example: “We expect the project to cost between $5.15 million and $5.80 million, with $5.15 million as the most likely outcome.”
For internal finance teams, show the S-curve or a table of percentiles. This makes the distribution visible and supports informed decisions about risk appetite.
Worked Example: 5 MW Commercial Solar Project
Consider a 5 MW commercial rooftop project in the southwestern United States.
Base estimate: $5,000,000
Cost uncertainty breakdown:
| Cost Item | Base Cost | Uncertainty Range | Risk Level |
|---|---|---|---|
| Modules | $1,500,000 | ±5% | Low |
| Inverters | $600,000 | ±7% | Low-Medium |
| Racking and BOS | $900,000 | ±10% | Medium |
| Labor | $800,000 | ±12% | Medium |
| Civil and structural | $400,000 | ±20% | High |
| Interconnection | $350,000 | ±18% | High |
| Permitting and soft costs | $250,000 | ±15% | Medium |
| EPC management | $200,000 | ±10% | Medium |
After running a Monte Carlo simulation, the project team reads the following percentiles:
| Percentile | Total Cost | vs Base |
|---|---|---|
| P10 | $4,650,000 | -7.0% |
| P50 | $5,150,000 | +3.0% |
| P75 | $5,450,000 | +9.0% |
| P90 | $5,800,000 | +16.0% |
| P99 | $6,350,000 | +27.0% |
The P50 is $5.15 million. The P90 is $5.80 million. The $650,000 gap represents the contingency needed for a 90% confidence budget.
Now apply energy yield. The project models P50 production at 9,200 MWh/year and P90 production at 8,050 MWh/year, reflecting 8.5% combined uncertainty. At a power purchase agreement price of $0.08/kWh:
- P50 revenue: $736,000/year
- P90 revenue: $644,000/year
If annual debt service is $520,000:
- DSCR at P50: 1.42x
- DSCR at P90: 1.24x
The P90 DSCR of 1.24x is within most lender thresholds. If the project had used P50 cost and P50 revenue together, the apparent DSCR would be 1.42x and the project might have been over-leveraged. Using P90 for both sides of the ledger gives a more realistic view of financed risk.
Sensitivity check: What if the P90 cost rises to $6.0 million because of steel tariff uncertainty, while revenue stays at P90? The equity contribution must increase by $200,000, or the debt amount must fall. This is why lenders require sensitivity analysis alongside base-case P50/P90 numbers.
Takeaway: The worked example shows that a project can look attractive at P50 and still be risky at P90. The P90 view is the one that determines whether the project closes.
Model P50 and P90 in One Workspace
SurgePV’s generation and financial tool links energy yield uncertainty directly to project financials, so you can run P50 and P90 scenarios without switching tools.
Book a DemoNo commitment required · 20 minutes · Live project walkthrough
How P50/P90 Cost Estimates Affect Project Returns
The choice of percentile changes the return profile. Equity investors care about expected returns, but they also care about downside cases. A project with a high P50 IRR but a thin P90 DSCR is riskier than one with a lower P50 IRR but a strong P90 DSCR.
Consider two 5 MW projects with the same P50 IRR of 12%:
| Project | P50 IRR | P90 DSCR | P90 Cost / P50 Cost | Assessment |
|---|---|---|---|---|
| Project A | 12% | 1.15x | 1.22 | High risk; thin lender buffer |
| Project B | 12% | 1.30x | 1.12 | Lower risk; stronger lender buffer |
Project B is more bankable because its P90 metrics are stronger, even though both projects have the same expected return. Lenders will offer better terms on Project B, which improves the equity IRR after financing.
This is why experienced developers do not optimize only for P50. They optimize for the spread between P50 and P90. Reducing uncertainty — through better site data, fixed-price contracts, and proven equipment — is often more valuable than pushing the P50 return higher.
P50/P90 in Proposals and RFPs
When responding to a commercial RFP, be explicit about which percentile each number represents. A proposal that says “estimated cost: $5.15 million” without stating P50 or P90 creates confusion. The procurement committee may assume it is a fixed price, while the developer intended it as an expected value.
Best practice for proposals:
- State the base estimate, P50 estimate, and P90 estimate separately
- Explain the contingency methodology
- Show how P90 cost affects financing and DSCR
- Include sensitivity tables for key variables
- Reference independent engineering or third-party validation where available
For more on commercial RFP strategy, see our guide on closing commercial solar deals with procurement committees.
Tools and Standards for P50/P90 Cost Estimation
Several tools and standards support probabilistic cost estimation:
- @RISK and Crystal Ball: Excel add-ins for Monte Carlo simulation
- Safran Risk: Risk analysis software for project schedules and costs
- AACEI Recommended Practice 57R-09: Guidance on cost estimate classification and contingency
- DITRDCA Commonwealth Cost Estimation Guidance: Australian government framework for P50/P90 estimates
- NASA Cost Estimating Handbook: Probabilistic methods for complex projects
For energy yield P50/P90, the leading tools are PVsyst, Solargis, and NREL SAM. These tools model weather variability, equipment uncertainty, and system losses to produce bankable yield reports. Solargis publishes a methodology showing that P90 for a typical PV system can be calculated as mean minus 1.282 times the standard deviation of total uncertainty, with components combined by root-sum-square.
When selecting tools, consider whether the cost and yield models can share inputs. A disconnected cost model and yield model force manual transfers that introduce errors. Integrated platforms reduce this risk.
A modern solar design platform that integrates layout, shading, yield simulation, and financial modeling reduces the handoff errors that often widen the P50/P90 spread.
How to Tighten the P50/P90 Cost Gap
A wide P50/P90 cost gap is not always bad, but it increases the cost of capital and reduces leverage. Developers can narrow the gap by reducing uncertainty before seeking financing.
Lock in major contracts early. Fixed-price module and inverter contracts remove pricing volatility. The earlier these are signed, the narrower the equipment uncertainty range.
Complete site investigations. Geotechnical reports, roof load assessments, and electrical infrastructure surveys reduce civil and interconnection uncertainty. A site with unknown soil conditions can add hundreds of thousands of dollars to the P90 estimate.
Secure permitting milestones. Conditional use permits, interconnection agreements, and building permits should be advanced before FID. Permitting risk is one of the most common reasons for cost overruns in commercial solar.
Use reference class forecasting. Compare the project to similar completed projects. The Grattan Institute found that infrastructure projects using reference class forecasting produced more realistic estimates than those relying on bottom-up models alone, as noted in its report on getting infrastructure megaproject cost estimates right.
Document assumptions transparently. Lenders and independent engineers will test every assumption. A well-documented uncertainty log makes it easier to defend the P90 and can reduce lender-imposed margins.
Frequently Asked Questions
What is the difference between P50 and P90 cost estimates?
P50 is the median cost estimate with a 50% probability the final cost will not exceed it. P90 is a conservative estimate with a 90% probability the final cost will not exceed it. P90 includes more contingency and is used by lenders and risk-averse owners.
Why do solar lenders use P90 instead of P50?
Lenders use P90 because it represents a conservative floor. It gives them confidence that debt service can be covered even when construction costs run high or energy production falls below the median.
How do you calculate P90 from a base cost estimate?
P90 is calculated by adding contingency to the base estimate, often using probabilistic Monte Carlo simulation. For a normal distribution, P90 ≈ mean + 1.28 × standard deviation of total cost uncertainty.
What is a typical P50 to P90 cost gap?
Recent Australian infrastructure business cases show a P50 to P90 cost gap of around 7%, but the gap varies with project maturity and risk. Complex or early-stage solar projects may see gaps of 15–30%.
Should solar proposals use P50 or P90?
Customer-facing proposals usually present P50 as the expected outcome. Financing documents and lender reports should use P90 for debt sizing and contingency planning.
Can P50 and P90 apply to energy yield as well as cost?
Yes. In solar, P50 is median expected annual production and P90 is conservative production exceeded 90% of the time. Lenders size debt against P90 revenue, not P50 revenue.
Where this fits
This article is part of SurgePV's Solar Business & Operations hub, which works through the topic from first principles to the decisions a project team actually has to make.
