Quick Answer
A 6 kW residential array in Madrid generates 9,800 kWh per year facing true south at 30 degrees tilt. Split the same modules into an east-west pair at 12 degrees, and the array produces 8,820 kWh — a 10% drop. Yet the east-west homeowner saves 280 EUR more per year on their electricity bill.
A 6 kW residential array in Madrid generates 9,800 kWh per year facing true south at 30 degrees tilt. Split the same modules into an east-west pair at 12 degrees, and the array produces 8,820 kWh — a 10% drop. Yet the east-west homeowner saves 280 EUR more per year on their electricity bill. The reason: 72% of that energy is consumed inside the home, versus 41% for the south-facing system, and Spain pays only 0.06 EUR per kWh for solar exported back to the grid against 0.28 EUR for grid imports. Lower kWh, higher EUR. Also see: Spain net metering.
A 6 kW residential array in Madrid generates 9,800 kWh per year facing true south at 30 degrees tilt. Split the same modules into an east-west pair at 12 degrees, and the array produces 8,820 kWh — a 10% drop. Yet the east-west homeowner saves 280 EUR more per year on their electricity bill.
This is the calculus behind the rapid shift toward split orientation in residential solar. The old rule — point modules at the equator and tilt to latitude — was written for a world of full-retail net metering and 600 USD per panel hardware. In 2026, with module prices below 0.18 USD per watt, time-of-use tariffs becoming the default in Europe and the US, and feed-in tariffs collapsing in mature markets, the question stopped being “how do I produce the most energy” and became “how do I produce the most valuable energy.” This guide quantifies when an east west solar panel layout wins, when south still rules, and how to model the trade-off inside solar design software and present the financial case in solar proposal software before the racks go on the roof. Also see: European Solar Incentives.
TL;DR — East-West vs South-Facing in One Paragraph
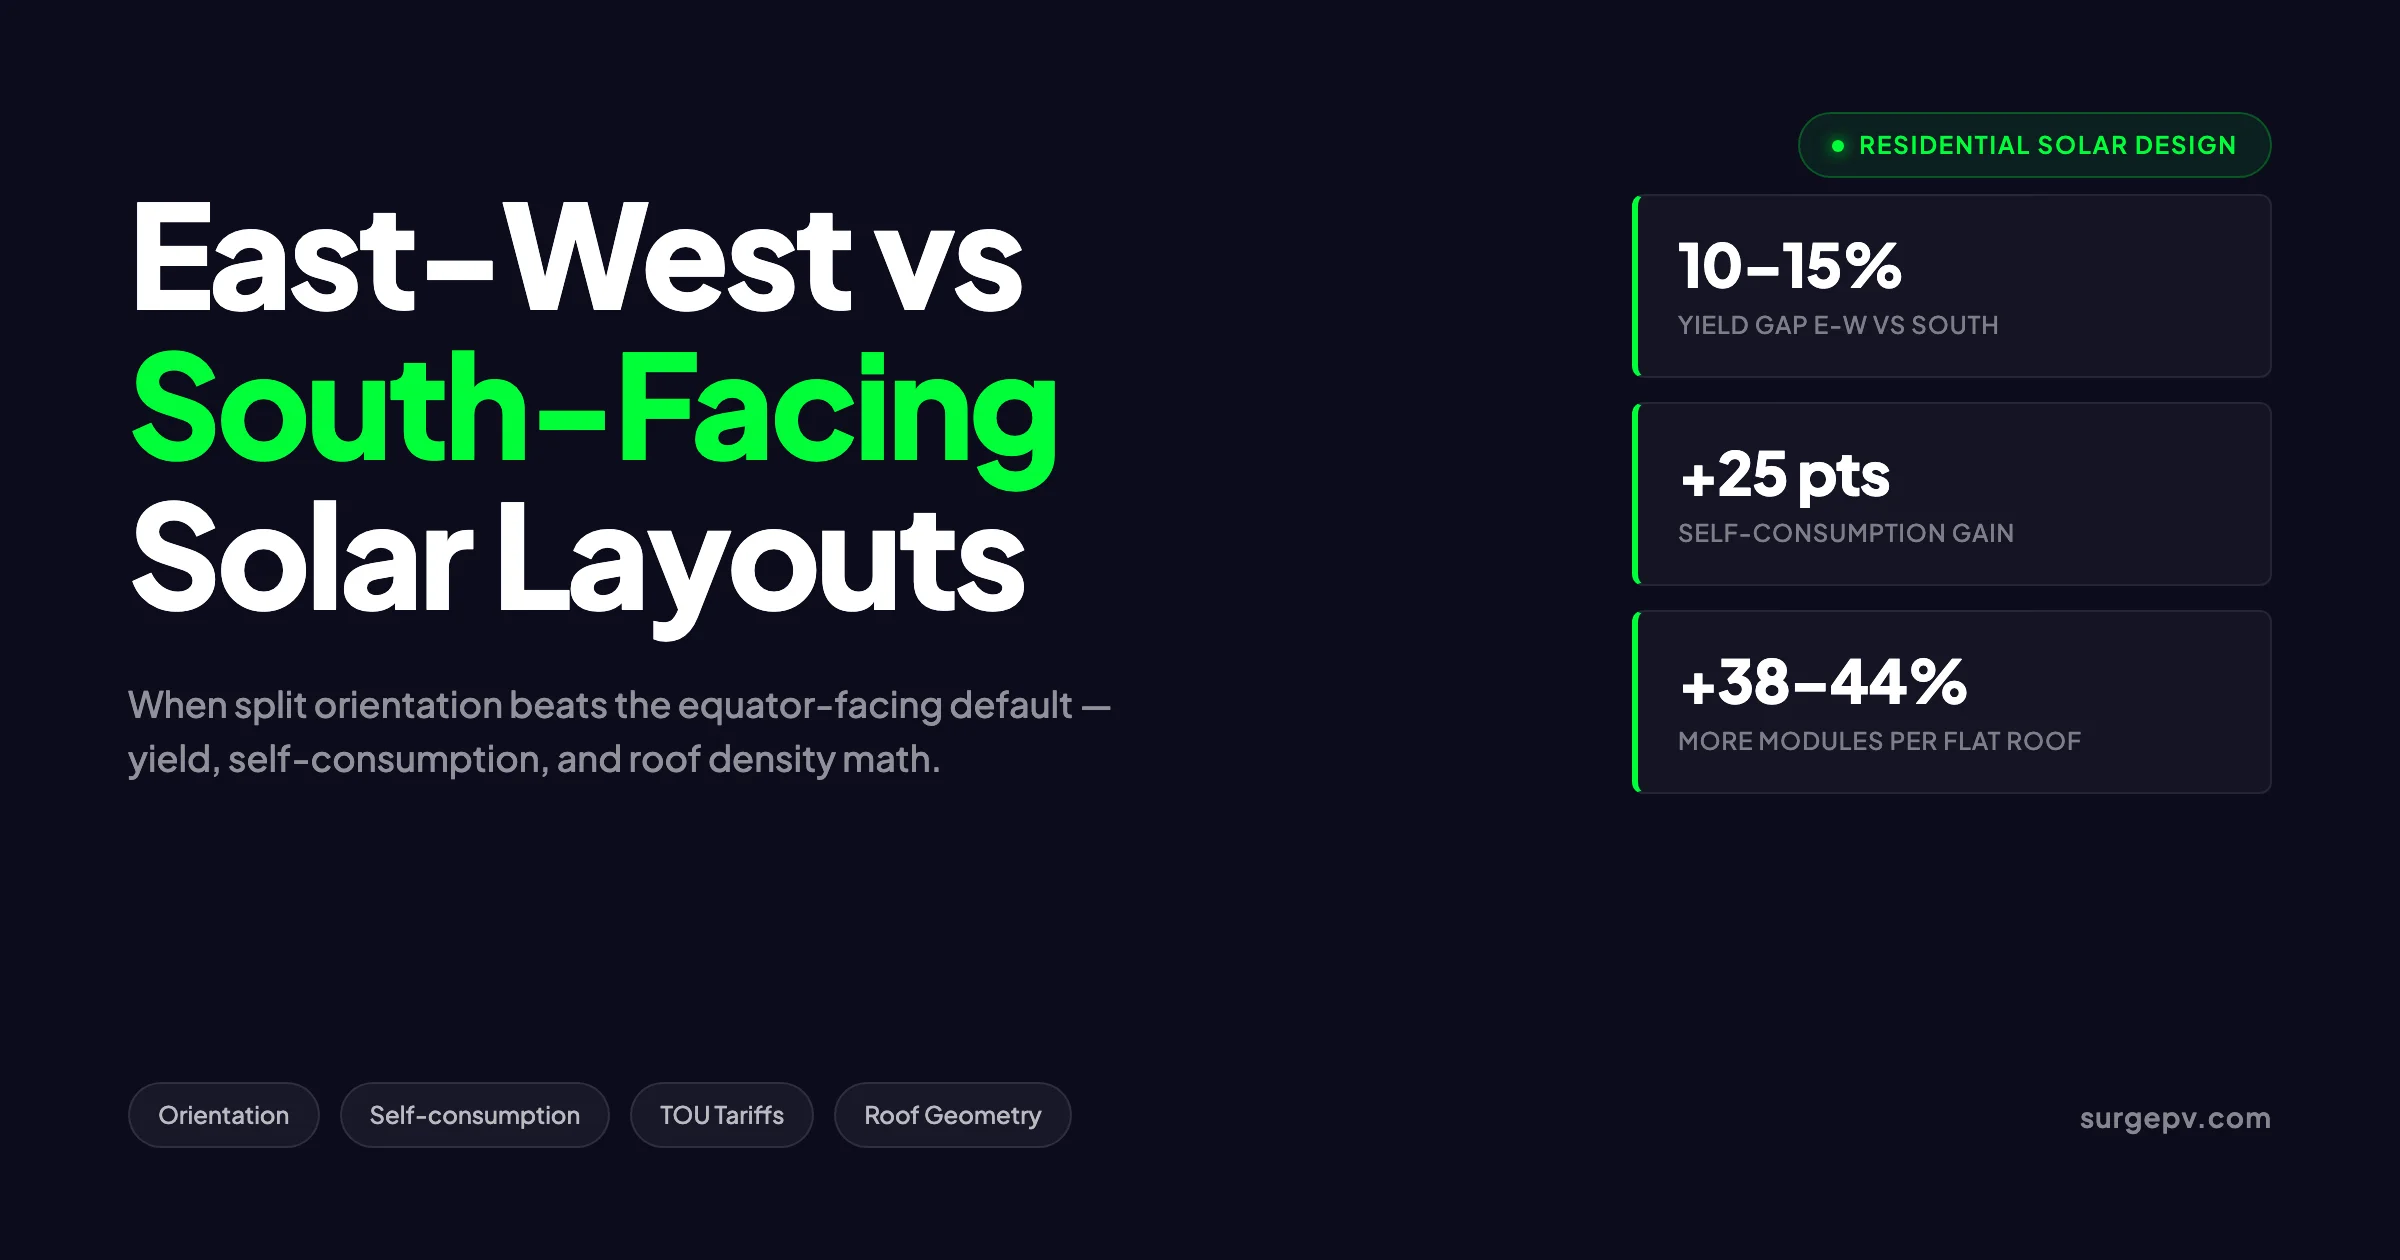
South-facing maximizes total kWh. East-west maximizes self-consumption and roof density. East-west delivers 10 to 15% less annual production but 15 to 25% higher self-consumption, fits 25 to 40% more modules on a flat roof, and earns more revenue under TOU or low feed-in tariff regimes. South-facing wins for full-retail net metering, battery-paired homes, and steep pitched roofs already facing the equator. The decision turns on tariff structure, occupancy pattern, roof geometry, and battery presence — not on a universal “best direction” rule.
In this guide:
- The yield gap between east-west and south-facing across 12 latitudes from 32 to 60 degrees north
- A self-consumption model showing why east-west often wins in EUR per year despite losing in kWh per year
- Roof geometry rules that determine which orientation is even possible
- TOU and feed-in tariff economics that flip the answer in Germany, Spain, the UK, California, and Australia
- The flat-roof density advantage and how to calculate inter-row spacing
- Inverter and stringing rules that prevent mismatch losses on split arrays
- Battery integration and when storage cancels the east-west advantage
- A decision matrix you can apply on any residential project in under 10 minutes Also see: Germany solar subsidies. Read more about Community Solar Projects Germany.
The Yield Gap: How Much Energy You Actually Lose
The generation difference between south-facing and east-west layouts is not a single number. It varies by latitude, tilt angle, module type, and shading environment. The figure below summarizes annual yield as a percentage of an unshaded south-facing optimum (set to 100%) at standard tilts for each orientation.
Annual Production by Orientation and Latitude
| Latitude | Location example | South @ optimal tilt | South @ 30° | East-West @ 12° | East-West @ 30° (pitched) |
|---|---|---|---|---|---|
| 32° N | Phoenix, AZ | 100% | 99% | 88% | 79% |
| 35° N | Los Angeles | 100% | 99% | 89% | 80% |
| 38° N | Madrid, Athens | 100% | 99% | 90% | 81% |
| 40° N | Denver, Naples | 100% | 98% | 89% | 81% |
| 42° N | Rome, Boston | 100% | 98% | 89% | 80% |
| 45° N | Milan, Lyon | 100% | 97% | 88% | 79% |
| 48° N | Munich, Vienna | 100% | 96% | 86% | 77% |
| 50° N | London, Frankfurt | 100% | 95% | 85% | 75% |
| 52° N | Berlin, Amsterdam | 100% | 94% | 84% | 74% |
| 55° N | Copenhagen | 100% | 93% | 82% | 71% |
| 58° N | Edinburgh | 100% | 92% | 80% | 68% |
| 60° N | Oslo, Helsinki | 100% | 90% | 77% | 64% |
Source: Modeled in NREL PVWatts using 2024 TMY3 climate files, 14% system losses, monofacial 21% modules. Cross-checked against JRC PVGIS for European sites. For Europe-specific compliance details, see Europe solar compliance.
Three patterns to read out of this table.
First, the east-west penalty is smaller at low latitudes than at high. In southern Spain or Arizona, an east-west pair at 12 degrees gives up about 10% versus optimal south-facing. In Edinburgh, the same configuration gives up 20%. The reason is geometric: at low latitudes, the sun spends more time near the zenith, where the difference between east, south, and west exposure is minimized. At high latitudes, the sun arcs lower across the southern sky, and east-west modules see far less of it.
Second, the cost of using a 30-degree pitched roof for an east-west layout is significant. A pitched east-west roof loses 9 to 13 percentage points more than a flat-mounted east-west pair at 12 degrees. On a pitched roof in London, you give up 25% of optimal production by going east-west. On a flat roof in London, you give up only 15%. The flat roof case is far more competitive than the pitched roof case.
Third, the south-versus-east-west gap shrinks as tilt rises. At 60 degrees north, a south roof at 30 degrees already loses 10% relative to optimal because it is too shallow. The south configuration’s advantage over east-west is only 13 percentage points (90% vs 77%). At 32 degrees north, the same comparison is 11 points (99% vs 88%). The penalty for non-ideal tilt on south-facing partially absorbs the orientation advantage. See our guide on Agricultural Solar Case Study for more.
What These Numbers Don’t Tell You
Annual kWh is the wrong metric for most residential decisions in 2026. It is the right metric only when:
- The tariff pays full retail for every exported kWh (true full net metering), and
- The household has no time-of-use exposure, and
- Battery storage is not part of the design. For more on this topic, see Adding Battery Storage Services.
That combination still exists in some US states (Massachusetts, New Jersey under legacy NEM 2.0) and a handful of European feed-in tariff carve-outs. Everywhere else, the value of a kWh depends on when it is produced. We address that in the next section.
Self-Consumption: The Real Reason East-West Often Wins
Self-consumption is the share of solar production used inside the home rather than exported to the grid. It is the variable that flips the economics of orientation in most modern tariff structures. The chart below illustrates a typical residential load profile against three array configurations on a clear summer day.
Generation vs. Demand by Hour (Typical Residential, 4-person household)
| Hour | Demand (kW) | South 6 kW (kW) | East-West 6 kW (kW) | South generation > demand |
|---|---|---|---|---|
| 06:00 | 0.5 | 0.2 | 0.8 | No |
| 08:00 | 1.4 | 1.8 | 3.0 | Yes (export 0.4) |
| 10:00 | 0.6 | 4.2 | 4.0 | Yes (export 3.6) |
| 12:00 | 0.5 | 5.5 | 4.4 | Yes (export 5.0) |
| 14:00 | 0.6 | 5.2 | 4.5 | Yes (export 4.6) |
| 16:00 | 0.9 | 3.5 | 4.0 | Yes (export 2.6) |
| 18:00 | 1.8 | 1.5 | 2.8 | South: import 0.3, EW: export 1.0 |
| 20:00 | 2.5 | 0.2 | 0.7 | Both import |
| 22:00 | 1.0 | 0 | 0 | Both import |
Read the rightmost column. The south-facing array spends six hours of the day exporting large surpluses (10:00 to 16:00) while still requiring the household to import from the grid in the evening peak. The east-west system produces less at noon, so its midday surplus is smaller, and crucially it produces meaningfully more at 18:00 — covering more of the evening peak before the household has to draw from the grid.
For this typical household consuming 4,200 kWh per year, the self-consumption rates work out as:
| Configuration | Annual production (kWh) | Self-consumed kWh | Self-consumption % | Exported kWh |
|---|---|---|---|---|
| South 6 kW | 9,000 | 2,700 | 30% | 6,300 |
| East-West 6 kW | 7,830 | 4,300 | 55% | 3,530 |
| South 6 kW + 10 kWh battery | 9,000 | 6,750 | 75% | 2,250 |
| East-West 6 kW + 10 kWh battery | 7,830 | 6,650 | 85% | 1,180 |
The data behind these ratios comes from the Frontiers in Energy Research 29-month Romanian field study published in 2025, which monitored 12 residential systems in three orientations under matched load profiles. The study confirmed a 25 percentage-point self-consumption gain for east-west versus south without storage, narrowing to 10 points with a 10 kWh battery.
Self-Consumption Translates Directly to Bill Savings
For the typical household above on a Spanish PVPC tariff (0.28 EUR/kWh import, 0.06 EUR/kWh export):
| Configuration | Self-consumption EUR | Export revenue EUR | Total EUR/year saved |
|---|---|---|---|
| South 6 kW | 756 | 378 | 1,134 |
| East-West 6 kW | 1,204 | 212 | 1,416 |
| South 6 kW + 10 kWh battery | 1,890 | 135 | 2,025 |
| East-West 6 kW + 10 kWh battery | 1,862 | 71 | 1,933 |
Without a battery, the east-west system saves 25% more EUR per year than the south system, despite producing 13% less energy. With a battery, south recovers a slight edge because storage lets the household shift midday surplus to the evening peak more efficiently, capturing the higher absolute production.
The same logic applies wherever the import-to-export price ratio exceeds 3:1. In the UK Smart Export Guarantee market (0.30 GBP import vs 0.05 to 0.15 GBP export), east-west wins on EUR even more dramatically. In Germany under the post-2024 EEG (0.40 EUR import vs 0.082 EUR export for systems under 10 kWp), east-west’s economics dominate. In California under NEM 3.0, where export credits average 0.07 USD/kWh against 0.40 USD/kWh imports, the same pattern holds.
Pro Tip — The 3:1 Rule
If the ratio of import price to export credit exceeds 3:1, an east-west configuration almost always beats south-facing on annual EUR savings, assuming no battery. If the ratio is below 1.5:1 (true full net metering), south-facing wins on EUR. Between 1.5:1 and 3:1, model both and compare. Battery presence collapses the gap toward south-facing being better.
When South-Facing Still Wins
The case for south-facing is not dead. It is just narrower than it was 10 years ago. South-facing remains the right answer in five specific scenarios.
1. Full-Retail Net Metering Markets
Some US states preserve net metering at full retail rates for systems installed before policy transitions. Massachusetts SMART Tier 1, parts of New York under NEM 2.0, and grandfathered California NEM 1.0 customers all see every exported kWh credited at the same rate they pay for imports. In these tariffs, every kWh is worth the same regardless of when it is produced, and total annual production is the only thing that matters. South-facing wins by 10 to 15%.
2. Battery-Paired Systems With Adequate Storage
A 10 kWh battery on a south-facing 6 kW array typically holds 90 to 95% of the noon surplus for evening discharge. The battery effectively converts midday peak production into evening peak consumption, neutralizing the timing advantage of east-west. The south system’s higher total production then translates directly to more cycles through the battery and more grid offset. Above 12 kWh of storage, south-facing returns to dominance in nearly every tariff structure.
3. Pitched Roofs Already Oriented South
If the existing roof has a south-facing slope at 25 to 40 degrees tilt, you would need an extreme reason to mount panels in any other configuration. The structural anchoring is straightforward, the visual aesthetics are conventional, and the production gain over east-west is at its largest. Even at the worst flat-versus-pitched comparison (London at 50 degrees N), south-facing pitched at 30 degrees outproduces east-west pitched at 30 degrees by 27 percentage points (95% vs 75% of optimal).
4. Off-Grid and Remote Sites
Off-grid systems care about generation during the time of day when the load is largest. If the load is constant or daytime-weighted (water pumping, refrigeration, agricultural cooling), south-facing maximizes useful generation. The export-versus-self-consumption distinction does not apply because there is no grid to export to.
5. Commercial Loads With Midday Peak Demand
Office buildings, schools, retail with daytime air conditioning, and industrial process loads typically peak between 11:00 and 15:00. South-facing aligns generation with consumption better than east-west for these load shapes. The residential evening-peak logic does not apply.
Model Both Layouts on Your Project in Minutes
SurgePV’s design tool runs annual energy production for any orientation and tilt combination on the same roof model. Compare south-facing vs east-west, see self-consumption against the homeowner’s actual load profile, and export the financial comparison directly into the proposal.
Book a DemoNo commitment required · 20 minutes · Live project walkthrough
Roof Geometry: What Your Roof Actually Allows
Before any production model, the roof has to physically allow the orientation choice. Three roof types govern the decision space.
Pitched Roof Facing One Compass Direction
The most common single-family case. The roof has one or two slopes facing in fixed directions determined by the building’s orientation. If the slope faces south, you have one decision: how many modules to install. If the slope faces east or west exclusively, your “east-west” option is actually a single-orientation array, not a true split.
If the building has two slopes facing east and west (a north-south running ridge), this is the classic split-orientation case. The pitch is whatever the architect chose, typically 25 to 35 degrees in residential construction. Both slopes get modules and the system runs as an east-west pair on inclined planes.
Pitched Roof With North-South Ridge
A north-south running ridge produces an east-facing slope and a west-facing slope. This is the geometry that built the European case for east-west solar — much of Germany, the Netherlands, and northern France has dense residential housing oriented along east-west streets, producing roof shapes that are perfect for split orientation. In these cases, south-facing is not even an option without expensive triangular mounting. Also see: France solar feed-in tariffs.
Flat Roof
A flat roof gives the designer free choice of orientation. South-facing tilted at 15 to 30 degrees maximizes per-module production but requires inter-row spacing equal to about 2 to 3 times the panel height to prevent self-shading at low winter sun angles. East-west pairs leaning against each other in A-frame triangles need only the panel width plus a small maintenance gap.
The result on flat roofs:
| Roof size | South @ 25° rows | East-West @ 12° A-frames | EW density advantage |
|---|---|---|---|
| 100 m² | 18 modules (8.1 kWp) | 26 modules (11.7 kWp) | +44% |
| 200 m² | 38 modules (17.1 kWp) | 54 modules (24.3 kWp) | +42% |
| 500 m² | 100 modules (45 kWp) | 138 modules (62.1 kWp) | +38% |
| 1,000 m² | 210 modules (94.5 kWp) | 290 modules (130.5 kWp) | +38% |
Module assumed: 450 W bifacial, 1.13 m × 2.10 m. Source: SurgePV layout calculations cross-checked against RatedPower’s flat-roof case studies. For more on this topic, see Bifacial Solar Panel Design Guide. For a direct comparison, see Arka 360 vs SurgePV.
The 38 to 44% density advantage is the second reason east-west has won market share in commercial flat-roof solar. On a 100,000 sqm warehouse, the choice between south at 25° and east-west at 12° determines whether the installed system is 9 MW or 13 MW. The per-kWh production is lower for east-west, but the total annual production is higher because there are 38% more modules. We cover the math in the commercial flat-roof guide.
Inter-Row Spacing Math for South-Facing Flat Roofs
The minimum spacing between rows for a south-facing tilted layout depends on the lowest sun angle on the winter solstice (December 21 in northern hemisphere). The standard formula for unshaded operation between 9:00 and 15:00 on the solstice:
Row spacing = Panel height × cos(tilt) + Panel height × sin(tilt) / tan(solar elevation at 9:00 on Dec 21)
For a 1.13 m portrait panel tilted at 20 degrees in Berlin (52° N), solar elevation at 9:00 on Dec 21 is about 9 degrees:
- First term: 1.13 × cos(20°) = 1.06 m
- Second term: 1.13 × sin(20°) / tan(9°) = 0.39 / 0.158 = 2.44 m
- Total spacing: 3.50 m per row
For a 12-degree east-west A-frame, no inter-row spacing is required between paired modules — they share a structural ridge. Between A-frame pairs you need only a maintenance walkway of 0.5 to 1.0 m. The density math falls out from this difference.
TOU and Feed-In Tariff Economics
Tariff design is the single most important determinant of orientation economics in 2026. Six tariff structures cover most of the residential market in the developed world, and each shifts the south-versus-east-west balance differently.
Germany — Post-2024 EEG
Feed-in tariff for systems under 10 kWp: 0.082 EUR/kWh fixed for 20 years. Grid import: 0.40 EUR/kWh average. Ratio: 4.9:1. East-west wins decisively for self-consumption-focused homes. South-facing only competes when the system is oversized for the load (above 1.5 kWp per 1,000 kWh of annual demand).
Spain — Compensación Simplificada
Self-consumption tariff. Excess generation is netted against grid imports within the same hour, with monthly true-up at the bilateral price (about 0.06 EUR/kWh in 2025). Grid import: 0.20 to 0.30 EUR/kWh. Ratio: 3.3:1 to 5:1. East-west wins on EUR savings. The Spanish market shifted decisively east-west between 2023 and 2025 as installers learned to model the trade-off.
UK — Smart Export Guarantee (SEG)
SEG offers vary by retailer from 0.05 to 0.30 GBP/kWh export, against 0.30 GBP/kWh import. If the homeowner is on Octopus Outgoing or similar (0.15+ GBP export), the ratio drops below 2:1 and the east-west advantage narrows. On the average SEG tariff (0.075 GBP), the ratio is 4:1 and east-west wins.
California — NEM 3.0 (NBT)
Net Billing Tariff replaced full net metering in April 2023. Export credits average 0.05 to 0.08 USD/kWh during midday hours, rising to 0.40+ USD/kWh during 4 to 9 p.m. peak hours. This tariff shape inverts the conventional east-west case: a west-facing single orientation (not split) actually wins because all production is shifted toward the high-credit evening hours. Pure east-west splits with batteries dominate the 2025 California install mix.
Australia — Time-of-Use Retail
Most Australian retailers offer ToU plans with peak (4 to 9 p.m. or 5 to 10 p.m.), shoulder (7 a.m. to 4 p.m.), and off-peak (overnight) pricing. Feed-in tariffs are 0.04 to 0.10 AUD/kWh. With peak imports at 0.50+ AUD/kWh, the import-to-export ratio runs 5:1 to 10:1. East-west and west-only orientations now make up over 40% of new residential installs in Sydney and Melbourne, per Clean Energy Council 2024 data. For Australia-specific compliance details, see Australia comparisons/lgc-vs-stc.
US Full Net Metering (Legacy)
Where full retail net metering survives, the export and import prices are equal by definition. Ratio: 1:1. South-facing wins by total kWh.
Tariff-to-Orientation Quick Reference
| Tariff structure | Import:Export ratio | Best orientation (no battery) | Best with 10 kWh battery |
|---|---|---|---|
| Full net metering (legacy NEM 1.0/2.0) | 1:1 | South | South |
| German EEG post-2024 | 4.9:1 | East-West | South or East-West |
| Spanish self-consumption | 3 to 5:1 | East-West | South |
| UK SEG (average tariff) | 4:1 | East-West | South or East-West |
| California NEM 3.0 | 5 to 8:1 (avg hours) | West or East-West | West or East-West |
| Australia ToU | 5 to 10:1 | West or East-West | West or East-West |
| TOU with peak >0.40 USD/kWh after 5 p.m. | Variable | West-skewed | West-skewed |
The pattern: when import is much more expensive than export and battery storage is absent, lean east-west or west-only. When import equals export, lean south. The role of generation and financial tool modeling is to compute the actual EUR per year for each option on the specific tariff and load profile, not to apply a heuristic.
The Battery Question
Battery storage changes the economics of orientation more than any other variable. A 10 kWh battery raises self-consumption from 25 to 30% (no battery) up to 70 to 80%, and at that point the timing of generation matters far less because the battery is doing the time-shifting.
Self-Consumption With and Without Battery
| System | No battery | 5 kWh battery | 10 kWh battery | 15 kWh battery |
|---|---|---|---|---|
| South 6 kW | 30% | 50% | 75% | 88% |
| East-West 6 kW | 55% | 70% | 85% | 92% |
| Self-consumption gain (EW vs S) | +25 pts | +20 pts | +10 pts | +4 pts |
Source: Modeled in SurgePV against UK Energy Research Centre 2024 load profile data.
The east-west advantage shrinks from 25 percentage points to 4 as battery size grows from zero to 15 kWh. Above 15 kWh, the orientation choice reverts to “maximize total production” — which means south-facing. The economic break-even depends on battery cost.
Battery Economics in 2026
Installed cost for a 10 kWh LFP residential battery in Europe runs 7,000 to 12,000 EUR including installation. In the US, the same system is 9,000 to 14,000 USD before any state rebates. The battery generates revenue by:
- Storing midday surplus that would have exported at low price for use at high import price
- Time-shifting peak imports off the grid
For the example household above on Spanish tariffs, the south-facing system’s annual savings rise from 1,134 EUR (no battery) to 2,025 EUR (10 kWh battery) — a delta of 891 EUR/year. The east-west system’s savings rise from 1,416 EUR to 1,933 EUR — a delta of only 517 EUR/year. The battery captures more incremental value on a south-facing array because there is more midday surplus to store.
The Battery Reverses the Equation
Without a battery, east-west saves more EUR than south. With a 10 kWh battery, south saves more EUR than east-west. The crossover happens around 6 to 8 kWh of battery capacity for a typical 4-person household with 4,000 kWh annual demand. Below the crossover, design east-west. Above it, design south-facing.
The implication for solar designers: ask the homeowner about battery plans in the discovery call. A “no battery for now, maybe later” answer should bias the design toward south-facing if the future battery exceeds 8 kWh, even if east-west wins for the immediate no-battery case. Retrofitting orientation is more expensive than retrofitting storage. We cover sizing logic in the residential battery storage guide.
Inverter and Stringing Rules for Split Arrays
An east-west design only delivers its theoretical yield if the inverter and stringing topology handle the orientation split correctly. Three rules matter.
Rule 1: Use Two MPPT Inputs (or Microinverters)
A string inverter with two independent maximum power point tracking (MPPT) channels can run an east-facing string and a west-facing string simultaneously without interference. Each MPPT finds its own optimum for the string it controls.
A single-MPPT inverter forced to run east and west modules in the same string causes 8 to 12% mismatch loss. The MPPT is forced to choose an operating point that compromises both orientations, and the lower-producing string drags down the higher-producing one. This is the most common cause of underperforming east-west systems.
Microinverters (Enphase, APsystems, Hoymiles) and DC optimizers (SolarEdge, Tigo) eliminate the issue entirely because each module has its own MPPT.
Rule 2: Match String Voltage Across Orientations
Even with two MPPT channels, the strings on each MPPT must operate within the inverter’s voltage window. Cold-morning conditions on east-facing strings can push voltage above the inverter limit if the string is sized for the warmer west-facing average. Use the coldest expected ambient at the east string’s first operational moment for voltage calculations.
Rule 3: Watch String Length Asymmetry
East and west strings should have similar module counts (within 10%) to avoid current imbalance through shared DC combiners. If the roof geometry forces a 16-module east string and an 8-module west string, run them on separate inputs of the inverter rather than combining.
SurgePV’s solar design software checks all three rules automatically during stringing and flags single-MPPT mismatch before the design moves to procurement.
Inverter Selection Quick Reference
| Inverter type | East-West compatibility | Recommended use |
|---|---|---|
| Single-MPPT string | Poor (8 to 12% loss) | Avoid for split orientation |
| Dual-MPPT string | Excellent | Standard for residential split |
| Triple/Quad-MPPT string | Excellent | Multi-roof or shaded splits |
| Microinverter | Excellent | Heavy shading + complex layouts |
| DC optimizer + string inverter | Excellent | Long strings + module-level monitoring |
Shading Behavior: Why East-West Has a Hidden Advantage
Shading affects east-west and south-facing arrays differently. A south-facing array hit by a chimney shadow at noon loses production during the hour of peak generation — the worst possible time. The same chimney casts shadows east in the morning (away from a west-facing string) and west in the afternoon (away from an east-facing string).
In practice, east-west arrays are more tolerant of mid-roof obstructions because the shadow falls primarily on the section facing away from the sun at that hour. The shaded modules are already producing relatively little at that time of day.
The exception is morning and evening shading from trees, buildings, or hills near the horizon. East-facing modules are vulnerable to morning horizon shading; west-facing modules are vulnerable to evening horizon shading. A site assessment must use proper solar shadow analysis software to model shading at every hour, not just noon, and flag horizon obstructions that disproportionately affect one orientation.
For roofs with significant azimuth-asymmetric shading, microinverters or DC optimizers are mandatory regardless of orientation choice. Module-level power electronics prevent one shaded module from dragging down the rest of the string.
Aesthetic and Permitting Considerations
Engineering trade-offs are not the only inputs. Two practical constraints shape orientation decisions in residential projects.
Visual Symmetry and HOA Rules
Some homeowners associations require array symmetry across the front-facing roof. East-west splits visible from the street can fail aesthetic review even if engineering favors them. Check the local CC&R before designing. In some US jurisdictions, state solar rights laws override HOA aesthetic requirements (California Civil Code 714 is the strongest example), but enforcement is uneven.
Wind Loading on Flat-Roof East-West Mounts
East-west A-frame ballasted systems on flat roofs trap wind under the panels in two directions, depending on prevailing wind. Modern racking systems (K2, IronRidge, Renusol) include aerodynamic deflectors that reduce uplift. Even so, ballasted east-west systems require structural review under ASCE 7-22 in the US or Eurocode EN 1991-1-4 in Europe. Penetrating attachments are required in high-wind zones (basic wind speed above 50 m/s).
Snow Behavior
Low-tilt east-west systems shed snow worse than steeper south-facing arrays. At 12 degrees tilt, snow can sit on the panels for days after a storm. In snow regions, this is a real production penalty — typically 3 to 6% additional annual loss compared to a 30-degree south-facing array. Above the 50th parallel, factor this into the orientation decision. We cover snow behavior in the residential solar system design guide.
Decision Matrix: Which Layout for Which Project
Apply this matrix to any residential project to narrow the orientation choice in under 10 minutes.
| Step | Question | If yes | If no |
|---|---|---|---|
| 1 | Is the roof a flat commercial-style flat? | Consider east-west for density | Skip to step 2 |
| 2 | Does the building have a north-south running ridge? | East-west is natural | South-facing slope is preferred |
| 3 | Does the homeowner have full retail net metering? | South-facing | Skip to step 4 |
| 4 | Will the system include a battery 10 kWh or larger? | Lean south-facing | Skip to step 5 |
| 5 | Is the import-to-export tariff ratio above 3:1? | East-west | Skip to step 6 |
| 6 | Does the household consume mostly evenings (occupants away during day)? | East-west or west-skewed | South-facing |
| 7 | Is there significant horizon shading from trees or buildings on east or west? | Avoid shaded orientation; bias other side | Either works |
| 8 | Does the inverter selection allow two MPPT channels? | East-west feasible | Use microinverters or single orientation |
| 9 | Is the latitude above 55° N or S? | South-facing penalty for east-west grows; bias south | East-west remains competitive |
| 10 | Is the homeowner subject to HOA aesthetic rules? | Verify east-west is permitted | Either works |
In the SurgePV design workflow, this matrix is applied during the discovery phase before the modules are dropped onto the roof model. The output is a recommended orientation with a quantified energy and EUR comparison against the alternative.
Real-World Examples
Example 1: Berlin Townhouse, North-South Ridge
A 165 sqm townhouse in Berlin with east and west pitched roof slopes at 35 degrees. Annual demand 4,800 kWh, residents away during weekday daytime. EEG feed-in tariff 0.082 EUR/kWh, import 0.42 EUR/kWh. No battery initially, planning to add 10 kWh in year 3.
| Configuration | Annual kWh | Self-consumption | Year 1 savings (EUR) | After 10 kWh battery (EUR) |
|---|---|---|---|---|
| East-West 8.1 kWp @ 35° | 6,640 | 58% | 1,724 | 2,180 |
| West-only 6.5 kWp @ 35° | 5,200 | 65% | 1,510 | 1,890 |
Decision: east-west. The roof geometry makes south-facing impossible, and east-west uses the full available area. Battery upgrade in year 3 raises self-consumption to 85%, and the design accommodates this from day one with a dual-MPPT hybrid inverter.
Example 2: Phoenix Single-Family Home, South-Facing Pitched Roof
A 220 sqm Phoenix home with a 25-degree south-facing slope and a 25-degree north-facing slope. Annual demand 14,200 kWh (heavy summer cooling load 11 a.m. to 7 p.m.). NEM 2.0 grandfathered through 2030. No battery planned.
| Configuration | Annual kWh | Self-consumption | Year 1 savings (USD) |
|---|---|---|---|
| South 11 kWp @ 25° | 19,800 | 42% | 2,376 |
| East-West (south + part of north) 11 kWp | 17,820 | 50% | 2,300 |
Decision: south-facing. NEM 2.0 grandfathering eliminates the timing advantage of east-west. Heavy daytime cooling load already self-consumes 42% of south production at noon. Total kWh is the right metric, and south-facing wins by 11%.
Example 3: Madrid Apartment Building Flat Roof, Community Solar
A 480 sqm flat roof on a residential apartment building serving 16 units under Spain’s collective self-consumption framework. Aggregate annual demand 65,000 kWh. Tariff: PVPC self-consumption with 0.06 EUR/kWh excess credit.
| Configuration | Modules | kWp | Annual kWh | Self-consumption | Year 1 savings (EUR) |
|---|---|---|---|---|---|
| South @ 20° | 96 | 43.2 | 65,500 | 75% | 17,820 |
| East-West @ 12° | 138 | 62.1 | 89,800 | 68% | 22,140 |
Decision: east-west. The 44% module density advantage on the flat roof delivers 24,300 more kWh per year, more than offsetting the 7-percentage-point self-consumption drop. We modeled this case in detail in the community solar design guide.
Conclusion: A Three-Question Answer
For 90% of residential projects in 2026, the orientation decision can be made by answering three questions:
- Will the system include a battery 10 kWh or larger? If yes, design south-facing wherever the roof allows. The battery captures the timing arbitrage that east-west previously needed.
- Does the tariff have an import-to-export ratio above 3:1, and no battery is planned? If yes, design east-west or west-skewed to maximize self-consumption.
- Is the roof a flat roof above 200 sqm? If yes, run the density math. East-west at 12 degrees often delivers more total production than south-facing at 25 degrees because 38 to 44% more modules fit, even though per-module yield is lower.
The “south-facing is always best” rule was true when modules were expensive and net metering was full retail. Neither condition holds in 2026, and the orientation decision is now a project-specific economic optimization. Modeling it correctly before installation is the difference between a system that pays back in 7 years and one that pays back in 11. The tools to run that model live inside solar software — not in rules of thumb.
Frequently Asked Questions
Is an east west solar panel layout better than south-facing?
It depends on the tariff. For homes on time-of-use or self-consumption tariffs without batteries, east-west layouts typically improve self-consumption by 15 to 25% and reduce grid imports by around 30%, even though they generate 10 to 15% less total kWh than a south-facing array. For full-export net metering at retail rates, south-facing still wins on annual energy.
How much energy does east-west lose compared to south-facing?
An east-west layout at 10 to 15 degrees tilt produces 10 to 15% less annual energy than the same module count facing true south at optimal tilt. The exact number depends on latitude. At 40 to 45 degrees north (Berlin, New York) the gap is 12 to 15%. At 37 to 42 degrees north (Madrid, Rome) it narrows to 8 to 10%. Above 50 degrees north the gap widens to 15 to 20%. See our guide on Commercial Rooftop Solar Case Study Italy for more.
Why do east-west arrays fit more panels on a flat roof?
South-facing tilted rows on a flat roof need wide inter-row spacing to avoid self-shading at low winter sun angles. East-west pairs lean against each other in A-frame triangles at 10 to 15 degree tilts, with minimal gaps. The same flat roof typically fits 25 to 40% more modules in an east-west pattern than in a south-facing tilted layout.
Does an east-west solar layout match household consumption better?
Yes for most households. Residential demand has two daily peaks, morning (7 to 9 a.m.) and evening (5 to 9 p.m.), with a midday dip while occupants are at work or school. East-facing modules cover the morning peak, west-facing modules cover the early evening peak. South-facing arrays produce maximum power at noon when most homes need it least.
Should I split my array east-west if I have a battery?
With a battery sized at 10 kWh or larger, the self-consumption advantage of east-west narrows because midday surplus from a south-facing system can be stored for evening use. Battery-paired homes should generally maximize total kWh with south-facing. The exception is when roof geometry forces the choice or when you face evening-peak TOU rates above 0.35 USD per kWh.
What tilt angle works best for an east-west solar panel layout?
10 to 15 degrees is the standard for east-west pairs on flat roofs and ground mounts. Lower tilts reduce mutual shading between rows, increase module density, and lower wind uplift. On pitched roofs, the tilt is fixed by the roof geometry and is typically 20 to 35 degrees. East-west pitched roofs at 35 degrees lose more annual energy than flat-mounted east-west pairs at 12 degrees.
Does east-west cause inverter problems?
Modern string inverters with two MPPT inputs handle east and west strings independently with no derating loss. Single-MPPT inverters mixed across orientations cause 8 to 12% string mismatch losses and should be avoided. Microinverters and DC optimizers eliminate the issue entirely. SurgePV’s stringing tool flags single-MPPT mismatch in the design phase.


