Quick Answer
Drone solar inspections with thermal cameras detect hot spots, diode failures, and soiling 10x faster than manual methods. A 100 MW site can be inspected in 2–4 hours versus 2–3 weeks on foot. AI analysis identifies defects with 95%+ accuracy. Cost: $0.001–$0.003/W per inspection.
Hardware-related underperformance surged 214% since 2019, according to Raptor Maps’ 2025 Global Solar Report. In 2024, that gap cost the global solar industry $10 billion in lost revenue. A 10 MW solar farm with a 5% undetected yield leak loses roughly $40,000 every year. For Global-specific compliance details, see Global net-metering-by-country. For Global-specific compliance details, see Global solar-permitting-speed-by-country.
Drone solar inspections with thermal cameras detect hot spots, diode failures, and soiling 10x faster than manual methods. A 100 MW site can be inspected in 2–4 hours versus 2–3 weeks on foot. AI analysis identifies defects with 95%+ accuracy. Cost: $0.001–$0.003/W per inspection.
The culprit is rarely the inverter.
Most faults hide at the panel and string level. They are invisible to solar monitoring systems. Ground crews walking row after row in the sun catch only a fraction of them. The standard practice for decades was to sample 10% to 25% of the array and hope the rest was fine. For the latest details on France, see Agricultural Solar Case Study.
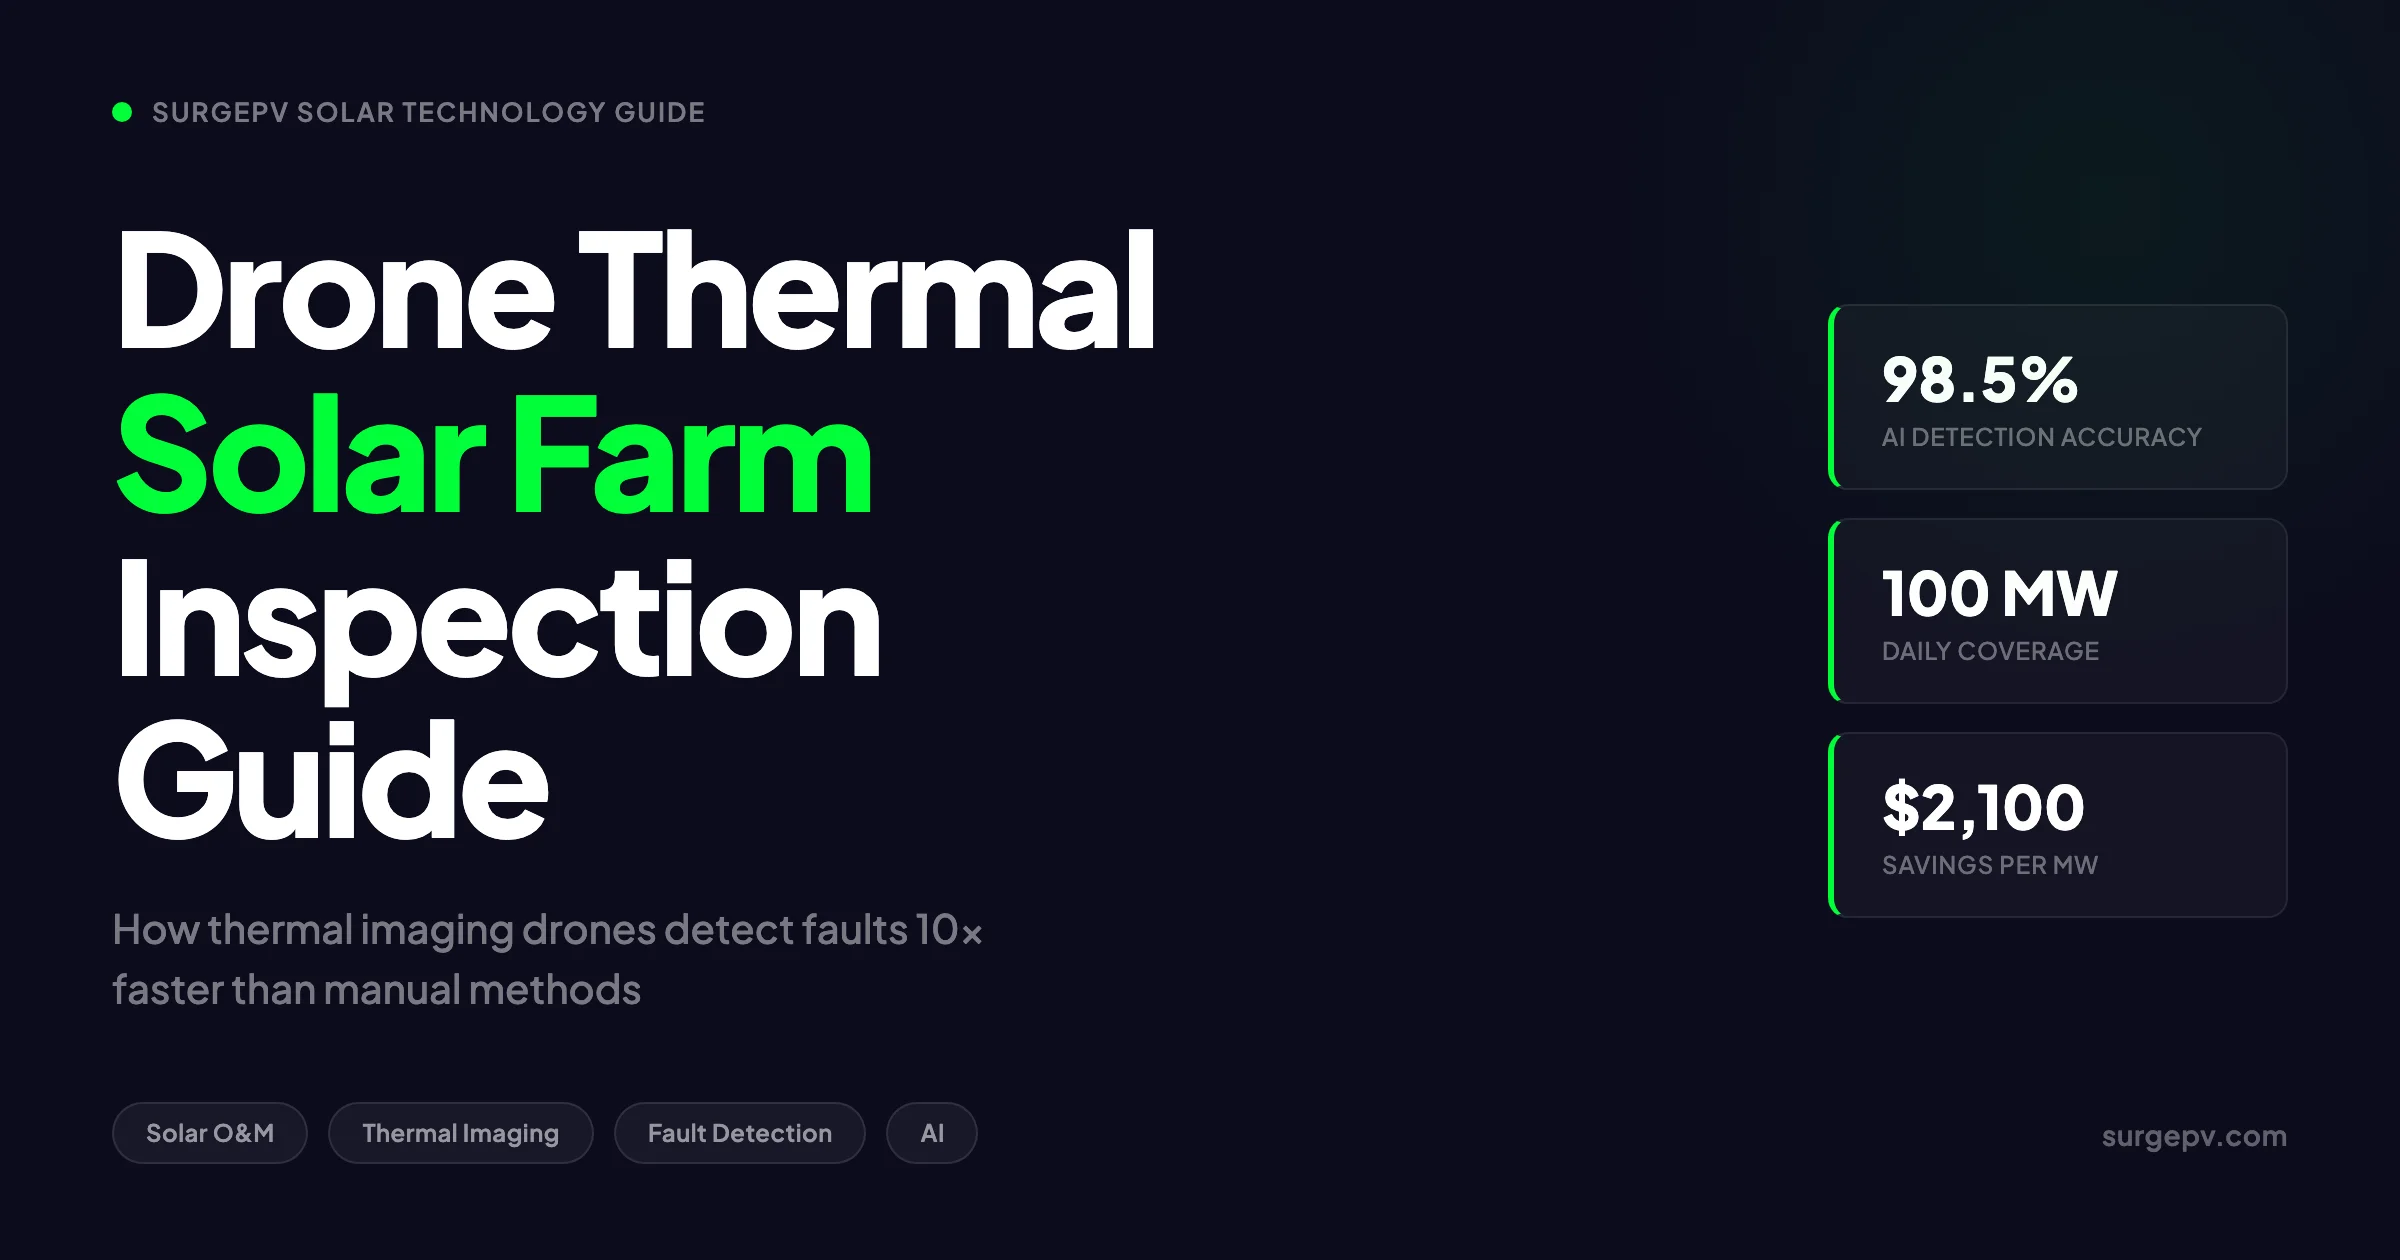
Drone thermal inspection changed that. A single crew now covers 50 to 100 MW per day. They scan every panel, not a sample. They find faults 95% to 99% faster than manual methods. And they do it without shutting down sections of the farm.
This guide covers the full drone inspection stack for solar farms in 2026. You will learn how thermal imaging finds faults that SCADA misses. You will see the hardware, software, and standards that matter. You will get real cost and ROI numbers. And you will understand what most O&M guides get wrong about drone inspections.
Quick Answer
Drone thermal inspection uses a radiometric camera mounted on a UAV to scan solar farms from the air. It detects hotspots, string faults, and cell damage by measuring temperature differences across panel surfaces. A single crew can cover 50–100 MW per day with 95–99% accuracy, compared to weeks of manual sampling.
Key Takeaways
- Hardware underperformance grew 214% since 2019, costing $10 billion globally in 2024.
- A drone crew inspects 50–100 MW per day versus 2–5 hours per MW on foot.
- Savings range from $1,250 to $2,100 per MW compared to manual inspection.
- AI detection accuracy reaches 98.5% on leading commercial platforms.
- IEC 62446-3 compliance is mandatory for warranty claims and insurance documentation.
- Drones are a screening tool, not a replacement for ground-based remediation and I-V testing.
What Is Drone Thermal Inspection for Solar Farms?
Drone thermal inspection is an aerial survey method. A drone equipped with a radiometric thermal camera flies a pre-programmed grid over a solar farm. The camera captures temperature data for every panel surface. Defective cells generate excess heat instead of electricity. They appear as bright hotspots on thermal images.
The key word is radiometric.
A standard thermal camera shows relative heat patterns. A radiometric camera stores the actual temperature value of every pixel. That precision matters for fault classification. A 2 °C temperature difference means something different than a 20 °C difference. The radiometric data tells you which.
Modern setups pair the thermal sensor with a high-resolution RGB camera. The two streams are synchronized and geotagged. When the AI flags a hotspot, the operator can cross-reference it with a visual image. This dual-sensor approach cuts false positives and adds context.
The inspection happens while the panels are under load. Solar irradiance must exceed 600 W/m² for the thermal signatures to be valid. That is why flights happen on clear, sunny days during peak hours. The panels must be actively generating electricity for faults to reveal themselves as temperature anomalies.
Pro Tip
Always request radiometric thermal data, not just visual thermal overlays. Non-radiometric images look impressive in a report but lack the temperature precision needed for warranty claims or insurance disputes.
How Thermal Drone Inspection Works
The process splits into three phases: pre-flight planning, data capture, and post-processing. Each phase has specific technical requirements. Skipping any of them degrades the final output.
Pre-Flight Planning
The operator defines the flight path using mission planning software. The standard pattern is a lawn-mower grid that blankets every row. Overlap matters. The drone needs at least 70% front overlap and 20% to 30% side overlap between images. This ensures complete coverage and enough redundant data for stitching.
Flight altitude typically ranges from 10 to 30 meters above ground level. Lower altitudes give finer ground sample distance. Higher altitudes cover more ground per battery. At 20 meters, a 640 x 512 thermal camera achieves roughly 3 cm per pixel. That is the minimum resolution IEC 62446-3 requires for cell-level analysis.
The operator also records environmental conditions. Irradiance, wind speed, ambient temperature, and panel tilt all affect thermal readings. These values are logged with the flight data. They are essential for compliance reporting.
Data Capture
The drone follows the pre-programmed path autonomously. An RTK module provides centimeter-level positioning. Each thermal and RGB image gets geotagged with GPS coordinates. The thermal camera captures radiometric frames at set intervals, typically one frame every 1 to 2 seconds.
The operator monitors the flight from a ground station. Real-time video feed lets them spot issues immediately. Some solar software platforms now run edge AI on the drone itself. The system detects anomalies in real time and can adjust the flight path to capture higher-resolution images of flagged panels.
A typical flight for a 20 MW farm takes 2 to 4 hours. That includes battery swaps. Manual I-V curve tracing for the same farm takes 500 hours. That is 20 days of field labor.
Post-Processing and AI Analysis
After the flight, the operator uploads thousands of images to a processing platform. The software stitches the images into an orthomosaic map of the entire farm. Every panel is visible in both thermal and visual layers. Also see: Us Residential Solar Market Trends 2026.
AI algorithms then scan the thermal layer for anomalies. The system classifies each detected issue by type and severity. Common classifications include:
| Fault Type | Thermal Signature | Typical ΔT | Severity |
|---|---|---|---|
| Cell hotspot | Single bright cell | 10–40 °C | High |
| Multi-cell defect | Clustered bright cells | 5–20 °C | Medium–High |
| String fault | Entire row or substring dark | 5–15 °C | Medium |
| Bypass diode failure | Half panel bright, half dark | 10–30 °C | High |
| PID (shunting) | Patchwork or gradient pattern | 2–10 °C | Low–Medium |
| Junction box issue | Localized hotspot at box | 15–40 °C | High |
| Soiling/shading | Cold or patchy area | Variable | Low |
| Cracked cell | Linear or branching hotspot | 5–15 °C | Medium |
The AI outputs a georeferenced defect map. Each anomaly is pinned to its exact panel location. The report includes severity scores, recommended actions, and estimated revenue impact. Turnaround ranges from 24 hours for AI-assisted analysis to one week for manual review.
In Simple Terms
Think of drone thermal inspection as an aerial medical scan for your solar farm. The thermal camera is the X-ray machine. The AI is the radiologist. The georeferenced map is the diagnosis with GPS coordinates for every problem.
Fault Types Detected by Thermal Drones
Not all solar faults look the same in thermal imagery. Understanding the thermal signatures helps operators interpret reports and prioritize repairs. Here is what drones can and cannot find.
Cell Hotspots
A cell hotspot is the most common and dangerous fault. It occurs when a single cell generates heat instead of electricity. Causes include microcracks, manufacturing defects, or shading on one cell in a string.
The thermal signature is a single bright spot on an otherwise uniform panel. Temperature differentials above 20 °C indicate a direct safety risk. Hotspots can lead to panel fires if left unaddressed. Field studies show hotspots are the dominant defect in early-operation plants.
A 2025 field study of a 24.9 MW plant in Sumatra analyzed 64,140 modules. Hotspots were the most common abnormality. The overall module defect rate was roughly 1.05%.
String and Substring Faults
A string fault occurs when an entire series of panels underperforms. Causes include loose connections, blown fuses, or inverter channel failures. In thermal imagery, a string fault appears as a dark row or substring. The panels are cooler than neighbors because they are producing less power.
String faults are particularly costly because they affect multiple panels at once. A single blown fuse can take 20 to 30 panels offline. SCADA systems sometimes flag string faults, but not always. Drones catch them visually even when electrical monitoring is silent.
Nexamp reported a real example. A drone pilot found two string faults at Charlton Solar and Golden Hills Solar that existing fault detection methods missed. One was a blown fuse. The other was a loose but not disconnected string.
Bypass Diode Failures
Bypass diodes protect panels from partial shading and cell damage. When a diode fails, the affected substring stops contributing power. The remaining cells in that substring overheat.
The thermal signature is distinctive. Half the panel appears bright while the other half appears normal. This pattern is easy for AI to classify. Bypass diode failures cause 33% or more power loss in affected strings. The failure rate is roughly 1% per year.
Potential Induced Degradation (PID)
PID is a slow, voltage-driven degradation process. High string voltages and humidity accelerate it. In thermal imagery, PID-s (shunting type) appears as warmer cells near the bottom frame or as patchwork patterns across the panel.
Advanced PID stages can cause discoloration and hotspots over time. Historical data shows severe PID cases cause 20% or more yield loss within one year. Early detection via thermal imaging allows operators to address grounding issues or reduce string voltage before degradation accelerates.
Junction Box Overheating
Junction boxes house the bypass diodes and electrical connections. Poor connections, moisture ingress, or diode failures cause localized overheating. The thermal signature is a hotspot centered on the junction box, often with a temperature differential above 15 °C.
Junction box failures are fire risks. A 2025 IEA-PVPS failure fact sheet found 350 junction box failure cases among 64,140 modules analyzed. That is a 0.55% failure rate.
Soiling, Shading, and Vegetation
Drones detect soiling and shading through thermal contrast. Soiled panels run cooler because less light reaches the cells. Shaded panels show similar patterns. These are not hardware faults, but they cause real yield loss.
The distinction matters for O&M prioritization. A cleaning schedule fixes soiling. Vegetation management fixes shading. Neither requires panel replacement. Drones help operators distinguish hardware faults from maintenance issues and allocate resources accordingly.
What Drones Cannot Detect
Drones do not inspect the underside of arrays, balance-of-system cabling, or mounting hardware. They do not perform I-V curve tracing or deep electrical characterization. They are a screening tool. Remediation still requires ground crews with electrical testing equipment.
See Solar Racking Design Guide for detailed guidance.
IEC 62446-3 and Inspection Standards
Compliance matters. A thermal inspection report that does not meet IEC TS 62446-3:2017 standards may be rejected by insurers and warranty providers. Understanding the standard helps you evaluate providers and validate your own reports.
What IEC 62446-3 Covers
IEC TS 62446-3:2017 defines the method for outdoor infrared thermography of PV modules and plants in operation. It specifies environmental conditions, camera requirements, geometric resolution, and reporting formats.
The IEC TS 62446-3:2017 standard classifies drone-based inspection as a simplified inspection procedure. Its purpose is to find sub-areas, strings, or modules with problems. Simplified inspections have reduced personnel qualification requirements. They are suitable for preventive maintenance and commissioning checks. They do not provide authoritative conclusions about actual module quality.
Key Technical Requirements
Geometric resolution: All PV modules must be recorded with a minimum of 5 x 5 pixels per cell. At standard flight altitudes, this translates to roughly 3 cm per pixel or better.
Camera specifications: Thermal cameras must operate in the correct wavelength range. Cameras in the 2 to 5 µm range should only be used for balance-of-system components, not PV modules. Glass is transparent in the 3 µm range, which causes measurement errors on panel surfaces.
Radiometric accuracy: The camera must detect temperature differences of 2 °C or greater. Calibration to ±2 °C accuracy is required for valid warranty documentation.
Movement considerations: Flight speed must respect the thermal camera’s detector time constant. Too fast, and the images smear. Smearing distorts both visual patterns and absolute temperatures.
Environmental Conditions
| Parameter | Minimum / Maximum | Notes |
|---|---|---|
| Solar irradiance | ≥600 W/m² | Panels must be under load |
| Wind speed | < 5 m/s | Higher wind compresses thermal differentials |
| Ambient temperature | Within camera spec | Logged for correction |
| Time of day | Midday, clear skies | Avoid early morning / late afternoon angle effects |
| Panel condition | Clean, unobstructed | Soiling and vegetation cause false positives |
Why Compliance Matters
Insurers increasingly require IEC-compliant inspection reports. Non-compliant data may lack the resolution or metadata needed for claim approval. Low-resolution thermal images can fail to document microcracks or hotspot severity clearly.
Warranty claims also depend on compliant documentation. A manufacturer may reject a hotspot claim if the inspection was performed outside standard conditions. The report must include irradiance, wind speed, camera specifications, and calibration data.
A new version of the standard is under development. It will address advancements in drone technology, AI analysis methods, and anomaly classification. The update is expected to refine thermal imaging resolution guidelines and environmental condition monitoring.
Pro Tip
When evaluating a drone inspection provider, ask for a sample report. Check that it includes irradiance logs, camera calibration certificates, wind speed data, and pixel-per-cell resolution. If any of these are missing, the report may not support a warranty claim.
Drone Hardware and Software Platforms in 2026
The drone solar inspection market has matured rapidly. Equipment ranges from entry-level packages under $5,000 to enterprise setups exceeding $30,000. The right choice depends on farm size, inspection frequency, and data requirements.
Enterprise Standard: DJI Matrice 350 RTK + Zenmuse H30T
The DJI Matrice 350 RTK with Zenmuse H30T is the industry standard for 2026. The Matrice 350 RTK costs roughly $12,000. The H30T thermal sensor adds approximately $15,000. Total hardware investment: $27,000.
Key specs:
| Feature | Specification |
|---|---|
| Thermal resolution | 640 x 512 radiometric |
| RGB resolution | 20 MP |
| Temperature measurement range | -20 °C to 1500 °C |
| Accuracy | ±2 °C or ±2% |
| Flight time | ~55 minutes per battery |
| RTK positioning | Centimeter-level |
| Zoom | Up to 400x digital (thermal + RGB) |
This setup handles utility-scale farms with ease. A single battery covers several megawatts. The H30T’s zoom capability lets operators inspect flagged panels in detail without landing and relaunching.
Mid-Range Options
The DJI Mavic 3T Enterprise ($5,000 to $7,000) and Autel EVO II Dual 640T ($4,500 to $6,000) serve smaller farms and commercial rooftops. Both offer 640 x 512 thermal resolution and dual RGB imaging. Flight times are shorter. Wind tolerance is lower. But the image quality is sufficient for most inspection tasks.
These platforms are popular with drone service providers who need portability. A Mavic 3T fits in a backpack. The Matrice 350 requires a vehicle and two-person crew.
Software Platforms
After the flight, images go to a processing platform. The leading options in 2026 include:
| Platform | Strengths | Pricing |
|---|---|---|
| Sitemark | Full lifecycle, 1,100+ companies, 310+ GWp managed | Enterprise pricing |
| Raptor Maps | O&M focus, trend analysis, digital twin | Per-MW or subscription |
| Averroes AI | 98.5% detection accuracy, 80K images in 20 hours | Per-inspection or subscription |
| SkyVisor | Thermal + visual anomaly detection, rapid reporting | Subscription |
| vHive | Multi-drone autonomous operations, data standardization | Enterprise pricing |
Software costs typically run $3,000 to $8,000 per year for a single operator. Enterprise licenses for fleets exceed $20,000 annually.
Choosing the Right Stack
For farms under 10 MW inspected annually, outsourcing to a drone service provider is usually more cost-effective. The provider brings equipment, software, certified pilots, and insurance. You pay per MW.
For farms above 20 MW or portfolios with multiple sites, in-house programs make sense. The upfront investment pays back within one to two years. You control scheduling, data quality, and turnaround time.
SurgePV Analysis
The real cost is not the drone or the camera. It is the data pipeline. A $30,000 drone with no AI processing platform produces raw images that take weeks to review manually. The software subscription is the bottleneck, not the hardware.
For a direct comparison, see Arka 360 vs SurgePV.
ROI and Cost Analysis
The business case for drone inspection rests on three pillars: labor savings, revenue recovery, and risk reduction. Each pillar has measurable numbers.
Labor Savings
Manual I-V curve tracing takes 2 to 5 hours per MW. A 100 MW farm requires 2,500 hours. At $32 per hour, that is $80,000 in labor alone. Add travel, equipment, and site downtime. The total manual cost easily exceeds $100,000.
A drone crew inspects the same 100 MW farm in 10 to 20 hours. Service costs range from $150 to $500 per MW. At $400 per MW, the total is $40,000. That is a 60% cost reduction.
For in-house programs, the economics improve with scale. A $30,000 equipment investment plus $5,000 annual software covers unlimited internal inspections. At 50 MW inspected annually, the cost per MW drops to roughly $700 in year one and $100 in year two.
Revenue Recovery
Undetected faults cost real money. A 5% yield loss on a 10 MW site costs approximately $40,000 annually at $0.10 per kWh. The actual rate depends on local power prices and PPA terms.
Consider a 50 MW farm in Texas with 4.9% power loss from inverter faults. At $0.10 per kWh, that is $245,000 in lost annual revenue. A single drone inspection identifies the faults. Repairs restore the lost production. The inspection cost is $15,000 to $25,000. The payback is immediate.
One solar asset owner estimates annual savings of $476,104 from repairing defective modules that on-foot inspections would have missed.
Risk Reduction
Insurance premiums for solar farms increasingly factor in inspection frequency and method. Farms with annual thermal inspections qualify for lower rates. Farms relying on manual sampling pay more.
Warranty claims also benefit. IEC-compliant thermal reports provide the documentation manufacturers require. Without compliant data, a hotspot claim may be denied. The cost of a denied claim on a 100-module string can exceed $20,000 in replacement panels plus labor.
ROI Summary Table
| Scenario | Manual Cost | Drone Cost | Annual Savings | Payback Period |
|---|---|---|---|---|
| 10 MW, outsourced | $25,000 | $4,000 | $21,000 | Immediate |
| 50 MW, outsourced | $125,000 | $20,000 | $105,000 | Immediate |
| 100 MW, outsourced | $250,000 | $40,000 | $210,000 | Immediate |
| 50 MW, in-house (Y1) | $125,000 | $35,000* | $90,000 | 4 months |
| 50 MW, in-house (Y2+) | $125,000 | $5,000** | $120,000 | Already paid |
*Includes $30,000 equipment + $5,000 software. **Software subscription only.
Real-World Example
A 7.5 MW thermal drone inspection in the United States identified $21,423 in lost revenue tied to previously undetected anomalies. The inspection cost was approximately $3,000. The farm recovered the full $21,423 within the first quarter after repairs.
What Most O&M Guides Get Wrong About Drone Inspections
Most articles on this topic read like product brochures. They list benefits without context. They omit the hard parts. Here is what they consistently miss.
Myth 1: Drones Replace All Other Inspection Methods
They do not. Drones are a detection tool, not a complete solution. They find where problems are. They do not fix them. They do not diagnose electrical root causes. I-V curve tracing, ground-based thermal cameras, and inverter-level monitoring still have roles.
A drone tells you which panel has a hotspot. It does not tell you why the cell failed. Was it a manufacturing defect? A microcrack from shipping? A shading event that overloaded the bypass diode? Ground crews with electrical testers answer those questions.
The honest scope is this: drones replace the detection phase of manual inspection. Remediation still happens on the ground.
Myth 2: AI Detection Is 100% Accurate
It is not. Leading platforms claim 98.5% accuracy. That is impressive. But the remaining 1.5% matters at scale. A 100 MW farm has roughly 300,000 panels. A 1.5% miss rate means 4,500 potentially faulty panels go unflagged.
False positives are the other side of the problem. A 2% false positive rate on 300,000 panels generates 6,000 flagged items that are actually fine. Reviewing 6,000 false alarms wastes time and money.
Human verification remains essential. The best workflow combines AI for initial screening with human review of borderline cases. AI handles the volume. Humans handle the judgment.
Myth 3: Any Sunny Day Works for Thermal Flights
Weather requirements are strict. Solar weather monitoring tools help operators track irradiance in real time. Irradiance below 600 W/m² hides faults. Wind above 5 m/s compresses thermal differentials. Early morning and late afternoon introduce angle-related artifacts that look like defects but are not.
One common mistake is flying after a rainstorm. Wet panels cool differently. The thermal signatures are distorted. Another mistake is flying when nearby buildings or trees cast moving shadows. The shadow pattern changes during the flight, creating inconsistent thermal data.
Professional operators carry irradiance meters and anemometers. They log conditions for every flight. If conditions drift outside spec, they abort and reschedule.
Myth 4: Higher Camera Resolution Always Means Better Results
Resolution matters, but it is not the only factor. A 640 x 512 camera at 15 meters achieves better ground sample distance than a 320 x 256 camera at 30 meters. But a 640 x 512 camera flown at 50 meters wastes its resolution.
Flight altitude, overlap, and camera calibration matter as much as pixel count. A well-flown mission with a mid-range camera often produces better data than a poorly flown mission with a top-tier sensor.
Myth 5: Drone Inspections Eliminate Site Downtime
This is half true. Drones do not require arrays to be shut down for safety. That is a major advantage over manual methods that force shutdowns. But the farm may still need to be taken offline for repairs. And the inspection itself can disrupt normal operations if flight paths conflict with maintenance vehicle routes.
The real downtime savings come from speed. A drone inspection finishes in hours, not weeks. The farm returns to normal operations faster. But downtime is reduced, not eliminated.
What Most Guides Miss
The biggest hidden cost is not the drone or the software. It is the data management. A 100 MW farm generates 50,000 to 100,000 images per inspection. Storing, indexing, and retrieving those images over a 25-year asset life requires serious IT infrastructure. Most O&M budgets forget this line item entirely.
A Real 50 MW Farm Inspection: What Actually Happened
In 2024, a solar asset manager in Gujarat contracted a drone inspection for a 50 MW site that had been operational for 18 months. The farm had 150,000 panels across 300 acres. SCADA showed no major alarms. Manual sampling of 15% of the array six months earlier found only minor soiling issues.
The drone crew used a DJI Matrice 300 RTK with a Zenmuse H20T. The mission took two days. Weather conditions were ideal: 850 W/m² irradiance, 2 m/s wind, clear skies.
The AI analysis flagged 1,247 anomalies across the full array. Human review confirmed 892 genuine faults. The breakdown:
| Fault Type | Count | Percentage of Array | Estimated Annual Revenue Impact |
|---|---|---|---|
| Cell hotspots | 312 | 0.21% | $89,000 |
| Bypass diode failures | 187 | 0.12% | $67,000 |
| String faults | 94 | 0.06% | $124,000 |
| Junction box issues | 156 | 0.10% | $45,000 |
| PID patterns | 89 | 0.06% | $31,000 |
| Severe soiling | 54 | 0.04% | $12,000 |
| Total confirmed | 892 | 0.59% | $368,000 |
The most surprising finding: 94 string faults. Solar inverter monitoring had flagged only 12 of them. The other 82 were electrically connected but underperforming. They were not offline. They were just producing 60% to 80% of expected output. The inverter monitoring treated them as normal.
The repair campaign took three weeks. String faults were fixed first because they had the highest revenue impact per fault. Hotspots and diode failures required panel replacements under warranty. The manufacturer accepted the claim because the thermal data was IEC 62446-3 compliant.
Total inspection cost: $18,000. Total repair cost: $47,000. First-year revenue recovery: $368,000. Net first-year benefit: $303,000. A quick financial modeling check shows this farm recovers inspection costs in under two weeks.
The asset manager now runs quarterly drone inspections. The cost is $72,000 per year. The expected catch rate for new faults before they compound is 95%.
Key Takeaway
SCADA monitoring catches catastrophic failures. It misses gradual degradation. Drone thermal inspection finds the 0.5% to 2% of panels that are underperforming but still connected. That gap is where the money hides.
Common Limitations and How to Work Around Them
Drone inspection is powerful but not perfect. Understanding the limitations helps operators set realistic expectations and build robust workflows.
Weather Dependency
Thermal data requires stable conditions. Clouds, wind, and rain all degrade accuracy. In regions with monsoon seasons or frequent afternoon storms, the inspection window is narrow.
Workaround: Plan inspections during the dry season. Maintain a two-week weather buffer in the schedule. Some operators use portable weather stations at the farm to monitor microclimates.
Battery Life and Coverage
Most multirotor drones fly 30 to 55 minutes per battery. A 100 MW farm requires 15 to 25 battery swaps. That adds time and logistics complexity.
Workaround: Use multiple battery sets and a ground crew that swaps batteries while the pilot reviews data. Fixed-wing drones offer longer endurance for flat, open terrain. Some operators deploy drone-in-a-box systems with automated charging for repetitive missions.
False Positives
Soiling, vegetation shadows, bird droppings, and reflections all create thermal patterns that resemble faults. AI models trained on clean data struggle with these edge cases.
Workaround: Clean the array before inspection. Trim vegetation. Schedule flights when birds are least active. Use dual RGB-thermal review to visually confirm anomalies before dispatching repair crews.
Data Volume and Storage
A 50 MW farm generates 30,000 to 50,000 images per inspection. Over 25 years with quarterly flights, that is 5 million images. Storage, indexing, and retrieval become significant challenges.
Workaround: Use cloud-based platforms with automatic tagging and search. Store raw imagery in cold storage after AI processing. Retain only the defect maps and annotated reports in hot storage for quick access.
Regulatory Barriers
Beyond Visual Line of Sight (BVLOS) operations are still restricted in many jurisdictions. Large solar farms often exceed the pilot’s visual range.
Workaround: Obtain BVLOS waivers where available. Use multiple visual observers for large sites. Some operators segment the farm into smaller flight zones within visual range.
Cannot Inspect Underside or BOS
Drones see the top surface of panels. They do not see cabling, inverters, transformers, or mounting hardware. They do not inspect the underside of bifacial arrays. Read Bifacial Solar Panel Design Guide for a complete walkthrough.
Workaround: Combine drone thermal inspection with ground-based electrical testing. Schedule inverter maintenance separately. For bifacial arrays, consider ground-based thermal cameras or electroluminescence imaging for rear-side inspection.
Pro Tip
Start with a baseline inspection within the first six months of operation. This establishes the “healthy” thermal signature of your specific panels, mounting, and environment. Future inspections compare against this baseline, making anomaly detection more accurate.
Getting Started: In-House vs. Outsourced
The decision between building an in-house drone program and hiring a service provider depends on farm size, inspection frequency, and internal capabilities. Solar installers should evaluate both paths before committing capital.
Outsourced Drone Inspection
Best for: Farms under 20 MW, occasional inspections, teams without drone expertise.
How it works: You contract a drone service provider. They bring equipment, certified pilots, insurance, and processing software. You receive a report with defect maps and recommendations.
Costs: $150 to $500 per MW. Minimum project fees often apply for small sites.
Pros:
- No capital investment
- No training or certification requirements
- Access to latest equipment and software
- Professional liability insurance included
Cons:
- Higher per-MW cost at scale
- Scheduling depends on provider availability
- Less control over data quality and turnaround
In-House Drone Program
Best for: Farms above 20 MW, portfolios with multiple sites, teams with technical capacity.
How it works: You hire or train a pilot. You purchase equipment and software. You conduct inspections on your own schedule.
Costs: $15,000 to $30,000 equipment, $3,000 to $5,000 annual software, $3,000 pilot training, ongoing labor.
Pros:
- Lower per-MW cost at scale
- Full control over scheduling and data quality
- Faster turnaround for urgent inspections
- Data stays in-house
Cons:
- Significant upfront investment
- Requires certified pilot and ongoing training
- Equipment maintenance and insurance
- Responsibility for regulatory compliance
Hybrid Approach
Many operators use a hybrid model. They outsource annual baseline inspections to a professional provider with top-tier equipment. They handle quarterly follow-ups in-house with a smaller drone. This balances quality and cost.
Questions to Ask a Provider
Before hiring a drone inspection service, ask these questions:
- What camera system do you use, and is it radiometric?
- Do you comply with IEC 62446-3, and can you share a sample report?
- What irradiance and weather thresholds do you enforce?
- How do you classify and prioritize faults?
- What is your false positive rate?
- What is your typical turnaround time from flight to report?
- How do you handle data storage and security?
- Are your pilots certified for commercial operations in this jurisdiction?
Tradeoff
Outsourced inspections cost more per MW but shift risk to the provider. In-house programs cost less at scale but require capital, expertise, and regulatory compliance. The break-even point is roughly 20 to 40 MW of annual inspected capacity. Below that, outsource. Above that, consider in-house.
Future Trends: AI, Digital Twins, and Predictive Maintenance
Drone inspection is evolving rapidly. Three trends will reshape solar O&M in the next three years.
Real-Time Edge Detection
Instead of capturing images and processing them later, drones are beginning to detect anomalies in flight. Edge AI runs on the drone’s onboard computer. It analyzes thermal frames in real time. When it flags a defect, the drone can hover or adjust its path to capture higher-resolution images.
This reduces post-processing time and enables immediate alerts. A safety-critical hotspot can trigger an alert to the ground crew within minutes. The crew dispatches before the drone even lands.
Digital Twins and Predictive Maintenance
Platforms like Raptor Maps and Sitemark are building georeferenced 3D digital twins of solar plants. This connects to broader predictive maintenance strategies. Every panel has a unique identifier linked to its inspection history, performance data, and defect records.
AI models run against the digital twin to predict which panels are likely to fail next. This is predictive maintenance, not reactive repair. Instead of waiting for a hotspot to appear, the model flags panels showing early degradation patterns.
Research from Springer Energy Informatics (2025) shows Remaining Useful Life (RUL) prediction accuracies of 73% to 82% up to two months in advance. That window is enough to order replacement panels and schedule maintenance before yield loss compounds.
Autonomous Drone Fleets
Multi-drone operations are moving from research to commercial deployment. A fleet of three to five drones can inspect a 200 MW farm in a single day. One drone handles thermal scanning. Another carries RGB for visual confirmation. A third performs detailed close-ups of flagged panels.
Autonomous docking and charging stations extend range. A drone returns to the station, swaps its battery automatically, and resumes the mission. This eliminates the human battery-swap bottleneck.
Integration with Solar Design Platforms
The next frontier is closing the loop between design and operations. Solar design software creates the original panel layout. Drone inspections feed actual performance and defect data back into that same model. Designers see how their layouts perform in the real world.
This feedback loop improves future designs. If a particular string configuration consistently shows higher diode failure rates, designers adjust the solar farm design standard. If certain mounting angles create persistent shading patterns, those angles are revised.
Design Solar Farms That Are Easier to Inspect
SurgePV’s solar design software includes row spacing, access path, and terrain analysis tools. Design farms that drone crews can survey efficiently from day one.
Explore Solar Design SoftwarePlan layouts with inspection access in mind · Model shading and terrain · 3D visualization
Frequently Asked Questions
How much does a drone solar farm inspection cost?
Drone solar farm inspections cost $150 to $500 per MW for outsourced services. A 10 MW farm typically runs $4,000 to $5,000 for a full thermal scan. In-house programs require $15,000 to $30,000 in upfront equipment plus $3,000 to $5,000 in annual software. The break-even point is usually 20 to 40 MW of annual inspected capacity.
What faults can a thermal drone detect on solar panels?
Thermal drones detect cell hotspots, string faults, bypass diode failures, Potential Induced Degradation (PID), junction box overheating, disconnected strings, cracked cells, and severe soiling. They also find shading patterns, tracker misalignment, and combiner box issues that ground crews often miss.
How accurate is AI-powered drone fault detection?
Leading commercial platforms claim 98.5% hotspot detection accuracy with false positive rates below 2%. Research-grade vision transformer models achieve 97% accuracy on thermal image classification. Real-world accuracy depends on camera resolution, flight parameters, weather conditions, and the AI model’s training data for the specific panel type.
What is IEC 62446-3 and why does it matter for drone inspections?
IEC TS 62446-3:2017 is the international standard for outdoor infrared thermography of PV systems. It mandates minimum irradiance of 600 W/m², wind speeds below 5 m/s, and a geometric resolution of at least 5 x 5 pixels per cell. Compliance is required for warranty claims, insurance documentation, and legal dispute resolution.
How long does a drone inspection take compared to manual methods?
A drone crew can inspect 50 to 100 MW per day, or roughly 10 minutes per MW. Manual I-V curve tracing takes 2 to 5 hours per MW. A 100 MW solar farm that requires 100 days to inspect on foot takes 10 to 20 hours with drones. That is a 95% to 99% time reduction.
Can drones fully replace manual solar farm inspections?
No. Drones replace the detection phase but not the remediation phase. They cannot inspect the underside of arrays, balance-of-system cabling, or mounting hardware. I-V curve tracing and inverter-level diagnostics still require ground-based testing. Drones are a screening tool that tells crews exactly where to focus.
What weather conditions are required for valid thermal drone data?
Valid thermal data requires clear skies, solar irradiance above 600 W/m², wind speeds below 5 m/s, and minimal thermal turbulence. Early morning and late afternoon introduce angle-related thermal effects that skew readings. Soiling and vegetation must be removed before inspection to avoid false positives.
What drone and camera setup is best for solar farm inspections in 2026?
The DJI Matrice 350 RTK with Zenmuse H30T thermal sensor is the industry standard for 2026. It offers dual RGB and radiometric thermal imaging, RTK positioning, and 640 x 512 thermal resolution. Budget alternatives include the DJI Mavic 3T Enterprise and Autel EVO II Dual 640T. Thermal cameras need minimum 640 x 512 resolution for cell-level detection.
What is the ROI of switching to drone inspections?
Drone inspections save $1,250 to $2,100 per MW compared to manual methods. A 50 MW farm recovering $368,000 annually from previously undetected faults achieves payback in a single season. Outsourced programs show 19,000% ROI over five years. In-house programs show roughly 4,000% ROI over the same period.
How often should solar farms undergo drone thermal inspection?
Annual thermal inspection is the minimum standard for all utility-scale installations. Quarterly inspection is recommended for farms above 20 MW or sites with known quality issues. Monthly inspection may be justified during the warranty period or after severe weather events. Bi-annual inspection is sufficient for well-performing sites under 10 MW. Solar design software helps optimize system design. Solar proposal software generates professional quotes in minutes.


