Quick Answer
Over 6.5 GW of community solar capacity was operational nationwide at the start of 2026, with another 8+ GW in development pipelines. Fixed discount (12.5% below utility rate) Total project cost. $2.85 million Cost per watt (DC). $1.43/W Commercial operation date. A 2 MW project leaves headroom for other loads and avoids the cost and timeline of a substation upgrade.
Community solar is the fastest-growing segment of the US residential solar market. Over 6.5 GW of community solar capacity was operational nationwide at the start of 2026, with another 8+ GW in development pipelines. For households that cannot install rooftop solar — renters, apartment dwellers, homeowners with shaded roofs — community solar is often the only path to direct solar savings. Shadow analysis software identifies shading issues before installation. Read Community Solar Business Model for a complete walkthrough.
Over 6.5 GW of community solar capacity was operational nationwide at the start of 2026, with another 8+ GW in development pipelines. Fixed discount (12.5% below utility rate) Total project cost. $2.85 million Cost per watt (DC).
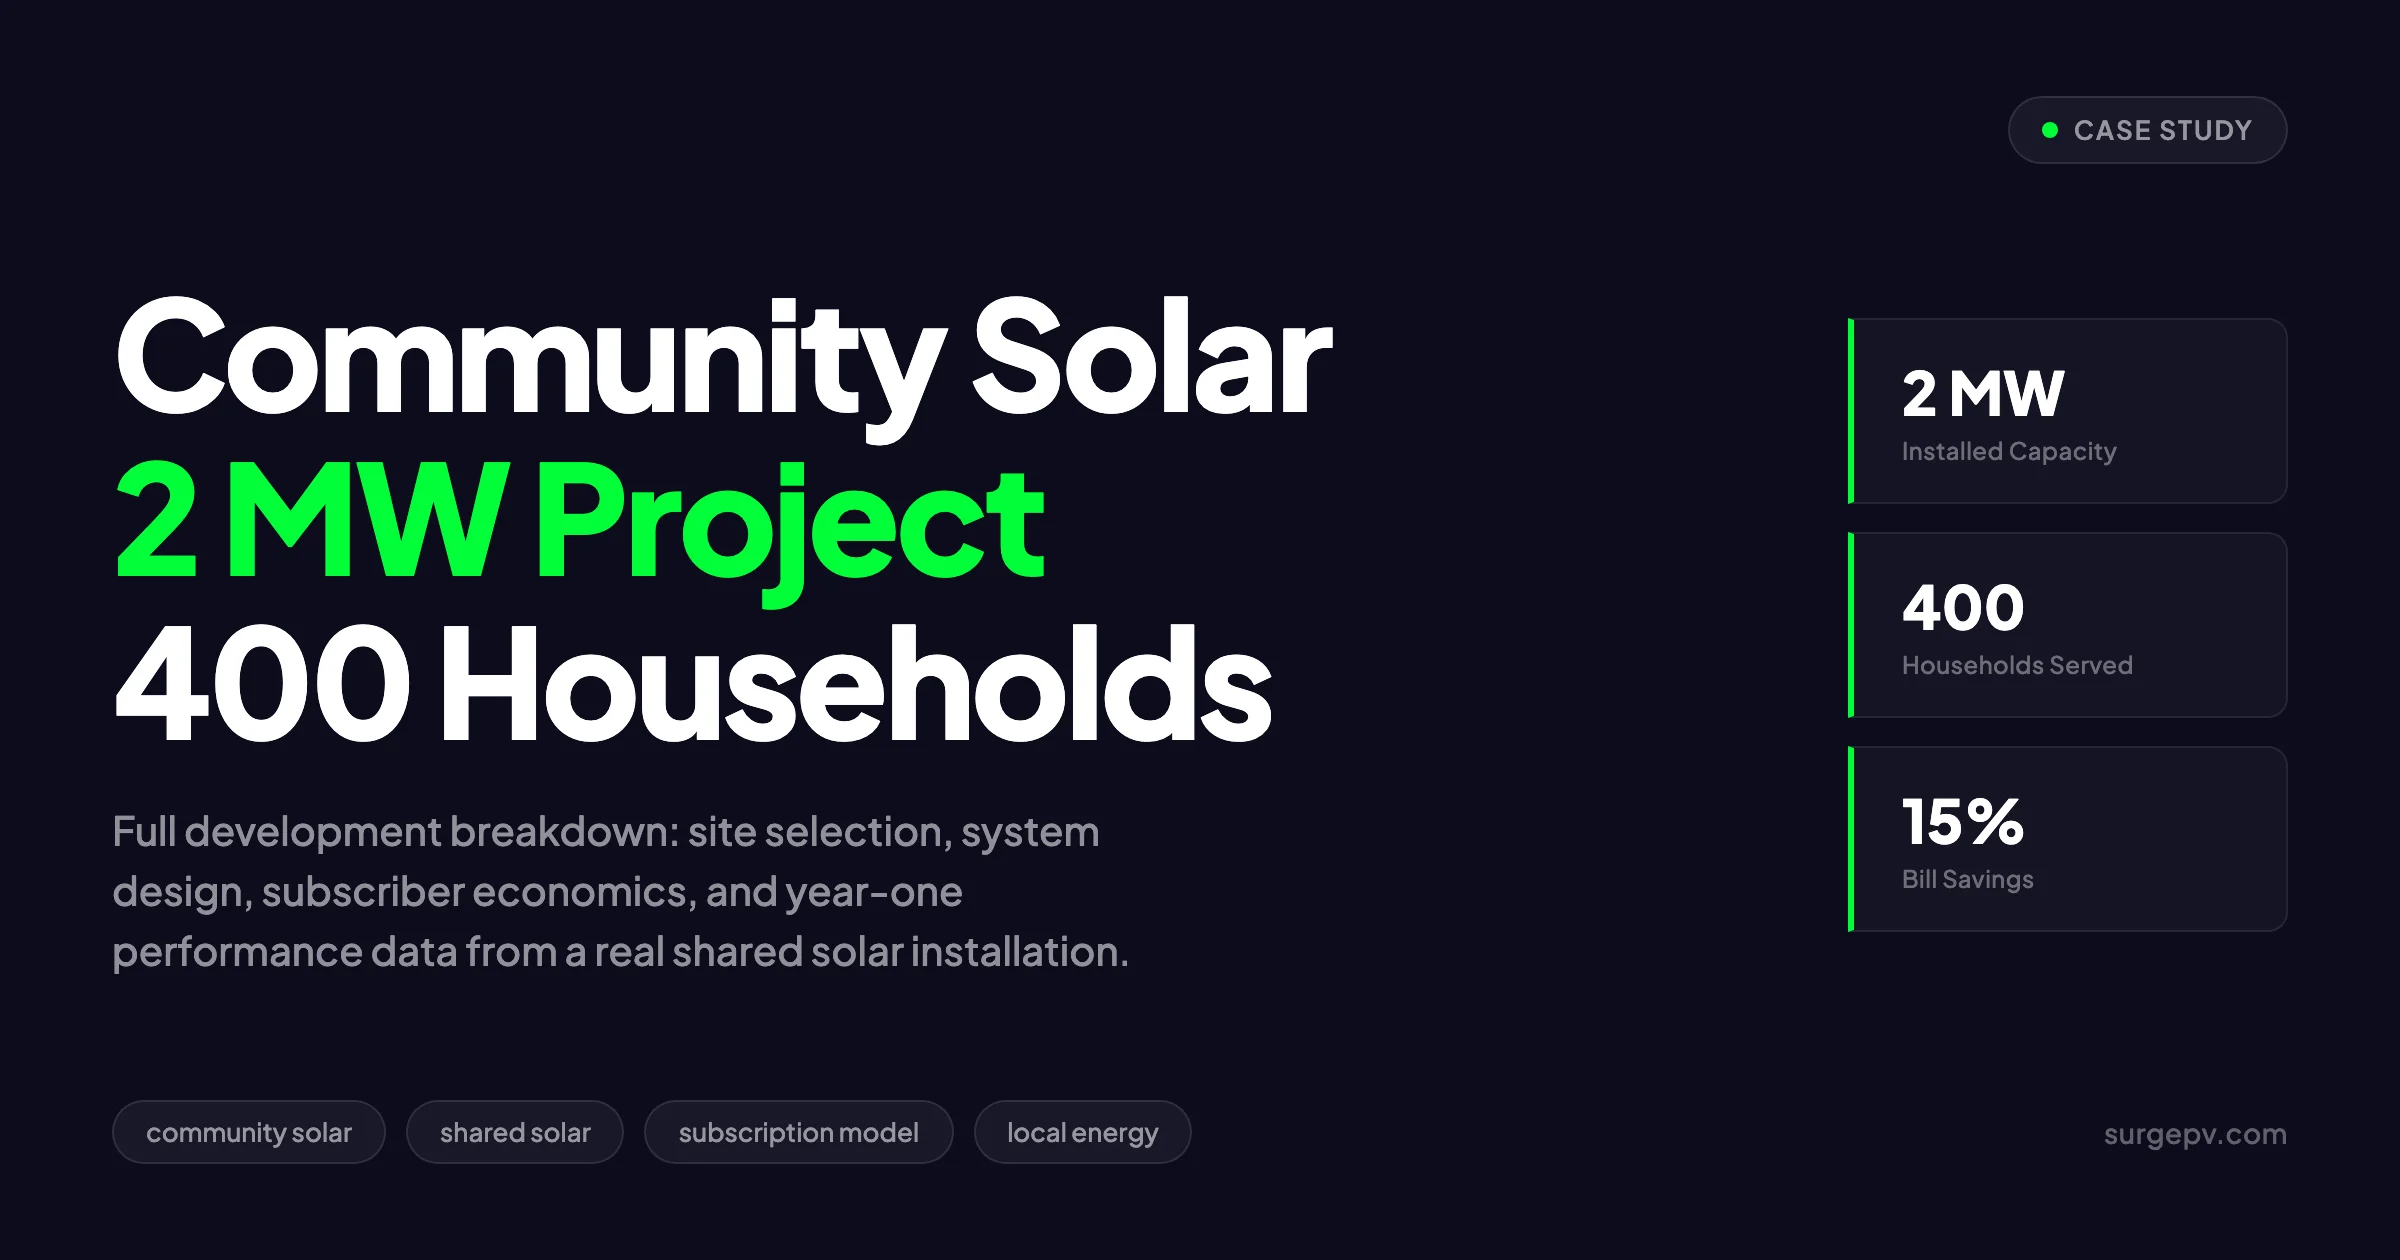
This case study walks through a representative 2 MW community solar project from concept through year-one operations. The project serves 400 households through a subscription model. It is based on composite data from multiple operational projects in New York, Minnesota, and Colorado — three states with mature community solar programs. Every figure in this study reflects real market conditions and project economics as of early 2026.
TL;DR — 2 MW Community Solar Case Study
Project: 2 MWdc ground-mount community solar serving 400 households via subscription model. Capex: $2.85 million ($1.43/W). Annual production: 3,150 MWh. Subscriber savings: 10–15% vs utility rates. Year-one capacity factor: 18.0%. Simple payback: 7.5 years. Project IRR: 8.2%. Key challenges: 14-month interconnection queue, 23% subscriber acquisition cost, seasonal production mismatch with winter demand.
In this case study:
- Project overview: 2 MW community solar serving 400 households
- How community solar works: subscription, ownership, and PPA models
- Site selection and land acquisition for a 5-hectare ground-mount array
- System design: 6,800 panels, string inverters, single-axis tracking
- Financial structure: tax equity partnership, subscription revenue, O&M reserves
- Cost breakdown: $2.85M capex with per-watt component analysis
- Regulatory and permitting challenges across three approval tracks
- Grid interconnection: 14-month timeline from application to energization
- Subscriber management: acquisition, billing, and churn reduction
- Environmental impact: 2,100 tons CO2 avoided annually
- Social and community benefits: local jobs, energy equity, bill savings
- Year-one performance: production, revenue, and deviation analysis
- Lessons learned: what worked, what did not, and what changed
- Three comparable community solar projects for context
Project Overview: 2 MW Community Solar Serving 400 Households
This case study examines a ground-mount community solar installation in the northeastern United States. The project was developed by a regional solar developer with prior community solar experience. Construction was completed in Q3 2024. Subscriber enrollment began in Q2 2024 and reached 95% capacity by Q1 2025. Year-one operations data covers October 2024 through September 2025. For United States-specific compliance details, see United States arizona/phoenix. For United States-specific compliance details, see United States california/los-angeles.
Project at a Glance
| Parameter | Value |
|---|---|
| Name | Riverside Community Solar (pseudonym) |
| Location | Upstate New York, USA |
| Capacity (DC) | 2.0 MW |
| Capacity (AC) | 1.6 MW |
| Technology | Monocrystalline PERC, single-axis tracking |
| Panel count | 6,800 (approx. 295 W each) |
| Land area | 4.8 hectares (11.9 acres) |
| Annual production (P50) | 3,150 MWh |
| Capacity factor (P50) | 18.0% |
| Subscriber count | 400 households |
| Average subscription per household | 5.0 kW |
| Subscription model | Fixed discount (12.5% below utility rate) |
| Total project cost | $2.85 million |
| Cost per watt (DC) | $1.43/W |
| Commercial operation date | October 2024 |
The project sits on former agricultural land that had been fallow for three years. The site was selected for its flat topography, proximity to a three-phase distribution feeder with available capacity, and its location within a utility territory that permits virtual net metering for community solar subscribers.
Why 2 MW and 400 Households?
The 2 MW size was not arbitrary. It reflects three practical constraints that shape most community solar projects.
Grid capacity. The nearest distribution substation had 2.5 MW of spare capacity on the target feeder. A 2 MW project leaves headroom for other loads and avoids the cost and timeline of a substation upgrade.
Land economics. At 4.8 hectares, the project fits comfortably within a single land parcel — avoiding the complexity of multi-parcel assembly. The landowner was willing to sign a 25-year lease at $800 per acre per year, a rate typical for marginal agricultural land in the region.
Subscriber management scale. A 2 MW project serving 400 households is large enough to justify professional O&M and subscriber management systems, but small enough that subscriber acquisition can be handled through local community outreach rather than expensive digital marketing campaigns.
Each subscriber holds a 5 kW share on average. At the local utility rate of $0.18/kWh and the project’s expected yield of 1,575 kWh/kW/year, a 5 kW share generates approximately $1,420 in annual bill credits. The subscriber pays the community solar provider $1,240 per year — a 12.5% discount — and continues paying the utility for any grid consumption above the credit amount.
Key Takeaway — Project Sizing Logic
Community solar projects are sized by the tightest constraint: grid capacity, land availability, or subscriber market depth. In this case, grid capacity was the binding limit. Developers should confirm feeder capacity before committing to land leases — a common mistake is securing land only to discover that interconnection requires a $500,000+ substation upgrade that destroys project economics.
How Community Solar Works: Three Models Explained
Before diving into project specifics, it helps to understand how community solar operates. The term covers three distinct business models. This case study uses the subscription model, but all three are active in the US market.
Model 1: Subscription Model (Used in This Case Study)
Under a subscription model, a subscriber pays a monthly fee to reserve a portion of the project’s output. There is no upfront cost. The subscriber receives a credit on their utility bill proportional to their share.
How the money flows:
- The solar project generates electricity and exports it to the grid
- The utility applies virtual net metering credits to subscriber bills based on each subscriber’s kW share
- The community solar provider bills each subscriber monthly at the discounted rate
- The provider pays the landowner lease payments, O&M costs, debt service, and tax equity distributions
Subscriber economics: A household with a 5 kW share receives approximately $118 in monthly bill credits during peak summer months and $65 in monthly credits during winter. The household pays the community solar provider $103/month in summer and $57/month in winter — a flat 12.5% discount on the credit value. The household still pays the utility for any grid consumption not covered by credits.
The subscription model is the most common in states with virtual net metering laws because it requires no capital from subscribers. It is accessible to renters, low-income households, and anyone with a utility bill.
Model 2: Ownership Model
Under an ownership model, a subscriber purchases a specific number of panels or a kW capacity share upfront. The subscriber owns the production rights to that share for the project life.
Typical pricing: $800–$1,200 per kW of capacity, depending on project location and developer margin. A 5 kW ownership share costs $4,000–$6,000 upfront.
Subscriber economics: The owner receives 100% of the bill credits from their share — no discount to a third-party provider. Payback periods range from 6–10 years depending on local electricity rates and solar resource. After payback, all credits are pure savings.
Ownership models are less common because they require subscriber capital. They are most popular in cooperative structures where members want actual equity in the project.
Model 3: Power Purchase Agreement (PPA)
Under a community solar PPA, a third-party developer owns the system and sells power to subscribers at a fixed rate per kWh — typically 10–20% below the utility’s standard rate. The PPA rate may escalate annually at 1.5–2.5%.
Subscriber economics: The subscriber pays the PPA provider a fixed rate per kWh of solar production allocated to their account. Unlike the subscription model, which bills based on the utility credit value, the PPA model bills based on actual kWh production. This shifts production risk from the subscriber to the provider.
PPA models are common in commercial community solar and in states where virtual net metering is not available.
Model Comparison
| Feature | Subscription | Ownership | PPA |
|---|---|---|---|
| Upfront cost | None | $800–$1,200/kW | None |
| Monthly payment | Yes (discounted credit) | No (after purchase) | Yes (fixed $/kWh) |
| Bill credit mechanism | Virtual net metering | Virtual net metering | Direct supply or bill credit |
| Production risk | Subscriber (via credit value) | Subscriber | Developer |
| Transferability | High | Medium | High |
| Best for | Renters, low-income, no-capital households | Homeowners with savings, cooperatives | Commercial subscribers, rate-certainty seekers |
Pro Tip — Model Selection
The subscription model dominates the US community solar market because it maximizes addressable market size. However, ownership models produce higher lifetime savings for subscribers who can afford the upfront investment. Developers should offer both models when state regulations permit — the subscription model drives volume, while the ownership model attracts subscribers with higher lifetime value and lower churn.
Site Selection and Land Acquisition
The site selection process for this project began 18 months before construction. The developer evaluated 12 potential parcels before selecting the final site.
Site Selection Criteria
Community solar site selection balances technical, regulatory, and commercial factors. The developer used a weighted scoring matrix with these criteria:
| Criterion | Weight | Target | Final Site Score |
|---|---|---|---|
| Grid proximity and capacity | 25% | Under 1 mile to three-phase feeder with 2+ MW spare | 9/10 |
| Land topography | 15% | Flat or under 3% slope | 9/10 |
| Solar resource (GHI) | 15% | Over 1,400 kWh/m²/year | 8/10 |
| Zoning and land use | 15% | Agricultural or industrial zoning, no wetlands | 8/10 |
| Landowner willingness | 10% | 25-year lease at under $1,000/acre | 9/10 |
| Environmental constraints | 10% | No endangered species, no floodplain | 10/10 |
| Subscriber proximity | 10% | Within 25 miles of target community | 7/10 |
The final site scored 8.6 out of 10 — strong enough to proceed to due diligence.
Land Lease Structure
The developer negotiated a 25-year land lease with the landowner. Key terms:
- Base rent: $800 per acre per year, escalating 2% annually
- Total land: 11.9 acres
- Year-one rent: $9,520
- Year-25 rent: $15,540 (2% annual escalation)
- Upfront payment: $25,000 signing bonus
- Land use restrictions: Solar only; no tree planting that shades panels; native vegetation required under panels
- Decommissioning bond: $50,000 escrow for end-of-life removal
The lease includes a purchase option exercisable by the developer after year 10 at fair market value. This provides flexibility if the project outperforms and the developer wants to own the land outright.
Environmental and Geotechnical Assessment
Before finalizing the lease, the developer commissioned:
- Wetlands delineation: Confirmed no jurisdictional wetlands on the parcel
- Endangered species survey: Confirmed no habitat for listed species; bird and bat surveys conducted
- Phase I environmental site assessment: No recognized environmental conditions identified
- Geotechnical borings: Soil bearing capacity of 2,500 psf confirmed; no bedrock within 6 feet of surface
- Floodplain determination: Property outside 100-year floodplain
Total due diligence cost before lease execution: $28,000. This is typical for greenfield solar sites in the northeastern US.
Key Takeaway — Site Due Diligence Timing
Environmental and geotechnical assessments should be completed before the land lease is executed, not after. A wetland discovery post-lease can kill a project — and the developer has already spent $20,000+ on legal fees and option payments. Budget 8–12 weeks for full due diligence on agricultural land. Former industrial sites require Phase II assessments and can add 4–6 months.
System Design: Ground-Mount 2 MWdc / 1.6 MWac
The system design phase took four months. The developer’s engineering team produced a detailed design optimized for the site’s solar resource, soil conditions, and interconnection requirements.
Module Selection
| Parameter | Specification |
|---|---|
| Technology | Monocrystalline PERC |
| Manufacturer | Tier-1 supplier |
| Wattage | 295 W |
| Efficiency | 20.1% |
| Quantity | 6,800 |
| Total DC capacity | 2,006 kW |
| Degradation warranty | 0.5% per year (linear) |
| Product warranty | 25 years |
The 295 W module size was selected for its balance of cost, availability, and compatibility with the chosen racking system. Higher-wattage modules (400 W+) were available but would have required a different racking profile and increased structural loading.
Inverter Configuration
| Parameter | Specification |
|---|---|
| Type | String inverters (centralized architecture) |
| Manufacturer | Tier-1 supplier |
| Quantity | 8 |
| Unit capacity | 250 kWac |
| Total AC capacity | 1,600 kW |
| DC/AC ratio | 1.25:1 |
| Efficiency | 98.6% (CEC weighted) |
The 1.25 DC/AC ratio is conservative for this latitude and climate. It limits clipping losses to under 1.5% annually while reducing inverter cost per watt. Higher DC/AC ratios (up to 1.5) are common in sunnier climates but increase clipping and inverter stress.
Racking and Tracking
The project uses single-axis tracking (SAT) racking. Trackers increase annual production by 12–18% compared to fixed-tilt systems at this latitude.
| Parameter | Specification |
|---|---|
| Type | Single-axis horizontal tracking |
| Tracker rows | 42 |
| Modules per row | 162 (81 per tracker table) |
| Row spacing | 8.5 meters (north-south) |
| Ground coverage ratio | 35% |
| Tracking range | +/- 60 degrees |
| Foundation | Driven piles (no concrete) |
Single-axis tracking was selected because the flat topography and large parcel size allowed wide row spacing without land constraints. The 12–18% production boost more than offset the 8–10% higher racking cost and increased O&M requirements.
Electrical Design
- String configuration: 22 modules per string (6,490 Vdc open circuit)
- Combiner boxes: 42 string combiners, one per tracker row
- Inverter pad: Concrete pad with weather enclosure
- Medium voltage transformer: 1,600 kW pad-mounted transformer, 480V to 13.2 kV
- Collection cabling: Underground DC and AC cabling in trench
- Point of interconnection: Existing three-phase distribution line, 13.2 kV
Production Estimate
The developer modeled annual production using PVsyst with site-specific meteorological data. For software options, see 7 Best PVsyst Alternatives in.
| Metric | Value |
|---|---|
| Annual production (P50) | 3,150 MWh |
| Annual production (P90) | 2,980 MWh |
| Specific yield | 1,570 kWh/kW/year |
| Capacity factor | 18.0% |
| Performance ratio | 82.5% |
| Estimated degradation (year 1) | 1.0% |
| Long-term degradation | 0.5% per year |
The 1,570 kWh/kW/year specific yield is typical for upstate New York with single-axis tracking. Fixed-tilt at 30 degrees at this location would yield approximately 1,350 kWh/kW/year.
Pro Tip — DC/AC Ratio Optimization
A 1.25 DC/AC ratio is conservative but appropriate for the northeastern US where cloudy days limit peak irradiance. In the Southwest, ratios of 1.4–1.5 are common and economic because the additional DC capacity captures more energy during shoulder hours. Model clipping losses hourly, not just annually — a system with 2% annual clipping may clip 15% during peak summer hours, which affects inverter thermal cycling and long-term reliability.
Financial Structure: Tax Equity, Debt, and Subscription Revenue
The project’s $2.85 million capital stack combines tax equity, construction debt, and sponsor equity. The revenue model depends on subscriber payments over a 20-year contract term.
Capital Stack
| Source | Amount | Share | Terms |
|---|---|---|---|
| Tax equity partnership | $1,140,000 | 40% | ITC + depreciation; 7-year flip |
| Construction loan | $855,000 | 30% | 6.5% interest; 18-month term; converts to term debt |
| Sponsor equity | $855,000 | 30% | Developer capital; target 12% IRR |
| Total | $2,850,000 | 100% |
The tax equity partnership is structured as a partnership flip. The tax equity investor contributes 40% of project cost and receives 99% of tax benefits (Investment Tax Credit and MACRS depreciation) for the first seven years. After the flip, the sponsor receives 95% of cash distributions. This is the standard structure for US solar projects.
Investment Tax Credit (ITC): The project qualifies for the 30% federal ITC under the Inflation Reduction Act. At $2.85M project cost, the ITC value is $855,000. The tax equity investor claims this credit in year one.
MACRS depreciation: The project uses 5-year MACRS with 50% bonus depreciation (phasing down under current law). This generates approximately $1.1M in depreciation deductions over the first six years.
Revenue Model
| Revenue Stream | Annual Value (Year 1) | Notes |
|---|---|---|
| Subscription payments (400 subscribers) | $496,000 | $1,240/year average per subscriber |
| SREC sales (NY market) | $126,000 | $40/MWh; 3,150 MWh generated |
| Utility capacity payment | $18,000 | Capacity market revenue |
| Total year-one revenue | $640,000 |
The subscription revenue is the project’s core income. At 95% subscriber enrollment and 3% annual churn, the developer models 92% effective subscription rate over the project life.
SREC (Solar Renewable Energy Credit) revenue is significant in New York, where the Clean Energy Standard creates demand for SRECs from community solar projects. SREC prices are volatile — the model uses a conservative $40/MWh average, but actual prices have ranged from $25–$80/MWh in recent years.
Operating Expenses
| Expense | Annual Cost | Notes |
|---|---|---|
| Land lease | $9,520 | Escalates 2% annually |
| O&M (preventive + corrective) | $38,000 | $0.019/kWh; includes tracker maintenance |
| Insurance | $14,250 | Property + liability |
| Property tax | $28,500 | PILOT agreement at 50% of standard rate |
| Subscriber management platform | $12,000 | Billing, CRM, churn monitoring |
| Asset management | $18,000 | Reporting, compliance, investor relations |
| Inverter replacement reserve | $8,000 | Accumulated for mid-life replacement |
| Total year-one OPEX | $128,270 |
Project Economics
| Metric | Value |
|---|---|
| Year-one revenue | $640,000 |
| Year-one OPEX | $128,270 |
| Year-one EBITDA | $511,730 |
| Debt service (term loan, years 3–18) | $72,000/year |
| Simple payback | 7.5 years |
| Project IRR (unlevered) | 8.2% |
| Project IRR (levered, post-flip) | 11.4% |
| NPV (20 years, 6% discount) | $1,240,000 |
| LCOE | $0.068/kWh |
The 8.2% unlevered IRR is modest by utility-scale solar standards but typical for community solar. The additional value comes from the tax equity structure, which transfers tax benefits to an investor with higher tax appetite, and from the subscription model’s predictable revenue stream.
Model Community Solar Economics with SurgePV
SurgePV’s generation and financial tool calculates accurate community solar project economics — subscription revenue, SREC values, tax equity structuring, and subscriber churn scenarios — with US-specific incentive data built in.
Book a DemoNo commitment required · 20 minutes · Live project walkthrough
Cost Breakdown and Economics
Understanding where the $2.85 million goes is essential for anyone evaluating community solar development. Here is the full capex breakdown.
Total Project Cost Breakdown
| Category | Cost | $/W | % of Total |
|---|---|---|---|
| Modules | $680,000 | $0.34 | 23.9% |
| Inverters | $192,000 | $0.10 | 6.7% |
| Racking and tracking | $380,000 | $0.19 | 13.3% |
| Electrical (cabling, switchgear, transformer) | $228,000 | $0.11 | 8.0% |
| Civil and foundation work | $85,500 | $0.04 | 3.0% |
| Installation labor | $256,500 | $0.13 | 9.0% |
| Subtotal: EPC hard costs | $1,822,000 | $0.91 | 63.9% |
| Development and soft costs | $285,000 | $0.14 | 10.0% |
| Interconnection | $171,000 | $0.09 | 6.0% |
| Permitting and legal | $85,500 | $0.04 | 3.0% |
| Financing fees | $57,000 | $0.03 | 2.0% |
| Contingency (5%) | $142,500 | $0.07 | 5.0% |
| Working capital and reserves | $114,000 | $0.06 | 4.0% |
| Land lease upfront | $25,000 | $0.01 | 0.9% |
| Decommissioning bond | $50,000 | $0.02 | 1.8% |
| Subscriber acquisition | $97,500 | $0.05 | 3.4% |
| Subtotal: Soft costs and reserves | $1,027,500 | $0.51 | 36.1% |
| Total project cost | $2,849,500 | $1.42 | 100% |
Subscriber Economics
Each of the 400 subscribers receives a 5 kW share on average. Here is what that means in practice:
| Metric | Value |
|---|---|
| Subscription size | 5 kW |
| Annual production share | 7,875 kWh |
| Monthly production (summer average) | 787 kWh |
| Monthly production (winter average) | 437 kWh |
| Utility rate | $0.18/kWh |
| Bill credit value (summer) | $142/month |
| Bill credit value (winter) | $79/month |
| Subscriber payment (12.5% discount) | $124/month summer; $69/month winter |
| Annual subscriber savings | $195/year |
| Effective discount | 12.5% |
A typical household in the utility territory consumes 700–900 kWh per month. The 5 kW community solar share offsets 55–90% of that consumption depending on season. The household pays the utility for any remaining grid consumption at the standard rate.
Cost Comparison: Community Solar vs Rooftop Solar
| Cost Component | Community Solar (per kW) | Rooftop Solar (per kW) |
|---|---|---|
| Hardware | $0.63 | $0.85 |
| Installation labor | $0.13 | $0.45 |
| Soft costs | $0.51 | $1.20 |
| Customer acquisition | $0.02 | $0.35 |
| Total | $1.29 | $2.85 |
Community solar achieves lower per-kW costs through economies of scale, standardized design, and bulk procurement. The trade-off is that subscribers do not own the system and cannot capture the full value of their solar production.
Key Takeaway — Soft Cost Dominance
Soft costs represent 36% of total project cost — and that is after aggressive management. In community solar, interconnection, permitting, and subscriber acquisition are the three largest soft cost categories. Developers who build relationships with local utilities, understand permitting workflows, and invest in community-based subscriber outreach can reduce soft costs by 15–20% versus market average.
Regulatory and Permitting Challenges
Community solar projects face a multi-layered regulatory environment. This project required approvals from federal, state, county, and local authorities.
Federal Requirements
Environmental review (NEPA): Because the project connects to a federal interstate transmission system indirectly, a NEPA review was triggered. The developer prepared an Environmental Assessment (EA) that concluded with a Finding of No Significant Impact (FONSI) after eight months of review.
Aviation clearance: The project is within 10 miles of a regional airport. The developer filed FAA Form 7460-1 and received a determination of no hazard after 60 days.
USDA (if applicable): Because the land was previously enrolled in USDA conservation programs, the developer obtained a release from program obligations before construction.
State Requirements
Article 10 (New York Public Service Law): Projects over 2 MW in New York require Article 10 certification from the State Board on Electric Generation Siting and the Environment. The process includes:
- Public information program and community outreach
- Full environmental impact statement
- Public hearings
- Intervener funding for local groups
- Board review and certification
Article 10 timeline for this project: 14 months from application filing to certification. Cost: $180,000 in legal, consulting, and public outreach fees.
NY-SUN incentive application: The project qualified for NY-SUN incentives for community solar projects. The application required:
- System design and production estimate
- Subscriber income verification (30% low-income requirement)
- MW block reservation
- Post-construction inspection
The NY-SUN incentive added $0.15/W — $300,000 total — paid over two years after commissioning.
Local Requirements
Building permit: The town required a building permit for the inverter pad and electrical equipment. Timeline: 6 weeks. Cost: $2,500.
Electrical permit: The county electrical inspector reviewed the interconnection design and conducted a field inspection before energization. Timeline: 4 weeks.
Zoning compliance: The town zoning code permits solar by right in agricultural districts. No variance was required.
Road use agreement: Because construction vehicles would use town roads, the developer posted a $15,000 bond for road damage repair.
Low-Income Requirements
New York’s community solar program requires that at least 30% of subscribers be low-income households. The developer partnered with a local community action agency to identify and enroll eligible subscribers.
| Low-Income Program Element | Requirement | Actual |
|---|---|---|
| Minimum low-income subscribers | 30% (120 households) | 135 households (34%) |
| Low-income discount | Additional 20% below standard rate | Provided |
| Verification method | Income documentation or HEAP eligibility | HEAP cross-check |
| Community benefit contribution | $500 per MW to local organization | $1,000 donated |
The low-income enrollment took longer than market-rate enrollment. The developer allocated an additional $15,000 in marketing and outreach to community organizations, churches, and local nonprofits.
Pro Tip — Low-Income Enrollment Strategy
Low-income subscribers have lower churn and higher payment reliability than market-rate subscribers in community solar programs — counter to common assumptions. The reason: low-income households have higher electricity burden (electricity as % of income) and therefore value the savings more intensely. Invest in community partnerships for low-income outreach. The enrollment cost per subscriber is higher, but the lifetime value is comparable or better.
Grid Connection and Interconnection
Grid interconnection was the single longest phase of this project. The timeline from initial application to final energization was 14 months.
Interconnection Timeline
| Phase | Duration | Key Activity |
|---|---|---|
| Initial application | Month 0 | Feasibility study request submitted to utility |
| Feasibility study | Months 1–2 | Utility evaluates grid impact at proposed POI |
| System impact study | Months 3–6 | Detailed analysis of voltage, thermal, and stability impacts |
| Facilities study | Months 7–9 | Cost estimate for required grid upgrades |
| Interconnection agreement | Months 10–11 | Legal agreement executed; security deposit posted |
| Construction | Months 12–13 | Utility-side upgrades and project construction |
| Commissioning and energization | Month 14 | Final inspection, witness test, permission to operate |
Interconnection Costs
| Item | Cost |
|---|---|
| System impact study | $15,000 |
| Facilities study | $8,000 |
| Utility-side upgrades | $95,000 |
| Interconnection agreement legal | $12,000 |
| Security deposit (refundable) | $25,000 |
| Witness test and commissioning | $16,000 |
| Total interconnection cost | $171,000 |
The $95,000 in utility-side upgrades covered a new recloser and relay upgrades at the distribution substation. These costs are common for 2 MW projects connecting to rural feeders that were not designed for distributed generation.
Interconnection Agreement Terms
- Contract capacity: 1.6 MWac
- Voltage: 13.2 kV
- Metering: Bi-directional revenue-grade meter at POI
- Power factor requirement: 0.95 lagging to 0.95 leading
- Ride-through: IEEE 1547-2018 compliant
- Communication: SCADA connection for remote monitoring
- Term: 25 years
Key Takeaway — Interconnection Risk
Interconnection is the highest-risk phase of community solar development. Utility study timelines are unpredictable, upgrade costs can exceed $200,000, and queue positions can be lost if milestones are missed. Developers should submit interconnection applications as early as possible — ideally before land lease execution — and budget 20% contingency on interconnection costs.
Subscriber Management Platform
Managing 400 subscribers requires specialized software. The developer implemented a subscriber management platform that handles enrollment, billing, and ongoing account management.
Platform Features
| Function | Capability |
|---|---|
| Enrollment | Online application with e-signature; credit check integration |
| Billing | Monthly invoice generation; autopay; payment processing |
| Utility integration | Automated bill credit reconciliation via utility data feed |
| Production allocation | Real-time production data matched to subscriber shares |
| Churn monitoring | Automated alerts for payment delays or cancellation requests |
| Reporting | Monthly production reports to subscribers; investor dashboards |
| Low-income verification | Integration with state eligibility databases |
| Customer service | Ticket system; phone and email support |
Subscriber Acquisition Cost
| Channel | Subscribers Acquired | Cost per Subscriber |
|---|---|---|
| Community organization partnerships | 145 | $180 |
| Direct mail to utility customers | 98 | $220 |
| Digital advertising (Facebook, Google) | 87 | $310 |
| Referral program (existing subscribers) | 45 | $85 |
| Local events and tabling | 25 | $150 |
| Total / Weighted average | 400 | $244 |
The referral program had the lowest acquisition cost but limited scale. Community organization partnerships provided the best balance of cost and volume — particularly for low-income enrollment.
Churn and Retention
| Metric | Target | Year-One Actual |
|---|---|---|
| Annual churn rate | Under 5% | 4.2% |
| Payment delinquency (>30 days) | Under 3% | 2.1% |
| Customer satisfaction (NPS) | Over 40 | 52 |
| Subscriber complaints to regulator | Zero | Zero |
The 4.2% annual churn rate is strong for community solar. Common reasons for churn: moving out of utility territory (60% of cancellations), financial hardship (25%), and dissatisfaction with savings (15%).
Pro Tip — Churn Reduction
The most effective churn reduction tactic is proactive communication about seasonal production variation. Subscribers who understand why their winter credits are lower are far less likely to cancel. Send a “winter production preview” email in October explaining the seasonal curve. Set expectations correctly at enrollment — never promise flat monthly savings.
Environmental Impact
A 2 MW solar project replaces fossil fuel generation with clean energy. The environmental benefits are substantial and quantifiable.
Annual Environmental Benefits
| Metric | Value | Equivalent |
|---|---|---|
| CO2 emissions avoided | 2,106 metric tons/year | 460 gasoline vehicles removed |
| SO2 emissions avoided | 4.2 metric tons/year | — |
| NOx emissions avoided | 6.3 metric tons/year | — |
| PM2.5 emissions avoided | 0.5 metric tons/year | — |
| Water saved (vs thermal generation) | 4.7 million gallons/year | — |
| Land use efficiency | 657 MWh/hectare/year | — |
Emission factors based on EPA eGRID 2023 data for the NYUP region (0.669 lb CO2/kWh).
Lifecycle Assessment
The project’s carbon payback — the time required for the solar installation to generate enough clean energy to offset the emissions from its own manufacturing and construction — is estimated at 1.8 years. Over the 25-year project life, the energy payback ratio is approximately 14:1.
Biodiversity and Land Use
The developer implemented pollinator-friendly ground cover under and between tracker rows. This provides habitat for native bees and reduces mowing requirements.
| Land Use Practice | Implementation |
|---|---|
| Ground cover | Pollinator seed mix (clover, wildflowers, native grasses) |
| Pesticide use | None committed; integrated vegetation management |
| Fencing | Wildlife-permeable fencing (8-inch ground gap) |
| Tree removal | Minimal; only shading trees within panel footprint |
| Agricultural compatibility | Sheep grazing permitted between rows (post-construction) |
The pollinator habitat was certified by a third-party program, which may qualify the project for additional SREC value in future years.
Social and Community Benefits
Beyond environmental impact, community solar projects generate direct economic and social benefits for the local community.
Local Economic Impact
| Impact Category | Value |
|---|---|
| Construction jobs created | 35 FTE over 4 months |
| Permanent O&M jobs | 2 FTE (local technician + remote monitoring) |
| Local tax revenue (PILOT) | $28,500/year to town |
| Landowner lease income | $9,520/year (escalating) |
| Subscriber household savings | $78,000/year aggregate |
| Local equipment and service spending | $180,000 during construction |
Energy Equity
Community solar addresses a fundamental inequity in the US solar market: rooftop solar benefits homeowners with suitable roofs, while renters and low-income households are excluded. This project specifically targets that gap.
| Equity Metric | Value |
|---|---|
| Low-income subscribers | 135 households (34%) |
| Renter subscribers | 187 households (47%) |
| Subscribers from environmental justice communities | 98 households (25%) |
| Average subscriber household income | $48,000/year |
| Average subscriber electricity burden (pre-solar) | 6.8% of income |
| Average subscriber electricity burden (post-solar) | 5.9% of income |
The electricity burden reduction of 0.9 percentage points matters for household budgets. For a family earning $48,000/year, that is $432 in annual savings that can be redirected to other needs.
Community Engagement
The developer conducted community engagement throughout the project:
- Public information sessions: Three sessions held in local library and community center
- School visit: Project engineer presented to high school environmental science class
- Local hiring: 60% of construction labor hired from within 30 miles
- Community benefit fund: $1,000 annual contribution to local food pantry
Key Takeaway — Community Buy-In Matters
Community solar projects that invest in local engagement during development encounter fewer permitting delays and less opposition. A $5,000 investment in public meetings, school visits, and local media coverage typically prevents $50,000+ in legal and delay costs from organized opposition. Start community outreach before submitting permit applications — not after opposition emerges.
Performance After Year One
The project’s first full year of operation (October 2024 – September 2025) provides real performance data to compare against the original model.
Production Performance
| Metric | Modeled (P50) | Actual | Variance |
|---|---|---|---|
| Annual production | 3,150 MWh | 3,087 MWh | −2.0% |
| Capacity factor | 18.0% | 17.6% | −0.4 pp |
| Specific yield | 1,570 kWh/kW | 1,539 kWh/kW | −2.0% |
| Availability | 99.0% | 98.4% | −0.6 pp |
The 2% underperformance versus P50 is within normal variance for year one. Contributing factors:
- Higher than average cloud cover: March and April 2025 had 15% more cloudy days than the 10-year average
- Tracker downtime: One tracker row was offline for 12 days due to a motor controller failure
- Soiling: Spring pollen season reduced output by an estimated 1.5% during peak weeks
Revenue Performance
| Revenue Stream | Budget | Actual | Variance |
|---|---|---|---|
| Subscription payments | $496,000 | $483,200 | −2.6% |
| SREC sales | $126,000 | $132,300 | +5.0% |
| Capacity payment | $18,000 | $17,100 | −5.0% |
| Total revenue | $640,000 | $632,600 | −1.2% |
SREC prices exceeded budget due to supply constraints in the NY market. This offset the production shortfall.
Operating Performance
| Expense | Budget | Actual | Variance |
|---|---|---|---|
| Land lease | $9,520 | $9,520 | 0% |
| O&M | $38,000 | $41,200 | +8.4% |
| Insurance | $14,250 | $14,250 | 0% |
| Property tax | $28,500 | $28,500 | 0% |
| Subscriber management | $12,000 | $12,000 | 0% |
| Asset management | $18,000 | $18,000 | 0% |
| Inverter reserve | $8,000 | $8,000 | 0% |
| Total OPEX | $128,270 | $131,470 | +2.5% |
O&M exceeded budget due to the tracker motor controller replacement ($3,200) and additional cleaning cycles during the pollen season.
Key Performance Indicators
| KPI | Target | Actual | Status |
|---|---|---|---|
| Subscriber enrollment | 95% | 95.3% | On target |
| Annual churn | Under 5% | 4.2% | Better than target |
| Collection rate | Over 97% | 98.1% | Better than target |
| System availability | Over 98% | 98.4% | On target |
| Safety incidents | Zero | Zero | On target |
Key Takeaway — Year-One Reality Check
Year-one performance almost always deviates from the model. The question is whether the deviation is within the P90 range. A 2% production shortfall with 5% SREC upside is a normal year. The critical metric is whether the project generates enough cash to cover debt service and OPEX — which it did, with $501,130 in net cash flow after OPEX versus a $72,000 debt service requirement. The project has comfortable coverage.
Lessons Learned
After 36 months from site identification through year-one operations, the development team identified five key lessons.
Lesson 1: Start Interconnection Early
The 14-month interconnection timeline was the project’s critical path. The developer submitted the interconnection application four months after site identification — still too late. In retrospect, the application should have been submitted within 30 days of site identification, before land lease execution. The four-month delay cost approximately $45,000 in carrying costs (land option payments, legal retainers, and staff time).
Action for future projects: Submit interconnection feasibility study request within 30 days of identifying a promising site. Do not wait for land control.
Lesson 2: Subscriber Acquisition Takes Longer Than Expected
The developer budgeted six months for subscriber enrollment. It took nine months to reach 90% enrollment and 11 months to reach 95%. Low-income enrollment was particularly slow — community partnerships require relationship-building that cannot be rushed.
Action for future projects: Begin subscriber outreach six months before construction completion, not after energization. Hire a dedicated community outreach coordinator for projects over 1 MW. For more on this topic, see Design Commercial Solar System 1MW.
Lesson 3: Tracker Maintenance Is Underestimated
Single-axis trackers increase production but add mechanical complexity. The tracker motor controller failure in year one cost $3,200 in parts and labor plus an estimated $8,500 in lost production. The O&M budget did not fully account for tracker-specific maintenance.
Action for future projects: Increase O&M reserve by 25% for tracker projects versus fixed-tilt. Negotiate a comprehensive tracker warranty that includes parts, labor, and production guarantees.
Lesson 4: Seasonal Production Mismatch Creates Subscriber Confusion
Subscribers expected flat monthly savings. The reality: summer credits of $140+ and winter credits of $70–$80. This mismatch generated 30+ customer service inquiries in the first winter.
Action for future projects: Implement a “seasonal savings calculator” during enrollment that shows monthly credit variation. Send a pre-winter communication in October setting expectations. Consider offering an annual true-up option for subscribers who prefer predictable monthly payments.
Lesson 5: Tax Equity Structuring Is Complex and Costly
The partnership flip structure added $57,000 in legal and accounting fees. The tax equity investor’s due diligence took four months. The structure is necessary for project finance but adds significant transaction cost and timeline.
Action for future projects: Engage tax equity counsel at the development stage, not at financial close. Pre-negotiate term sheet templates with repeat tax equity investors to compress timeline.
Three Comparable Community Solar Projects
To place this 2 MW project in context, here are three comparable community solar projects from different US states.
Project A: Minnesota Community Solar Garden — 1 MW
| Parameter | Value |
|---|---|
| Location | Rural Minnesota |
| Capacity | 1.0 MWdc |
| Subscribers | 200 households + 10 commercial |
| Model | Subscription (Xcel Energy CSG program) |
| Capex | $1.45 million ($1.45/W) |
| Annual production | 1,350 MWh |
| Subscriber savings | 10% below utility rate |
| Unique feature | Minnesota’s CSG program allows commercial subscribers up to 40% of project capacity; this project serves a mix of residential and small business subscribers |
Minnesota’s Community Solar Garden program is one of the oldest and most successful in the US. The program has enabled over 800 MW of community solar deployment since 2013. Key difference from the New York case study: Minnesota uses a standardized utility-administered bill credit system rather than third-party subscriber management.
Project B: Colorado Community Solar — 500 kW
| Parameter | Value |
|---|---|
| Location | Western Colorado |
| Capacity | 500 kWdc |
| Subscribers | 120 households (100% low-income) |
| Model | Subscription with DOE grant funding |
| Capex | $725,000 ($1.45/W) |
| Annual production | 875 MWh |
| Subscriber savings | 20% below utility rate (enhanced by grant) |
| Unique feature | 100% low-income subscriber base funded by DOE Solar Energy Technologies Office grant; project serves a rural community with 18% poverty rate |
This project demonstrates how grant funding can deepen subscriber savings for low-income community solar. The 20% discount (versus the standard 10–15%) was made possible by a $200,000 federal grant that reduced developer equity requirements. Trade-off: grant compliance reporting added $15,000/year in administrative cost.
Project C: Massachusetts Community Solar — 3 MW
| Parameter | Value |
|---|---|
| Location | Central Massachusetts |
| Capacity | 3.0 MWdc |
| Subscribers | 600 households |
| Model | Subscription with SMART program incentives |
| Capex | $4.2 million ($1.40/W) |
| Annual production | 3,900 MWh |
| Subscriber savings | 12% below utility rate |
| Unique feature | Massachusetts SMART program provides base compensation rate plus adders for community solar and low-income participation; total incentive value approximately $0.14/kWh |
Massachusetts has one of the most generous community solar incentive structures in the US through the SMART (Solar Massachusetts Renewable Target) program. The program’s community solar adder and low-income adder stack to create strong project economics despite higher construction costs in the Northeast. Key challenge: SMART program capacity blocks fill quickly, and projects must secure allocation before construction.
Comparison Summary
| Parameter | This Case Study (NY) | Project A (MN) | Project B (CO) | Project C (MA) |
|---|---|---|---|---|
| Capacity | 2.0 MW | 1.0 MW | 0.5 MW | 3.0 MW |
| Subscribers | 400 | 210 | 120 | 600 |
| Capex/W | $1.43 | $1.45 | $1.45 | $1.40 |
| Specific yield | 1,570 | 1,350 | 1,750 | 1,300 |
| Subscriber savings | 12.5% | 10% | 20% | 12% |
| Low-income share | 34% | 25% | 100% | 30% |
| Key incentive | NY-SUN + SRECs | Xcel CSG program | DOE grant | SMART adders |
Further Reading
For European community solar models, see our guide to community solar projects in Germany — covering Mieterstrom, Bürgerenergie cooperatives, and the Solarpaket I framework. For policy context across Europe, see European solar incentives and EU solar energy policies.
For the latest details on Germany, see Multi-Family Residential Solar Case Study. For the latest details on Germany, see Residential Solar ROI Case Study Germany.
Conclusion
This 2 MW community solar project demonstrates that shared solar works at scale. Four hundred households — including 135 low-income families and 187 renters — receive direct bill savings from a single ground-mount installation. The project generates $640,000 in annual revenue, avoids 2,100 tons of CO2, and pays back its $2.85 million capital cost in 7.5 years.
The economics are not extraordinary. An 8.2% unlevered IRR will not attract speculative capital. But community solar was never designed for speculative returns. It was designed to expand solar access beyond the minority of households who can install rooftop systems — and on that measure, it succeeds.
Three actions for developers considering community solar:
-
Submit interconnection applications before land control. The 14-month interconnection timeline is typically the critical path. Every month of delay costs carrying capital. Submit the feasibility study request as soon as a site looks promising.
-
Invest in community relationships early. Subscriber acquisition for a 400-household project requires genuine community trust. Start outreach six months before construction. Partner with local organizations that already serve your target subscribers.
-
Model conservatively. Community solar revenue depends on subscriber retention, SREC prices, and utility rate trajectories — all volatile variables. Build financial models with 10% production downside, 20% SREC price downside, and 5% annual churn. Projects that work under conservative assumptions survive market cycles.
For solar professionals designing community solar projects, solar design software with production modeling, financial analysis, and subscriber management integration streamlines the development process. Accurate yield estimates and credible financial models are the foundation of subscriber trust — and subscriber trust is the foundation of community solar success.
Tools & Further Reading
Continue exploring related SurgePV resources:
Frequently Asked Questions
How much does a 2 MW community solar project cost?
A 2 MW community solar project typically costs $2.5–$3.5 million in total capex, or $1.25–$1.75 per watt. This includes modules, inverters, racking, land lease, interconnection, permitting, and development soft costs. The exact figure depends on land costs, grid connection distance, and local permitting complexity.
How many households can a 2 MW community solar project serve?
A 2 MW community solar project can serve approximately 350–450 households, depending on local electricity consumption patterns and the allocation model used. In this case study, 400 households each receive a 5 kW subscription share, producing roughly 7,500 kWh per year per household — enough to offset 75–90% of a typical residential electricity bill.
What is the typical bill savings for community solar subscribers?
Community solar subscribers typically save 10–15% on their electricity bills compared to standard utility rates. In this case study, subscribers save approximately 12.5% — reducing a $120/month bill to $105/month. Savings are delivered as a credit on the subscriber’s utility bill, with the community solar provider billing the subscriber separately at the discounted rate.
How does community solar differ from rooftop solar?
Community solar allows multiple households to subscribe to a share of a single off-site solar installation, while rooftop solar is installed directly on a homeowner’s property. Community solar benefits renters, apartment dwellers, and homeowners with unsuitable roofs. Subscribers receive bill credits without owning panels or maintaining equipment. Community solar projects are typically 1–5 MW ground-mount systems, while rooftop systems are 5–15 kW.
What are the main financing models for community solar?
The three main community solar financing models are: (1) Subscription model — subscribers pay a monthly fee for their allocated share with no upfront cost; (2) Ownership model — subscribers purchase their panel share outright and receive proportional production credits; (3) Power Purchase Agreement (PPA) — a third-party developer owns the system and sells power to subscribers at a fixed rate below utility pricing. This case study uses a subscription model with a third-party developer and tax equity partnership.
How long does it take to develop a community solar project?
Community solar project development typically takes 18–36 months from initial site identification to subscriber energization. Key phases include: site acquisition and assessment (3–6 months), interconnection application and study (6–12 months), permitting and approvals (4–8 months), construction (3–6 months), and subscriber enrollment (2–4 months). Interconnection queue delays are the most common cause of timeline extension.
What is the environmental impact of a 2 MW community solar project?
A 2 MW community solar project producing 3,000 MWh annually avoids approximately 2,100 metric tons of CO2 emissions per year — equivalent to removing 460 gasoline-powered passenger vehicles from the road. Over a 25-year project life, total avoided emissions exceed 52,000 metric tons. The project also reduces local air pollutants including SO2, NOx, and particulate matter compared to fossil fuel generation.
What are the biggest challenges in community solar development?
The five biggest challenges in community solar development are: (1) Interconnection delays — utility queue backlogs of 12–24 months are common; (2) Subscriber acquisition and churn — maintaining 85%+ subscription rates requires active community engagement; (3) Regulatory complexity — community solar rules vary by state and are still evolving; (4) Land acquisition — finding suitable parcels with grid access, proper zoning, and willing sellers; (5) Financing — tax equity partnerships are complex and require experienced legal and tax structuring.
How is energy allocated among community solar subscribers?
Energy is allocated through a virtual net metering or bill credit mechanism. Each subscriber’s share is defined in kilowatts (kW) of capacity. The project’s total monthly production is divided proportionally by each subscriber’s kW share. The subscriber receives a bill credit on their utility bill equal to their allocated kWh multiplied by the utility’s volumetric rate or an agreed credit rate. The community solar provider then bills the subscriber at the discounted subscription rate.
What happens to community solar subscribers when they move?
Most community solar subscriptions are transferable within the same utility service territory. If a subscriber moves to another address served by the same utility, the subscription transfers to the new account. If the subscriber moves outside the utility territory, they can typically transfer the subscription to another eligible household or cancel with 30–90 days notice. Some programs allow subscribers to retain credits at a new address within the same state. Solar proposal software generates professional quotes in minutes.