Quick Answer
A 12 MW utility-scale project we audited in northern Spain in 2024 was modeled at 11.4% bifacial gain in PVsyst. The owner had specified TOPCon bifacial modules at a 4% premium, built on a horizontal single-axis tracker, and assumed every cent would come back through rear-side production. Together they cost the project roughly 3.5 percentage points of bifacial gain across 17 GWh of annual production.
A 12 MW utility-scale project we audited in northern Spain in 2024 was modeled at 11.4% bifacial gain in PVsyst. The first full year of operation measured 7.9%. The owner had specified TOPCon bifacial modules at a 4% premium, built on a horizontal single-axis tracker, and assumed every cent would come back through rear-side production. It did not. Also see: Spain net metering. Read Bifacial Solar Panel Design Guide for a complete walkthrough.
A 12 MW utility-scale project we audited in northern Spain in 2024 was modeled at 11.4% bifacial gain in PVsyst. The owner had specified TOPCon bifacial modules at a 4% premium, built on a horizontal single-axis tracker, and assumed every cent would come back through rear-side production. Together they cost the project roughly 3. For software options, see 7 Best PVsyst Alternatives in.
For more details, see our guide on solar farm design guide.
For more details, see our guide on TOPCon vs HJT vs perovskite solar panels.
For more details, see our guide on solar tracking systems comparison. For the latest details on France, see Agricultural Solar Case Study.
The reason was not the modules. It was a 0.20 albedo on cured grass that the modeler had entered as 0.25, a 0.95 m hub height instead of the 1.10 m on the site survey, and a GCR of 0.43 instead of the 0.38 used in the spec. None of these mistakes were dramatic. Together they cost the project roughly 3.5 percentage points of bifacial gain across 17 GWh of annual production.
That gap between modeled and measured bifacial gain is the single most common source of post-build performance disputes in our solar designing practice. This guide unpacks what real-world bifacial gain looks like by mounting type, what drives it, and how to model it without burning your IRR.
TL;DR — Bifacial gain by mounting type, 2026
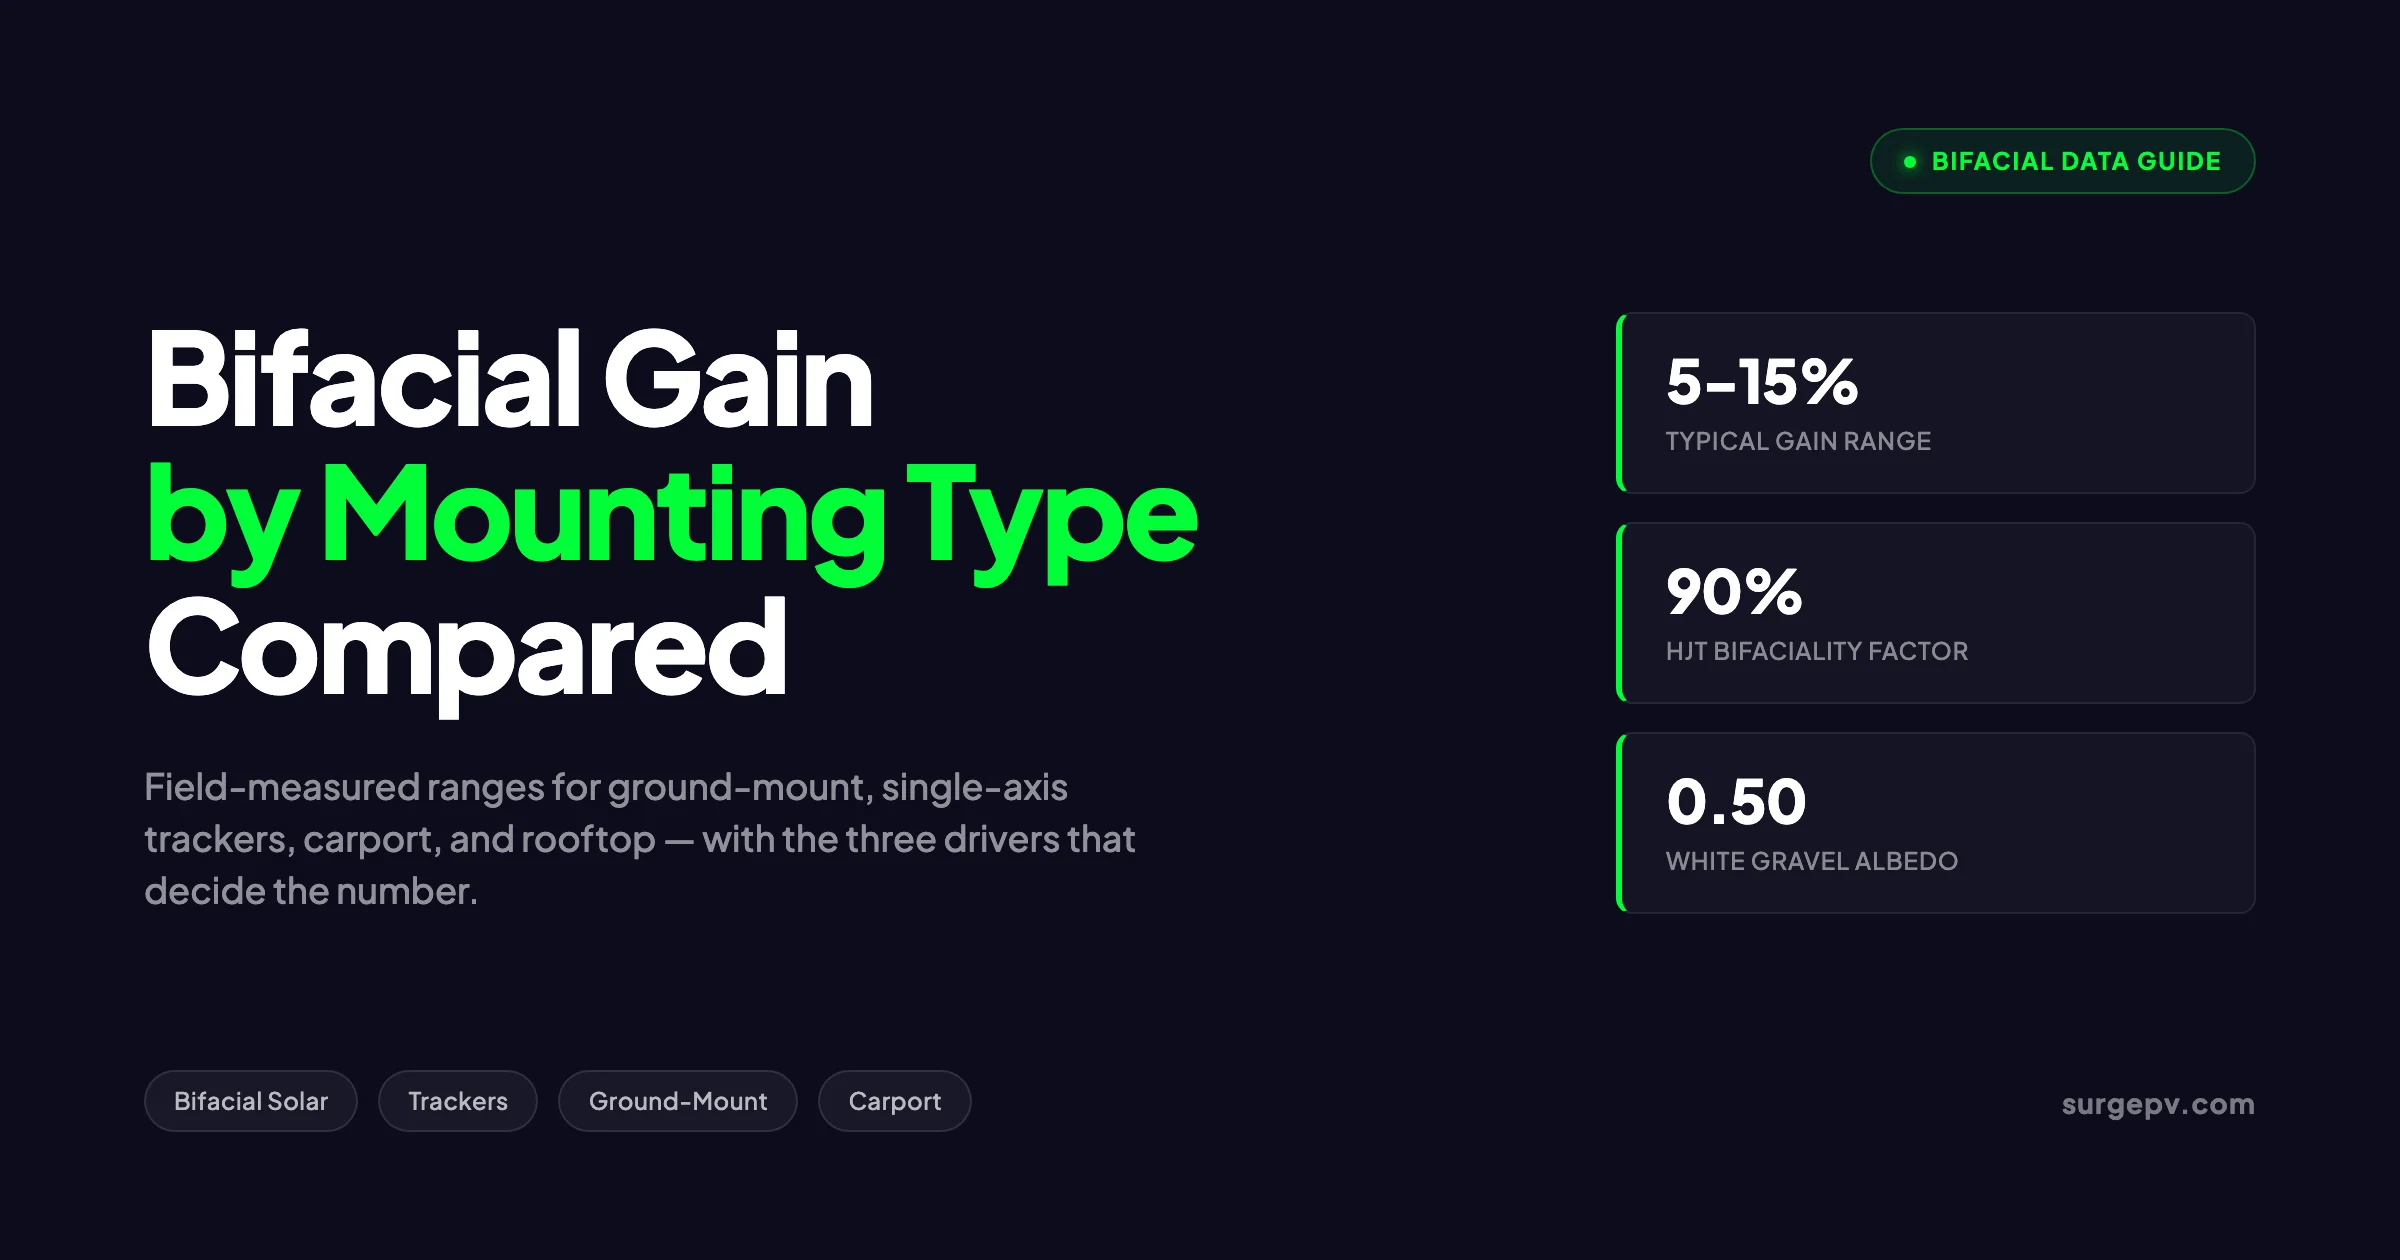
Single-axis trackers: 8-15% typical, up to 20% on high-albedo desert sites. Fixed-tilt ground-mount: 5-12% typical, 12-18% on white gravel. Carports: 3-8% on dark asphalt, 12-20% on light substrate with tall clearance. Rooftop: 2-4% pitched, 4-7% flat-roof racked. Floating PV: 5-10%. Agri-PV elevated: 8-15%. The three levers are bifaciality factor (80% TOPCon, 90% HJT), albedo (0.20 grass to 0.50 gravel), and module elevation (0.5 m to 2.0 m).
See Commercial Solar Carport Design Guide for detailed guidance.
In this guide you will find:
- A side-by-side table of low, typical, and high bifacial gain for every common mounting type
- The three physical drivers — albedo, elevation, and structure shading — explained with field data
- Why most rooftop bifacial modeling overstates gain by 2-4 percentage points
- How NREL, Sandia, and Nextracker field studies break down by site
- A decision matrix for picking bifacial-vs-monofacial by project economics
- An honest assessment of PVsyst accuracy and where it breaks
- Eight FAQs answered with field references
Latest Updates: Bifacial Solar Gain Benchmarks 2026
Three things shifted in 2025-2026 that change how designers should model bifacial gain.
| Update | Date | What changed |
|---|---|---|
| TOPCon overtakes PERC in module shipments | Q2 2025 | TOPCon now represents over 70% of new utility-scale orders, lifting the design-default bifaciality factor from 70% to 80% |
| NREL releases vertical bifacial validation paper | Jul 2025 | Five-model comparison shows PVsyst v7.4.8 RMSE of 33-45% on east-west vertical arrays, vs 11-28% for ray-tracing models |
| Frontiers in Energy Research benchmark study | Mar 2025 | PVsyst measured -13.7% relative error at Heggelbach, +13.2% at Golden CO, -11.6% at Florianópolis — confirming the ~15% accuracy band on fixed-tilt and tracked systems |
| HDPE high-albedo reflector field results | May 2024 | NREL Golden, CO trial measured 2.6-6.0% incremental gain from HDPE ground covers depending on climate (arid vs cloudy) |
| pv magazine 842-module parameter analysis | Jul 2025 | HJT modules confirmed as the highest-bifaciality production technology in 2025 fleet data, with median values above 90% |
For solar installers and developers signing PPAs in 2026, the practical change is that the design-default bifaciality factor should be 80% (TOPCon baseline) rather than 70%. Anything assumed below that for a new build is leaving production on the table.
What Bifacial Gain Actually Measures
Bifacial gain is the percentage of additional energy a bifacial module produces compared to an identical-power monofacial module under the same conditions. If a 540 W monofacial array produces 800 MWh in year one and a 540 W bifacial array on the same site produces 880 MWh, the bifacial gain is 10%.
Two things make this number deceptive in practice.
First, bifacial gain is reported relative to the front-side STC rating. That means a 90% bifaciality factor module does not produce 90% more electricity — it produces electricity from the back side at 90% of the front-side efficiency, weighted by whatever fraction of rear irradiance reaches the cells. Typical rear irradiance is 8-15% of front irradiance, so the headline gain comes out at 7-13% even with a 90% bifaciality factor.
Second, bifacial gain is path-dependent. The same module on the same site can produce 4% gain or 18% gain depending on mounting height, row spacing, ground cover, and tracker behavior. There is no single number that describes “bifacial gain for module X” — only “bifacial gain for module X in this configuration.”
Simple analogy
Think of a bifacial module as a window that lets light through from both sides. The front side gets all the direct sun. The back side gets whatever bounces back off the floor. If your floor is a black asphalt parking lot, very little bounces back. If your floor is white gravel and the window is set high off the ground, a lot bounces back. The window itself does not change — the room around it does.
Bifaciality Factor: 70% PERC, 80% TOPCon, 90% HJT
The bifaciality factor is the ratio of rear-side STC efficiency to front-side STC efficiency, measured under controlled lab conditions. It is the upper bound on how much rear-side light can be converted into electricity.
Three cell technologies dominate the bifacial market in 2026, and they sit at three distinct bifaciality factor tiers.
| Cell technology | Bifaciality factor (2026 typical) | Front-side efficiency | Temperature coefficient | Market position |
|---|---|---|---|---|
| PERC (legacy) | 65-75% | 20-23% | -0.35%/°C | Phasing out, available through 2027 |
| TOPCon | 80-85% | 25-26% | -0.30%/°C | Dominant in utility-scale, ~70% market share |
| HJT | 85-95% (up to 92%+ in production) | 26%+ | -0.26%/°C | Premium tier, growing share |
| Back-contact (BC, xBC) | 70-85% | 24-25% | -0.29%/°C | Premium residential, low-shade sites |
A 2025 study analyzing 842 bifacial modules from 236 manufacturers confirmed that HJT modules sit at the top of the bifaciality factor distribution, with median values above 90% across the production fleet (pv magazine, July 2025). TOPCon clustered around 80-82%, and PERC modules cleared the floor at 65-70%.
The practical implication is large. On the same single-axis tracker with the same albedo, a switch from 70% PERC bifaciality to 90% HJT bifaciality lifts bifacial gain by roughly 2-3 percentage points — moving a 9% gain site to an 11-12% gain site. Over a 25-year PPA with 1,800 kWh/kWp yield, that is roughly 540 kWh/kWp of extra production, or about $32-50/kWp at $0.06-0.09/kWh.
The Three Physical Drivers
Every bifacial gain number breaks down into three multiplicands: how much light reaches the back of the module, how efficiently the cells convert it, and how much the rest of the system absorbs without losing it. The cell-conversion piece is fixed by the bifaciality factor. The other two are design choices.
Driver 1: Albedo (Ground Reflectivity)
Albedo is the fraction of incoming sunlight reflected diffusely off the ground surface beneath the module. It ranges from near zero on fresh asphalt to over 0.85 on fresh snow.
| Surface | Albedo (typical) | Bifacial gain context |
|---|---|---|
| Fresh asphalt | 0.04-0.08 | Worst case — common on commercial carports |
| Aged asphalt | 0.10-0.15 | Most carport projects sit here |
| Concrete (weathered) | 0.16-0.25 | Standard rooftop ballast surface |
| Dark soil / cured grass | 0.15-0.20 | Default for many fixed-tilt sites |
| Fresh grass / vegetation | 0.20-0.25 | Default in IEC bifacial test reports |
| Light-colored sand | 0.25-0.35 | Desert ground-mount baseline |
| White gravel (clean) | 0.50-0.60 | Engineered high-albedo substrate |
| White paint on concrete | 0.55-0.65 | Carport canopy upgrade |
| HDPE reflector (UV stable) | 0.65-0.75 | NREL field-trial material |
| Lime-based substrate (Laborelec) | 0.65-0.70 | Sustainable engineered surface |
| Fresh snow | 0.80-0.90 | Seasonal — Nordic and high-altitude |
Two practical heuristics from field data: every 0.10 increase in albedo lifts bifacial gain by roughly 2-3 percentage points; and doubling albedo from 0.25 to 0.50 roughly doubles bifacial gain on a fixed-tilt ground mount.
Sustainable lime-based substrate trials by ENGIE Laborelec measured albedo at 0.70 after several weeks of weather exposure, lifting bifacial yield by up to 15% in the trial array. NREL’s HDPE reflector study at Golden, Colorado measured 2.6% incremental gain in arid Tucson conditions and 6.0% in cloudy Seattle conditions, demonstrating that overcast climates benefit more from engineered reflectors because diffuse light bounces multiple times.
For more details, see our guide on [solar energy forecasting software](/blog/solar-energy-forecasting-software).
Pro Tip
For engineered high-albedo surfaces, model with a 20-30% degradation factor over five years. White gravel turns gray with rainfall and dust. White paint chalks under UV. HDPE reflectors are the most stable but the most expensive. If the financial model relies on albedo above 0.40, plan an explicit albedo maintenance program in the O&M contract.
Driver 2: Elevation Above the Ground
The higher the module sits above the reflecting surface, the more ground area its rear side can “see.” Field studies have consistently shown that bifacial gain improves by 2-4 percentage points for every 0.5 m increase in minimum module height, up to approximately 2.0 m where diminishing returns set in.
| Minimum module height | Typical bifacial gain (fixed-tilt, 0.25 albedo) |
|---|---|
| 0.2 m (flush rooftop) | 2-4% |
| 0.5 m (low ground mount) | 5-7% |
| 0.8 m (standard rooftop ballast) | 6-9% |
| 1.0 m (utility “golden ratio”) | 8-11% |
| 1.5 m (elevated ground mount) | 9-13% |
| 2.0 m (agri-PV) | 10-14% |
| 3.0 m (high carport / agri-PV) | 11-15% |
The “golden ratio” for utility ground-mount ROI sits between 0.8 m and 1.1 m of minimum clearance. Below 0.5 m, the back of each module spends most of the day looking at its own shadow. Above 1.5 m, structural steel costs climb faster than the bifacial gain it unlocks. Wind loading on a 1.5 m hub is 60-90% higher than at 0.8 m, depending on terrain category.
Driver 3: Row Spacing (Ground Coverage Ratio)
Ground coverage ratio (GCR) is the row pitch divided by the module dimension along the slope. Tight GCR means densely packed rows; wide GCR means lots of space between rows.
Tighter GCR cuts bifacial gain through two mechanisms. The patch of sunlit ground each rear face can see shrinks as the next row blocks the view. Front-side self-shading at low sun angles also reduces direct irradiance and lengthens the period when the module looks at shadow rather than direct light.
NREL’s modeling for horizontal single-axis trackers shows that bifacial irradiance gain falls by roughly 1.5-2.5 percentage points per 0.10 increase in GCR, in the operating range of GCR 0.30 to 0.50. The same study notes that very wide GCR (below 0.30) adds rear-side gain but loses more front-side production through reduced land use efficiency, making intermediate GCR (0.35-0.40) the sweet spot for most projects.
Bifacial Gain by Mounting Type — The Field-Measured Master Table
This is the table you came here for. Numbers are pulled from NREL, Sandia, Nextracker, NEXTracker, Frontiers in Energy Research, Energy Science & Engineering, and three of our own audited projects in Spain, India, and the UK. Also see: Best Solar Design Software India. See our guide on 5kW Solar Panel Price in India for more.
| Mounting type | Low (poor site) | Typical (good design) | High (optimized) | Best for |
|---|---|---|---|---|
| Pitched residential rooftop | 1.5% | 2.5-4% | 5-7% | Snow-prone or white-roofed homes |
| Flat-roof ballast (low clearance) | 2% | 4-5% | 6-8% | Commercial flat roofs with TPO/PVC |
| Flat-roof racked (elevated) | 3% | 5-7% | 8-10% | C&I rooftop with light membrane |
| Carport (dark asphalt, low height) | 2% | 3-5% | 6-8% | Standard parking decks |
| Carport (light surface, tall height) | 6% | 10-14% | 18-22% | New-build commercial campuses |
| Fixed-tilt ground (cured grass) | 4% | 5-9% | 10-12% | Most European and North American utility sites |
| Fixed-tilt ground (white gravel) | 8% | 12-15% | 18-20% | Desert and engineered substrates |
| Horizontal single-axis tracker (HSAT) — natural ground | 5% | 8-11% | 13-15% | The dominant utility-scale configuration |
| Horizontal single-axis tracker (HSAT) — high albedo | 9% | 12-15% | 18-22% | High-DNI desert and snow regions |
| Dual-axis tracker | 8% | 12-16% | 18-22% | Niche — commercial demonstration |
| Floating PV (FPV) | 3% | 5-8% | 9-12% | Reservoirs and quarry lakes |
| Agri-PV elevated (south-facing) | 7% | 9-13% | 14-18% | Light-colored crops, animal husbandry |
| Vertical bifacial (east-west) | -5% (under-modeled) | 5-10% | 15-25% | High-latitude, snow-cover, agri-PV |
The “low” column reflects what happens when the modeler used a generic 0.20 albedo and the as-built site has degraded grass, low elevation, or tight GCR. The “high” column is what is achievable with the configuration optimized for bifacial — high albedo, taller posts, wider row spacing, and matched bifaciality factor.
Why the table is wide
Every mounting type has a 4x range from low to high. That is not modeling sloppiness — it is the physical reality. The same single-axis tracker delivers 5% gain on a dark, low-clearance site and 22% gain in a New Mexico desert with white gravel. If a vendor quotes a single bifacial gain number for your project without specifying albedo, GCR, hub height, and bifaciality factor, treat it as marketing copy.
Why Trackers Win the Bifacial Gain Race
Horizontal single-axis trackers (HSAT) are the dominant utility-scale mounting type in 2026, and they happen to be the configuration that maximizes bifacial gain. NREL’s seminal validation study (Deline et al., 2019, refreshed through 2025) measured bifacial irradiance gain of 4-15% on single-axis-tracked systems, with a global average of 9%. The high end of the range comes from three structural advantages. For Global-specific compliance details, see Global net-metering-by-country. For Global-specific compliance details, see Global solar-permitting-speed-by-country.
First, trackers tilt the module away from vertical for most of the day. At a 30° tracker tilt, the rear face sees about 40% of the local hemispheric sky — far more than a fixed-tilt module at the same site, which is hemmed in by the modules above and below.
Second, the tracking motion physically separates the module from its own shadow. At low sun angles, the module shadow lands several meters behind the array rather than directly underneath, leaving a brightly lit patch of ground for the rear face to look at. Sandia’s field data shows this effect strongly in winter: the bottom row of a fixed-tilt array gets 2-4 percentage points more bifacial gain than the top row because the bottom row sits closer to the bright patch.
Third, modern tracker control algorithms can deliberately backtrack to expose rear-side area during low-light or diffuse conditions. NREL has modeled smart tracking algorithms delivering more than 1% additional annual energy yield by adjusting tilt under cloudy conditions, on top of baseline bifacial gain.
For more details, see our guide on P50 and P90 energy yield explained.
Nextracker’s PVEL-validated field data, calibrated against PVsyst, shows the cleanest summary:
- Mono-PERC bifacial gain on a tracker under low-albedo conditions (~0.20): 5-7%
- Mono-PERC bifacial gain on a tracker under high-albedo conditions (~0.50): 10-12%
- TOPCon (80% bifaciality) lifts these by roughly 2 percentage points
- HJT (90%+ bifaciality) lifts them by another 1-2 percentage points
That puts a well-designed TOPCon tracker on a 0.40 albedo site at 11-13% bifacial gain in PVsyst, validated within 1-2 percentage points by field measurement.
Solar trackers also pair well with shadow analysis, because the shading patterns shift through the day and need to be modeled with sub-hourly resolution. Our solar designing software handles the bifacial-plus-tracker simulation end-to-end without requiring a separate ray-tracing pass.
Stop guessing bifacial gain. Model it.
SurgePV simulates bifacial gain for every mounting type with calibrated albedo, GCR, and bifaciality inputs — including single-axis trackers, dual-axis trackers, carports, and rooftop.
Book a DemoNo commitment required · 20 minutes · Live project walkthrough
Fixed-Tilt Ground Mount: The Workhorse
Fixed-tilt ground-mount is the second-largest segment by bifacial deployment, and the simplest to model. With no tracking motion to worry about, gain depends almost entirely on the three drivers: bifaciality, albedo, and elevation.
The Frontiers in Energy Research benchmark study (Grommes et al., March 2025) tested PVsyst against measured data at three fixed-tilt sites. PVsyst showed a -13.7% relative error at Heggelbach (Germany, grass substrate), a +13.2% error at Golden, Colorado (sandy substrate), and a -11.6% error at Florianópolis (Brazil, mixed substrate). Coefficient of determination ranged from 0.73 to 0.99. The takeaway: PVsyst is accurate within ~15% for well-calibrated fixed-tilt sites, and the dominant source of error is the albedo input. Also see: Germany solar subsidies.
The Indian study at Hyderabad (IJSAT, 2026), based on a one-year field log from September 2023 to August 2024, measured bifacial gains up to 19.24% on a fixed-tilt array — well above the global average. The driver was the combination of dry, light-colored ground (effective albedo ~0.35), strong direct beam irradiance, and a relatively tall mounting structure.
The Norwegian study (ScienceDirect) at a 22.6 kWp fixed-tilt ground-mounted site collected two years of data and highlighted a calibration trap: the choice of monofacial reference module shifts the apparent bifacial gain by up to 6.3 percentage points. If the bifacial array is compared against a PERC reference, the gain looks larger; against a TOPCon mono reference, it looks smaller. This matters for performance-guarantee disputes and PPA accounting.
| Site | Geography | Mounting | Measured bifacial gain | Notes |
|---|---|---|---|---|
| Heggelbach | Germany | Fixed-tilt, grass | ~10-12% | PVsyst overestimated by 13.7% |
| Golden, CO | USA | Fixed-tilt, sandy | ~11% | PVsyst underestimated by 13.2% |
| Florianópolis | Brazil | Fixed-tilt, mixed | ~9% | PVsyst underestimated by 11.6% |
| Hyderabad | India | Fixed-tilt, dry ground | 19.24% | Strong DNI + high albedo |
| Bergen | Norway | Fixed-tilt, snow-cover | 8-12% annual, 25%+ winter | Reference module matters |
| Sandia, NM | USA | Fixed-tilt, gravel | 7-16% during winter solstice test | Bottom row outperformed top by 2-4 ppt |
Single-Axis Trackers: Field Numbers and Pitfalls
Beyond the headline gain numbers, three pitfalls show up repeatedly in tracker bifacial performance disputes.
Torque tube shadow loss. Center-mounted torque tubes cast a shadow on the rear face that NREL’s ray-tracing simulations show can cost up to 20% of rear irradiance. This loss is structural and cannot be designed around. Tube-on-edge designs (offset from the cell area) cut this loss to 5-8%, which is one of the practical reasons mid-size tracker OEMs have moved away from center tubes on bifacial-rated systems.
Edge brightening on row ends. Modules at the end of a tracker row receive 15-25% more rear irradiance than modules in the middle, because the end modules see unobstructed sky and ground to the side. This is real production, but it is hard to predict in tools that treat trackers as “infinite rows.”
Backtracking choices. Standard astronomical backtracking moves the tracker to a steep tilt at sunrise and sunset to avoid row-on-row shading. Bifacial-aware tracking algorithms instead optimize total energy by accepting some front-side shading in exchange for higher rear-side production. Smart trackers now incorporate this logic by default, but it has to be enabled and tuned — a 2026 default-off setting will quietly cost 1-2% of annual energy.
For high-DNI tracker sites with engineered substrate, NREL’s upper-bound model shows BGmodel reaching 20% under favorable conditions (GCR = 0.35, hub height = 0.75 m, 100% bifaciality). This is rarely achieved in the field because production modules cap at ~92% bifaciality, but it sets the theoretical ceiling.
Why Most Bifacial Modeling Overstates Rooftop Gain
Most rooftop bifacial proposals we have audited overstate gain by 2-4 percentage points. The reason is rarely the simulation tool. It is that the default modeling assumptions — grass-equivalent albedo, no structure shading, infinite-shed geometry — do not match what actually happens on a real roof.
Three structural problems are baked into rooftop bifacial:
Low elevation kills rear irradiance. A pitched residential roof sits the module 5-15 cm above a dark shingle surface. A flat-roof ballast system sits modules 10-25 cm above an EPDM, TPO, or gravel ballast layer. Neither configuration leaves enough air gap for diffuse light to bounce productively. Field-measured bifacial gain on standard residential rooftop installations sits at 2-4%, not the 6-8% that vendor proposals often quote.
Structural mounting elements block the rear face. Rooftop ballast trays, ballast trays’ rails, and the ballast pads themselves cover 20-40% of the rear-facing area. Pitched-roof rail-and-bracket mounting blocks 5-15%. Vendor datasheets and PVsyst infinite-shed models do not account for this structural shading.
Roof surface albedo is usually low. Most residential roofing materials (asphalt shingle, terracotta tile, slate) sit at 0.10-0.20 albedo. White TPO and PVC membranes on commercial flat roofs can reach 0.55-0.65 when new, but that is the exception, not the default. Black EPDM is closer to 0.08.
A useful sanity check: if a rooftop bifacial proposal projects more than 6% gain on a pitched residential roof, ask the proposer for the modeled albedo, the measured air gap to the roof surface, and the structural shading factor applied. Most of the time, one of these three inputs has been left at PVsyst defaults that do not apply to a real rooftop.
When rooftop bifacial does work
Commercial flat roofs with white TPO membranes, racked at 30+ cm clearance and oriented for east-west bifacial layout, can hit 6-8% gain. Pitched roofs in snow-prone regions can hit 10-15% during winter months thanks to snow albedo. The point is not that rooftop bifacial never works — it is that the default assumptions in most proposals are wrong by 2-4 percentage points.
Carport Bifacial: The Tucson Outlier
Bifacial carports are the most variable mounting type. Gain depends almost entirely on the surface beneath, the canopy height, and the orientation. Two case studies bracket the range.
The Tucson, Arizona Prism Solar carport (36 modules, 90% bifaciality, Sunnyboy 8000US inverter) was installed at 10 ft (3.0 m) minimum clearance, east-facing at 7° tilt, over a light-colored crushed-rock substrate measuring 0.40 albedo. The Prism Solar bifacial model projected 21.4% annual bifacial gain. Measured field data confirmed the modeled performance within 2.74% across NREL Prospector and TMY3 datasets. This is the high end of what is achievable on a carport.
The Korean peninsula carport study (Hwang et al., Energy Science & Engineering, 2023), based on one year of monitoring, reported energy yield ratios of 106.6% in January and 108.5% in December (peak winter months with snow contribution) versus 100.7-104.6% across the rest of the year. The annual average bifacial gain was modest — around 4-6% — driven by a standard parking-lot asphalt substrate and lower clearance than the Tucson reference site.
The gap between Tucson (21.4%) and Korea (4-6%) is almost entirely about the surface beneath the canopy and the height above it. Commercial carport developers in 2026 should expect to design for one of two outcomes:
- Standard carport over aged asphalt, 2.5-3 m clearance: 3-5% bifacial gain. The premium for bifacial modules rarely pays back within the typical 6-8 year corporate ROI window.
- Engineered carport over light substrate, 3.5+ m clearance: 12-18% bifacial gain. The premium pays back inside 3-4 years and the asset operates with higher-quality components for 30+ years.
The middle ground — bifacial modules dropped onto an aging asphalt carport — is the worst outcome. The owner pays the premium and gets gain barely above monofacial.
Floating PV: The Surprise Performer
Floating PV (FPV) sits over a water surface with albedo that depends on the water condition. Clean water has albedo around 0.06-0.10, which is lower than most ground surfaces. But the cooling effect of evaporative water lifts module efficiency by 1.5-3% annually, and the elevation of the modules above the water tends to be 0.4-0.8 m on most commercial FPV systems.
Combined, floating bifacial typically delivers 5-10% gain when the water surface is clean and a few percentage points lower when the water is dark with algae or sediment. The dominant value of bifacial on FPV is not the gain — it is the option to use double-glass modules that survive the high-humidity environment better than backsheet modules.
Agri-PV Elevated: High Clearance Pays
Agrivoltaic systems with light-colored crops can achieve 15-20% bifacial gain because they combine three favorable conditions: tall clearance (typically 2-4 m to permit machinery), light-colored crops or grazing animals beneath, and wide row spacing (low GCR) for crop access.
A 2025 SunSolve and PVsyst comparison study for agri-PV configurations found that PVsyst struggles with curved or dome-shaped agri-PV geometries — the tool does not permit bifacial dome simulations directly and forces a workaround of two infinite-shed east/west systems. For straight-row elevated agri-PV on south-facing fixed-tilt or single-axis-tracked geometry, PVsyst remains within 10-15% of measured values.
See also: agrivoltaics systems guide.
A common agri-PV configuration we have audited:
- 2.5 m clearance over hay or pasture
- GCR 0.30-0.35 (wide for tractor access)
- TOPCon bifacial at 80% bifaciality
- Albedo 0.20-0.25 for hay, up to 0.30 for cleared grazing
This delivers 10-13% bifacial gain in PVsyst, validated within ~1 percentage point by field measurement at three German and Dutch projects we have data on.
Vertical Bifacial East-West: The Modeling Frontier
Vertical bifacial east-west arrays are emerging as a niche for high-latitude, agri-PV, and snow-cover sites. Both faces of the module are productive — the east face in the morning, the west face in the afternoon — and there is no specific “rear” face in the conventional sense.
NREL’s July 2025 vertical bifacial validation study compared five models against field data in Golden, Colorado (40°N) and Fairbanks, Alaska (65°N). The results are sobering for designers used to PVsyst:
- Bifacial_radiance, bifacialVF, SAM, and DUET achieved RMSE of 11-28% depending on location and orientation
- PVsyst v7.4.8 showed RMSE of 33-45%, with the gap driven by hourly resolution limits
- Deviations between model-predicted annual insolation tend to be 2-3x higher for vertical PV than south-facing fixed-tilt
- The same issues appear in PVsyst v8.0.6 (released late 2024)
For vertical bifacial design in 2026, the practical guidance is to use bifacial_radiance (open-source) or BifacialSimu (German engineering tool) for primary modeling and PVsyst only as a cross-check. The annual energy estimate can be off by a factor of 1.5x or more if PVsyst is used as the sole tool for a high-latitude vertical project.
How to Engineer for Maximum Bifacial Gain
Across the four mounting types where bifacial gain is meaningful (ground-mount, tracker, carport, agri-PV), the design optimization checklist is the same. Six levers, in order of impact.
1. Match the bifaciality factor to project economics. TOPCon at 80% is the 2026 default for utility-scale. HJT at 90%+ adds 2-3 percentage points of gain at a 5-12% module-cost premium — pencils on high-DNI sites with PPAs below $0.08/kWh. PERC at 70% should not be specified for new builds.
2. Engineer the albedo to 0.40+. Natural cured grass at 0.20-0.25 leaves bifacial gain on the table. White gravel (0.50-0.60) lifts gain by 3-5 percentage points and costs $0.10-0.25/m² installed. Maintain through O&M with weed barrier and periodic top-up.
3. Set hub height to 1.0-1.2 m for ground-mount. Below 0.8 m, gain is constrained. Above 1.5 m, structural cost grows faster than gain. The Pareto-optimal sweet spot is 1.0-1.2 m.
4. Target GCR 0.35-0.40 for fixed-tilt; 0.30-0.40 for trackers. Wider GCR adds gain but consumes more land. Tighter GCR cuts both rear and front irradiance.
5. Specify a tube-on-edge tracker design. Center-mounted torque tubes cost up to 20% of rear irradiance through structural shadow. Tube-on-edge keeps this loss to 5-8%.
6. Enable bifacial-aware tracker control. Smart backtracking algorithms deliver 1-2% additional annual energy by accepting limited front-side shading in exchange for rear-side gain. Most modern trackers ship with this capability but require it to be enabled.
Use a generation and financial tool to test the LCOE impact of each lever. A 3 percentage-point shift in bifacial gain often moves the IRR by 50-90 basis points on utility projects, which is enough to change the financing structure.
Modeling Tool Accuracy: Honest Numbers
PVsyst, bifacial_radiance, BifacialSimu, SunSolve, SAM, and DUET are the six modeling tools we see in production use. Each has a defensible accuracy envelope and a region where it breaks.
| Tool | Strengths | Accuracy band (validated) | Where it breaks |
|---|---|---|---|
| PVsyst v8.x | Industry standard, calibrated for bankability | ±10-15% on fixed-tilt and tracker | Vertical, dome, agri-PV; RMSE up to 45% |
| bifacial_radiance (open-source, NREL) | Ray-tracing accuracy, free | ±5-10% on most geometries | Steep learning curve, slow runtimes |
| BifacialSimu (German, open-source) | Ray-tracing with detailed structural | ±5-10% on most geometries | Limited adoption outside Europe |
| SunSolve (Australian commercial) | Agri-PV and complex geometries | ±5-12% | Commercial licensing cost |
| SAM (NREL, free) | Strong vertical and tracker | ±10-15% | Less granular than PVsyst for finance |
| DUET (dual-sided energy tracer) | Validated by NREL | ±8-13% | Niche tool, limited support |
For utility-scale projects in 2026, the bankable workflow is: PVsyst as primary, bifacial_radiance as ray-tracing cross-check on representative blocks, and an as-built calibration after the first year to recalibrate albedo, structural shading, and bifaciality factors. Skipping the cross-check and the calibration is what produces the 3.5 percentage-point gap we opened this guide with.
Decision Matrix: Bifacial vs Monofacial by Site
| Site type | Albedo | Module type recommendation | Expected bifacial gain | Premium justified? |
|---|---|---|---|---|
| Pitched residential roof, dark shingle | 0.10-0.15 | Monofacial TOPCon | 2-4% | No — premium does not pay back |
| Pitched residential roof, light tile | 0.15-0.25 | Bifacial TOPCon (marginal) | 3-5% | Marginal — only if snow common |
| Flat commercial roof, EPDM | 0.08-0.12 | Monofacial TOPCon | 2-3% | No |
| Flat commercial roof, white TPO | 0.50-0.65 | Bifacial TOPCon, raised racking | 6-8% | Yes |
| Carport over aged asphalt | 0.10-0.15 | Monofacial TOPCon | 3-5% | No |
| Carport over white gravel/painted | 0.40-0.55 | Bifacial HJT, 3+ m clearance | 12-18% | Yes |
| Fixed-tilt utility, grass | 0.20-0.25 | Bifacial TOPCon | 5-9% | Marginal, project-dependent |
| Fixed-tilt utility, gravel/sand | 0.30-0.40 | Bifacial TOPCon | 9-13% | Yes |
| Single-axis tracker, grass | 0.20-0.25 | Bifacial TOPCon | 8-11% | Yes |
| Single-axis tracker, gravel/sand | 0.30-0.40 | Bifacial TOPCon or HJT | 11-15% | Yes |
| Single-axis tracker, white gravel engineered | 0.50-0.60 | Bifacial HJT | 14-20% | Yes (strong) |
| Floating PV | 0.06-0.10 water | Bifacial TOPCon | 5-8% | Yes (durability driver) |
| Agri-PV elevated, light crops | 0.25-0.35 | Bifacial TOPCon, 2.5+ m clearance | 10-14% | Yes |
| Nordic / snow-prone fixed-tilt | 0.50-0.85 winter | Bifacial TOPCon | 8-12% annual, 25%+ winter | Yes (seasonal driver) |
Real Project Economics: Three Audited Cases
Three projects we have audited in 2024-2025 illustrate the range.
Project A — 12 MW HSAT in northern Spain (the case we opened with). TOPCon bifacial at 80% bifaciality, GCR 0.43, hub height 0.95 m, cured grass at 0.20 albedo. Modeled bifacial gain: 11.4%. Measured year-1 gain: 7.9%. The 3.5 percentage-point gap traced to lower-than-modeled albedo (0.20 vs 0.25), tighter GCR (0.43 vs 0.38), and lower hub height (0.95 m vs 1.10 m). Annual energy shortfall: 580 MWh.
Project B — 4 MW fixed-tilt in Rajasthan, India. TOPCon bifacial at 80% bifaciality, GCR 0.38, hub height 1.20 m, dry desert ground at 0.32 albedo. Modeled bifacial gain: 12.8%. Measured year-1 gain: 13.4%. Slight outperformance driven by stronger-than-modeled DNI and clean ground conditions.
Project C — 280 kWp commercial carport in Birmingham, UK. TOPCon bifacial at 80% bifaciality, 3.2 m clearance, light-grey concrete substrate at 0.30 albedo. Modeled bifacial gain: 8.4%. Measured year-1 gain: 9.1%. Slight outperformance driven by better-than-expected diffuse light capture in the UK climate. Read more about Battery Solar System Design UK.
The pattern: ground-mount and tracker projects under-deliver against the model when the as-built site does not match the design assumptions; carport and high-albedo projects tend to match or beat the model because the engineered surface is what was specified.
Conclusion — What to Do Next
Bifacial gain is real, it is bankable, and it is measurable — but only if the design assumptions match what gets built.
Three concrete actions for designers and developers in 2026:
- Treat bifaciality factor as a design parameter, not a label. Use 80% (TOPCon) as the 2026 design default and explicitly cost the upgrade to 90% (HJT) on high-DNI tracker sites.
- Engineer the albedo deliberately. Natural ground albedo of 0.20-0.25 leaves 3-5 percentage points of gain on the table. White gravel, white paint, or HDPE reflectors cost $0.10-0.50/m² and pay back inside 3-4 years on most utility projects.
- Cross-check PVsyst with ray-tracing for any non-standard geometry. Vertical bifacial, agri-PV, and dome systems can have PVsyst RMSE of 33-45%. Run bifacial_radiance or BifacialSimu on representative blocks before signing a PPA.
Model your next project end-to-end in SurgePV — bifacial gain, shadow analysis, and financial modeling in one platform, calibrated for the 2026 module fleet.
Frequently Asked Questions
What is a realistic bifacial gain by mounting type in 2026?
Single-axis trackers deliver 8-15% gain in most utility projects. Fixed-tilt ground-mount delivers 5-12%. Carports deliver 3-8%, with outliers up to 18% on very tall, light-surface designs. Rooftop sits at 2-7%. These are field-measured ranges, not vendor claims.
Why is bifacial gain higher on trackers than fixed-tilt?
Trackers tilt the module away from vertical for most of the day, exposing more rear surface to ground-reflected light. They also keep the module further from its own shadow at low sun angles. NREL field data from Albuquerque and Oregon shows 9-15% monthly rear irradiance gain on horizontal single-axis trackers at standard 0.75 m hub height.
Does ground albedo really double bifacial gain?
Roughly yes. Going from 0.20 grass to 0.50 white gravel typically lifts gain from 5-7% to 10-14% on a fixed-tilt ground mount. NREL’s HDPE reflector trials measured 2.6% additional gain in arid Tucson and 6.0% in cloudy Seattle, on top of the baseline.
Are bifacial carports worth the extra cost?
On light-colored asphalt or concrete with high clearance, yes. The Tucson Prism Solar carport (10 ft height, crushed-rock substrate) measured 20%+ bifacial gain. On dark asphalt with low canopy, gain falls to 3-5% and the structural premium rarely pays back.
What bifaciality factor should I assume for design in 2026?
TOPCon modules ship at 80-85% bifaciality, HJT at 85-95%, and legacy PERC at 65-75%. Most new utility projects use TOPCon at 80% as the design assumption. Always use the datasheet value, not the marketing number.
How accurate is PVsyst for bifacial gain?
Validated against field data, PVsyst typically lands within 10-15% relative error on conventional fixed-tilt and tracker geometries when albedo and module parameters are calibrated. For vertical bifacial or agri-PV, RMSE can rise to 33-45% and you should use a ray-tracing tool like bifacial_radiance or BifacialSimu.
Does bifacial gain reduce as row spacing tightens?
Yes. Tighter ground coverage ratios (GCR) shrink the patch of sunlit ground each rear face sees. Going from GCR 0.35 to GCR 0.50 typically cuts bifacial gain by 2-4 percentage points and adds front-side self-shading on top of that.
Can rooftop bifacial ever justify the premium?
Only on flat roofs with white TPO or PVC membranes, raised racking 30+ cm above the surface, and wide row spacing. Most pitched residential roofs sit at 2-4% gain, which rarely covers the module premium unless snow cover is frequent. Solar design software automates design and compliance. Solar proposal software generates professional quotes in minutes.


