

Answer
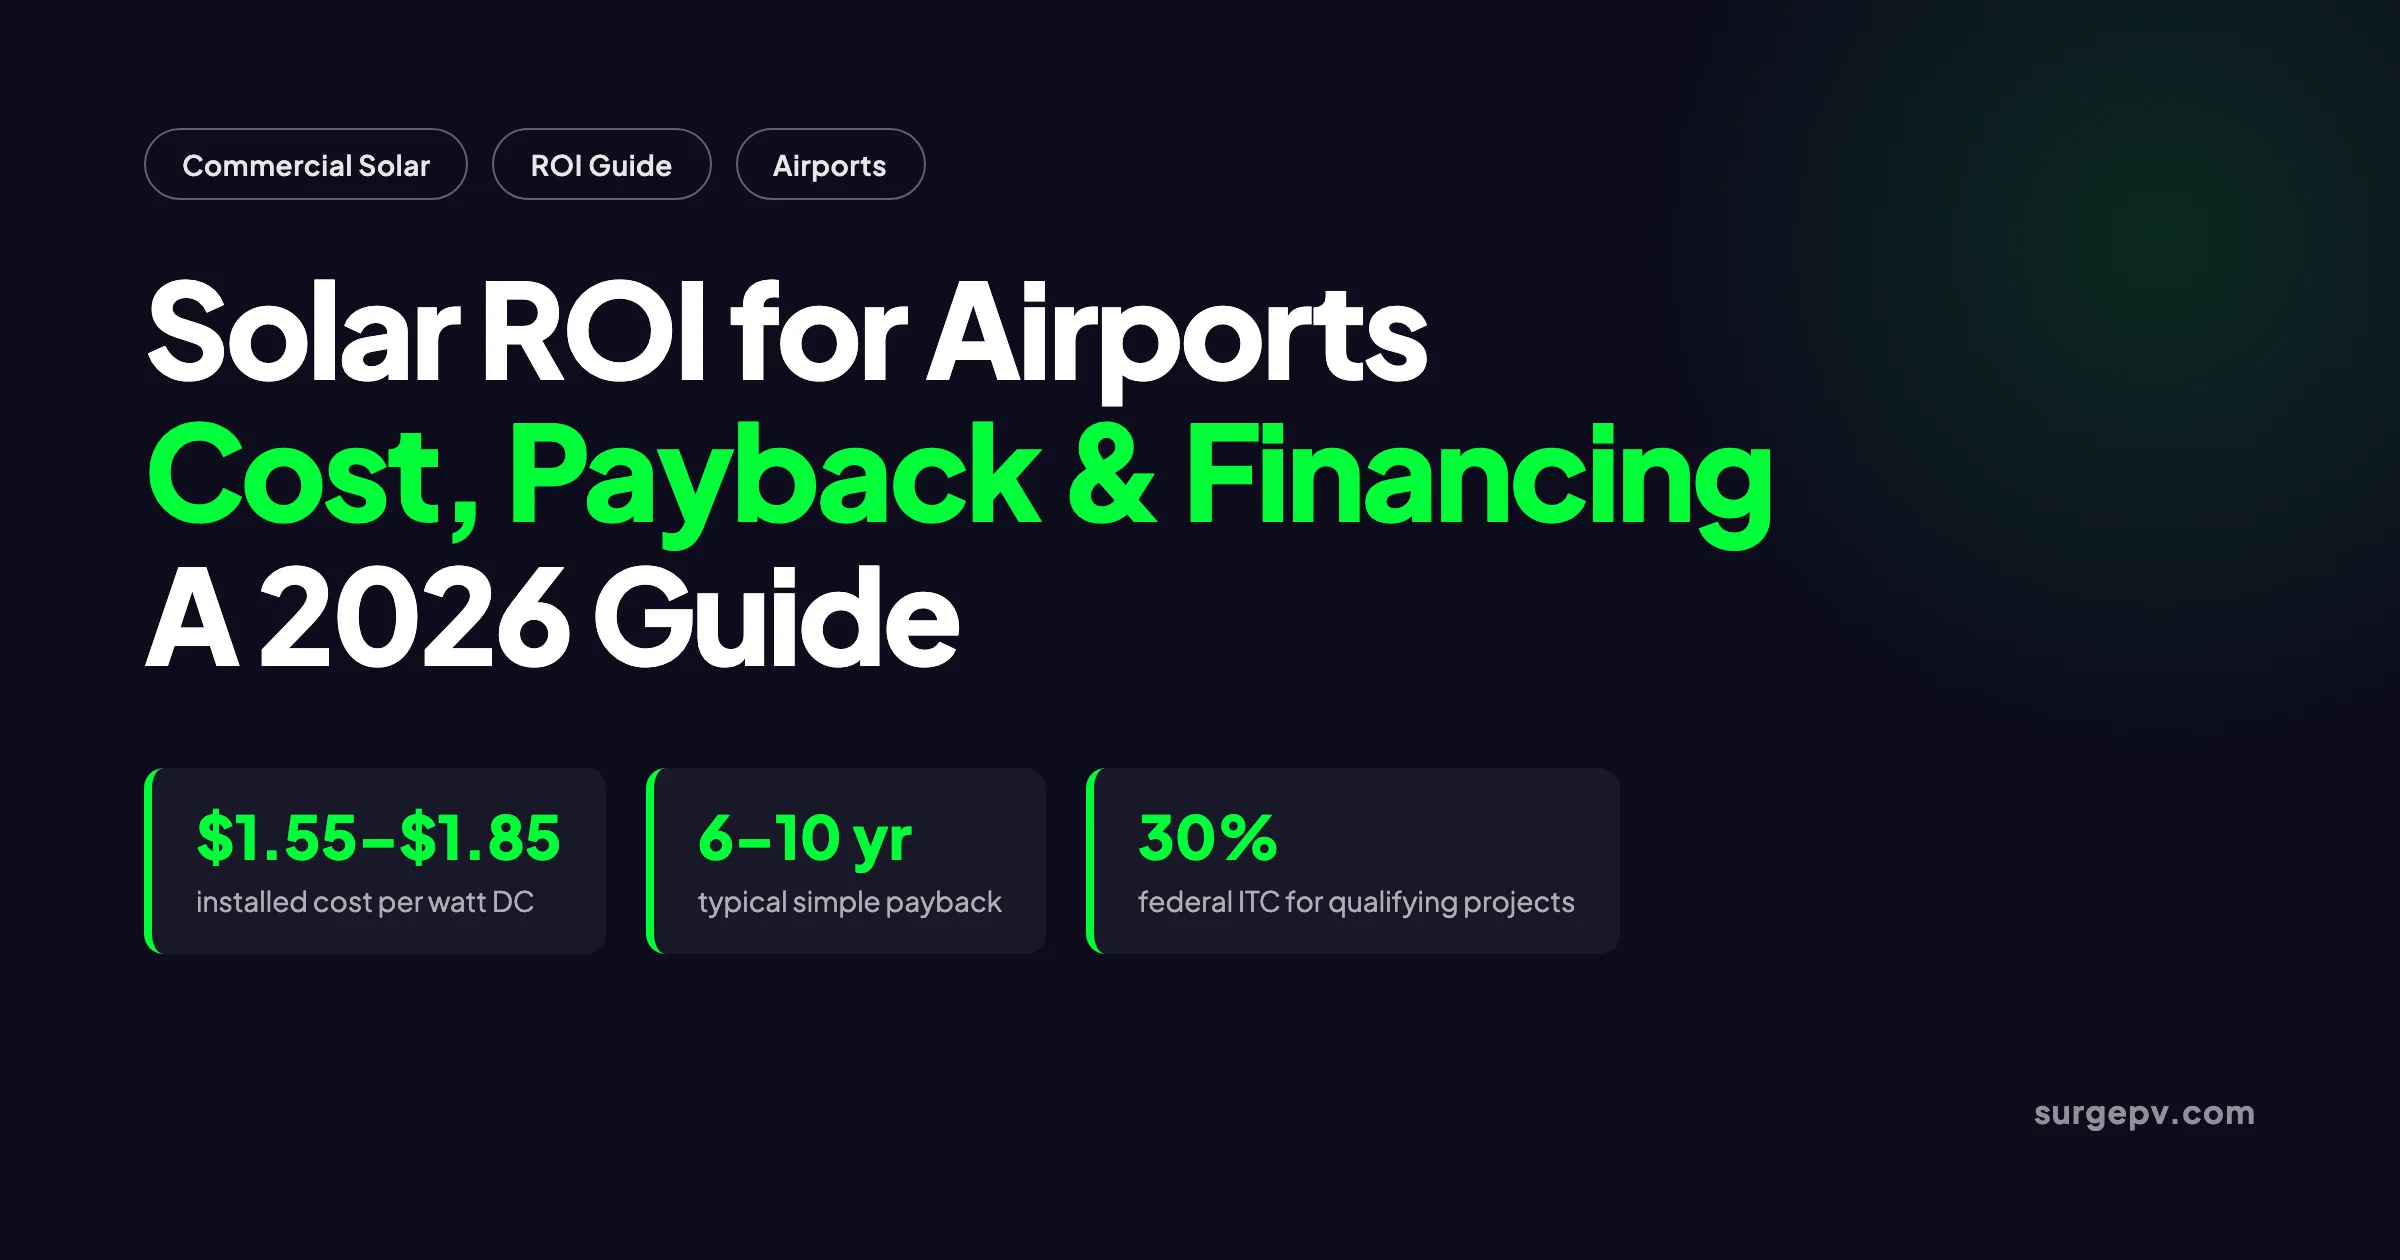
Airport solar ROI in the U.S. typically delivers a 10 to 16 percent unlevered IRR and a 6 to 10 year simple payback after the 30 percent federal ITC. A 2 MW airport solar system costs roughly $3.1 million to $3.7 million before incentives. Annual savings range from $350,000 to $600,000, depending on local commercial rates, self-consumption, available land or rooftop, and FAA coordination costs.
Airports are energy-intensive campuses disguised as transportation facilities. A medium-sized commercial airport can spend $2 million to $5 million per year on electricity, while large hubs spend far more. At the same time, airports own vast, flat surfaces: terminal roofs, cargo hangars, parking structures, and open land near runways. Those surfaces are almost purpose-built for solar.
In 2026, the financial case has become direct. Commercial electricity rates averaged 13.51 cents per kWh in April 2026, up 4.8 percent year over year, according to the U.S. Energy Information Administration. In California and the Northeast, large commercial users regularly pay more than 20 cents per kWh. Sacramento International Airport’s 35-acre solar farm generates 15.5 million kWh annually and saves roughly $850,000 each year, according to a case study in the Nature journal review of airport solar integration (2025). Kuala Lumpur International Airport saves approximately $627,000 annually with its 19 MW system, and Cochin International Airport in India eliminated an estimated $780,000 in annual electricity expenses after adding 12 MW of solar.
This guide is written for airport managers, sustainability directors, facilities teams, solar installers, and EPCs bidding on aviation assets. It explains how to calculate solar ROI for an airport, what system sizing and financing assumptions matter, and where the numbers can go wrong. We use 2026 market data, named sources, and a worked example you can replicate for a specific site.
If you are modeling a portfolio of airports, campuses, or commercial buildings, use SurgePV’s cloud solar design platform. It imports interval data, runs solar shading analysis, and exports permit-ready plans. The platform also models commercial solar tariffs, demand charges, and incentive stacks in one workflow.
Quick Answer
Airport solar ROI in the U.S. typically delivers a 10 to 16 percent unlevered IRR and a 6 to 10 year simple payback after the 30 percent federal ITC. A 2 MW airport solar system costs roughly $3.1 million to $3.7 million before incentives. Annual savings range from $350,000 to $600,000, depending on local commercial rates, self-consumption, available land or rooftop, and FAA coordination costs.
In this guide:
- Why airport solar ROI is different from typical commercial solar
- How much energy an airport solar system produces
- What an airport solar system costs in 2026
- The full 2026 incentive stack: ITC, MACRS, FAA VALE, and state programs
- Ownership, loan, PPA, and lease trade-offs for airports
- A worked ROI example for a 2 MW airport solar system
- Airport-specific revenue streams and value beyond kWh savings
- Common mistakes that kill airport solar returns
- When airport solar does not make sense
- FAQ with 10 airport solar ROI questions
Why Airport Solar ROI Is Different
An airport is not a warehouse or a shopping mall. It is a 24-hour campus with strict safety, security, and regulatory requirements. Those requirements change every part of the ROI calculation.
The first difference is load shape. Airports consume electricity continuously: terminals run lighting, HVAC, baggage systems, and passenger processing from early morning until late night. Hangars and cargo facilities operate on their own schedules. Ground support equipment, gate electrification, and pre-conditioned air units add steady daytime demand. That daytime demand aligns well with solar production, so self-consumption rates are typically high.
The second difference is available area. A single terminal roof can cover several acres. Add cargo buildings, parking structures, and adjacent open land, and an airport can often host multi-megawatt systems without acquiring new land. Denver International Airport has roughly 8 MW of onsite solar, and Indianapolis International Airport hosts a 17.5 MW solar farm across 183 acres, according to the Nature review of airport solar projects (2025).
The third difference is the regulatory overlay. Any installation near a runway requires a glare study, FAA coordination, and often a determination of no hazard to air navigation. Projects must meet Airport Improvement Program grant assurances, Buy American requirements, and security screening for contractors. These steps add time and cost but are non-negotiable.
The fourth difference is resilience value. Airports cannot afford extended outages. Solar paired with battery storage can keep critical loads online during grid failures. Chattanooga Metropolitan Airport operates a 2.74 MW solar and battery microgrid that can run the entire airport off-grid, according to the same Nature review (2025). That resilience is hard to put in a standard ROI model but increasingly important to airport leadership.
For a deeper look at the design side, read our guide to commercial solar system design. The structural and electrical logic is similar, even though the ROI conversation adds aviation-specific layers.
How Much Energy an Airport Solar System Produces
A credible ROI model starts with an accurate production estimate. Airport solar output depends on system size, module efficiency, local solar resource, and shading from control towers or terminal structures.
A standard flat commercial roof or ground-mount site accommodates roughly 8 to 12 watts of DC capacity per square foot, depending on row spacing and structural limits. A 10-acre parcel can host roughly 1.5 to 2.5 MW of ground-mount solar. A 500,000 square foot terminal roof can host 2 to 4 MW, assuming the structure can carry the load.
Annual production per installed kilowatt varies by location:
- Phoenix, Arizona: 1,650 to 1,750 kWh/kW/year
- Los Angeles, California: 1,450 to 1,550 kWh/kW/year
- Dallas, Texas: 1,400 to 1,500 kWh/kW/year
- Miami, Florida: 1,350 to 1,450 kWh/kW/year
- New York, New York: 1,200 to 1,300 kWh/kW/year
- Seattle, Washington: 950 to 1,050 kWh/kW/year
A 2 MW airport solar system in Los Angeles therefore produces roughly 2.9 million to 3.1 million kWh per year. The same system in New York produces roughly 2.4 million to 2.6 million kWh per year. These numbers assume standard monofacial modules, a 1.5 performance ratio, and minimal shading. Bifacial modules mounted over light concrete or gravel can add 5 to 10 percent yield from rear-side reflection.
Self-consumption is the critical financial variable. If the array serves a terminal or cargo building with steady daytime load, 70 to 90 percent of generation may be used on site. If the array exports most of its generation under a net-billing program, the effective value of those kilowatt-hours drops sharply. A good feasibility study models hourly load against hourly generation, not just annual totals.
What an Airport Solar System Costs in 2026
A credible ROI model starts with an accurate installed cost. The table below blends the latest benchmark data for commercial solar projects.
| Cost component | Benchmark value | Source |
|---|---|---|
| Commercial rooftop PV, NREL 2024 benchmark | $1.55/Wdc | NREL cost benchmarks |
| Commercial rooftop PV, SEIA/WoodMac Q3 2025 market price | $1.71/Wdc | SEIA Solar Market Insight Report Q4 2025 |
| Ground-mount commercial PV | $1.20–$1.60/Wdc | Industry range for large open sites |
| Airport-specific adders: glare study, FAA coordination, security | $0.10–$0.30/Wdc | Typical for aviation projects |
| Structural engineering and roof reinforcement | $0.10–$0.40/Wdc | Variable by roof age and design |
| Soft costs, permitting, interconnection | $0.30–$0.50/Wdc | Typical for distributed commercial projects |
| Annual O&M | $10–$15/kW-year | Cleaning, monitoring, inspections |
| Inverter replacement reserve | $0.15–$0.25/Wdc in year 12–15 | Budgeted over system life |
For planning, use $1.55 to $1.85 per watt DC for a standard airport rooftop or ground-mount project and $2.00 to $2.50 per watt DC for carport canopies or projects requiring significant roof reinforcement. The airport-specific adders are the reason airport solar can cost 10 to 20 percent more than a generic commercial rooftop project of the same size.
Operating costs are low but persistent. Budget $10 to $15 per kW per year for O&M, plus property insurance and an inverter replacement reserve. Over 25 years, these costs are typically 5 to 10 percent of the upfront capital cost. Ignoring them makes payback look shorter than it really is.
The Full 2026 Incentive Stack
Federal incentives remain the largest driver of airport solar ROI in 2026, but the rules have tightened. The Inflation Reduction Act’s Section 48E Clean Electricity Investment Credit provides a 30 percent tax credit for qualifying commercial solar. To secure the full credit, projects generally must be placed in service by December 31, 2027. Projects that began construction by July 4, 2026 may also qualify under continuity rules, according to IRS Instructions for Form 3468.
Bonus credits can raise the effective credit above 30 percent:
- Domestic content bonus: up to 10 percent additional credit for projects using U.S.-made steel, iron, and manufactured products.
- Energy community bonus: up to 10 percent additional credit for projects located in census tracts tied to fossil fuel employment or brownfield sites.
- Low-income bonus: up to 10 or 20 percent additional credit for qualified projects under 5 MWac.
For most airport projects, the base 30 percent ITC is the realistic starting point. Bonus credits require documentation and sometimes competitive allocation, so do not model them until eligibility is confirmed.
MACRS depreciation is the second major federal benefit. Commercial solar qualifies for five-year accelerated depreciation. In 2026, 100 percent bonus depreciation may still apply, allowing the entire depreciable basis to be written off in year one. Even without bonus depreciation, the present value of MACRS depreciation typically equals 20 to 25 percent of project cost for a taxpayer in the 21 percent federal corporate bracket.
FAA VALE grants can be a third source of funding. The Voluntary Airport Low Emission program allows airports to use Airport Improvement Program funds and Passenger Facility Charges for projects that reduce emissions, including solar energy systems. As of October 2023, VALE grants had funded 141 projects at 58 airports, according to the FAA VALE program page (updated March 2026). Sponsor reimbursement is at least 75 percent for large to medium hubs and 90 percent for small hubs.
State and utility incentives vary widely. California, Massachusetts, New York, and New Jersey have strong programs. Some states offer solar renewable energy certificates (SRECs) or community solar credits. The best place to check current programs is the Database of State Incentives for Renewables and Efficiency.
Net metering and net billing rules matter as much as incentives. Full retail net metering lets exported kilowatt-hours offset future usage at the retail rate. Net billing pays only avoided-cost or wholesale rates for exports. In net-billing markets, the financial case depends on self-consumption, not just total production.
Ownership, Loan, PPA, and Lease Trade-offs
The financing structure changes the ROI profile as much as the hardware or tariff.
Cash purchase captures the full 30 percent ITC, MACRS depreciation, and all long-term savings. It produces the highest lifetime ROI and the simplest ownership structure. The drawback is capital deployment and balance sheet impact. For a 2 MW airport solar system at $1.70/Wdc, cash purchase requires roughly $3.4 million before incentives and roughly $2.38 million after the ITC.
Loan financing preserves some cash and still lets the owner capture tax benefits. A 70 percent loan at 6 to 8 percent interest over 10 years typically produces a higher return on equity than an all-cash deal, because the borrower earns returns on the full system while only putting down 30 percent. The trade-off is interest expense and debt service coverage requirements.
Power purchase agreement (PPA) transfers ownership, tax benefits, and O&M risk to an investor. The host pays a fixed rate per kilowatt-hour, usually 10 to 30 percent below the utility rate, with a 2 to 3 percent annual escalator. A PPA preserves capital and transfers risk but produces lower lifetime savings than ownership. It works well for municipally owned airports with limited tax appetite or capital constraints.
Operating lease is similar to a PPA in cash-flow profile but usually structured as a lease payment rather than a per-kilowatt-hour charge. Leases are less common for commercial solar today because they complicate the ITC transfer and often produce weaker returns than well-structured PPAs.
| Financing option | Upfront cost | Tax benefit | O&M risk | Typical IRR range |
|---|---|---|---|---|
| Cash purchase | High | Owner keeps | Owner | 12–16% |
| Loan | Medium | Owner keeps | Owner | 15–22% on equity |
| PPA | Zero | Investor keeps | Investor | N/A — savings only |
| Lease | Low | Lessor keeps | Lessor | Lower than PPA |
The right choice depends on tax appetite, balance sheet capacity, and whether the airport authority can use the ITC directly. Many municipal airports cannot, which makes PPAs the practical choice.
Worked ROI Example: 2 MW Airport Solar System
Here is a fully transparent example you can replicate. The inputs are intentionally middle-of-the-road so you can substitute your own numbers.
Project assumptions:
- Location: California metro
- System size: 2,000 kW DC
- Specific yield: 1,500 kWh/kW/year
- Annual production: 3,000,000 kWh
- Self-consumption rate: 75% against terminal and cargo loads
- Exported generation: 25%
- Commercial electricity rate: $0.18/kWh
- Export credit rate: $0.07/kWh
- Installed cost: $1.70/Wdc
- Federal ITC: 30%
- MACRS depreciation: 5-year schedule
- Annual O&M: $12/kW-year
- Analysis period: 25 years
Upfront cost:
2,000 kW × $1.70/Wdc = $3,400,000
Less 30% ITC = $1,020,000
Net capital after ITC = $2,380,000
First-year savings:
- Self-consumed: 3,000,000 kWh × 75% × $0.18 = $405,000
- Exported: 3,000,000 kWh × 25% × $0.07 = $52,500
- Gross energy value = $457,500
- Less O&M: 2,000 kW × $12 = $24,000
- Net first-year savings = $433,500
Simple payback:
$2,380,000 ÷ $433,500 = 5.5 years
That is before MACRS. Adding the present value of MACRS depreciation, roughly $510,000 to $600,000 for a 21 percent taxpayer, drops the effective net cost to roughly $1.78 million to $1.87 million. After-tax payback then falls to roughly 4.1 to 4.3 years.
IRR and NPV:
Assuming 2.5 percent annual electricity rate escalation, 0.5 percent annual production degradation, and a 7 percent discount rate, the unlevered IRR lands between 12 and 16 percent. A leveraged deal with 30 percent equity and a 7 percent loan typically pushes equity IRR into the 16 to 22 percent range.
This example assumes the array serves on-site loads. If the project exports 75 percent of generation instead of self-consuming 75 percent, the first-year savings drop to roughly $210,000 and simple payback stretches beyond 11 years. That is why load matching is everything in airport solar.
Airport-Specific Revenue Streams and Value Beyond kWh
Airport solar delivers value that a standard commercial rooftop project cannot replicate.
Gate electrification and pre-conditioned air: Solar generation can power electric ground support equipment, pre-conditioned air units, and charging stations for shuttle buses. These loads run during the day and can absorb large amounts of solar surplus. Sacramento International Airport’s solar farm generates enough power to cover a meaningful share of these operational loads, according to the Nature review (2025).
Parking structure canopies: Airport parking lots and garages are ideal for solar carports. They generate power while shading vehicles and creating infrastructure for EV charging. A 2 MW parking canopy can support 40 to 80 Level 2 chargers. Charging revenue can add $50,000 to $200,000 per year depending on utilization.
Sustainability reporting and green accreditation: Airports under pressure from airlines, regulators, and passengers to reduce emissions can use solar generation to meet Scope 2 targets. Denver International Airport prevents more than 11,000 metric tons of CO₂ emissions annually with its solar portfolio, according to the Nature review (2025). That emissions reduction has real value in sustainability-linked financing and airline partnership discussions.
Resilience and microgrid capability: Solar plus storage can keep critical systems online during outages. Chattanooga Metropolitan Airport’s 2.74 MW solar and battery microgrid cost roughly $10 million and is expected to recoup about $5 million in energy savings over 20 years, according to the same Nature review (2025). The resilience benefit is not fully captured in that savings figure but is a major factor in the airport’s operational planning.
Land lease revenue: Airports with surplus land can lease acreage to solar developers. Indianapolis International Airport’s 17.5 MW solar farm is an example of an airport monetizing otherwise unused land through a third-party arrangement. The airport receives lease payments or below-market power, depending on the deal structure.
Common Mistakes That Hurt Airport Solar Returns
The most expensive mistake is sizing the array by available land instead of load. A 10-acre parcel can host 2.5 MW of solar, but if the terminal only uses 1 million kWh per year, most of that generation will export at low value. Size to load first, land area second.
The second mistake is ignoring aviation-specific soft costs. Glare studies, FAA coordination, determination of no hazard letters, security badging, and contractor screening can add $0.10 to $0.30 per watt and 3 to 6 months to the schedule. Projects that do not budget these costs early run over budget.
The third mistake is underestimating structural or foundation costs. Older terminal roofs may need reinforcement. Ground-mount projects near runways may need special foundations to avoid interference with navigation systems. A geotechnical report and structural assessment are essential before any financial commitment.
The fourth mistake is optimistic export compensation. Many feasibility studies assume retail net metering when the local utility only offers avoided-cost net billing. A 60 percent drop in export value can turn a good project into a marginal one.
The fifth mistake is failing to coordinate with airport operations. Construction cannot disrupt aircraft movement, passenger flow, or security screening. Phased construction, night work, and strict contractor screening add cost but are necessary.
The sixth mistake is ignoring inverter replacement. Central inverters typically need replacement in year 12 to 15. Budget $0.15 to $0.25 per watt in present-value terms. Projects that ignore this reserve show inflated IRR.
When Airport Solar Does Not Make Sense
Airport solar is not always the right answer. Several conditions weaken the business case.
Low commercial electricity rates are the most common problem. At rates under 10 cents per kWh, the value of displaced electricity may not cover the aviation-specific adders. In those markets, focus on energy efficiency before solar.
No suitable rooftop or land is a close second. Some airports are land-constrained, environmentally sensitive, or located in climates with heavy cloud cover. If the only available surfaces are shaded by control towers or terminal structures, production suffers.
Short master plans or redevelopment timelines also hurt returns. If the terminal will be rebuilt in 10 years, a project with an 8-year payback leaves little margin for error.
High structural loads from wind, snow, or seismic zones increase engineering costs. Coastal airports in hurricane zones or airports in heavy snow regions require racking and foundations that can add 20 to 40 percent to the structural budget.
Finally, weak export compensation makes net-exporting projects uneconomic. In net-billing markets, the project must achieve high self-consumption or pair solar with storage to be viable.
Bottom Line
Airport solar works when three conditions align: a large unshaded surface, a steady daytime load, and commercial electricity rates above 10¢/kWh. The federal ITC and MACRS depreciation remain the largest drivers of ROI. FAA VALE grants can further improve economics for eligible airports. The aviation-specific adders are real, but they are offset by scalable capacity, high self-consumption, and the strategic value of resilience and emissions reduction.
If you are evaluating an airport solar project, start with a 12-month load profile and a structural assessment. Model self-consumption hour by hour. Compare cash purchase, loan, and PPA structures. Then run the numbers in SurgePV’s generation and financial tool or explore the commercial solar ROI calculator for a broader financial framework.
Model your airport solar ROI in SurgePV
Import interval data, size the array, simulate hourly generation, and export a bankable proposal with cash flows and incentives.
Book a DemoNo commitment required · 20 minutes · Live project walkthrough
FAQ
What is a typical solar ROI for an airport in 2026?
Airport solar in the U.S. typically delivers a 10 to 16 percent unlevered IRR and a 6 to 10 year simple payback after the 30 percent federal ITC. The range depends on local commercial electricity rates, whether the array serves terminal or airfield loads, self-consumption rate, and whether the project includes grant funding such as FAA VALE.
How much does an airport solar system cost?
An airport solar system in 2026 costs roughly $1.55 to $1.85 per watt DC for rooftop or ground-mount projects before incentives. Added costs for glare studies, FAA coordination, security screening, and structural engineering can add $0.10 to $0.30 per watt. A 2 MW airport solar system therefore lands between $3.1 million and $3.7 million before the ITC.
Why is solar ROI strong for airports?
Airports have large, flat rooftops, open land, and high daytime electricity loads. Terminals, hangars, and car parks run cooling, lighting, and ground support equipment during the same hours solar produces the most power. Self-consumption can reach 70 to 90 percent, which means most generation avoids the full retail rate. The 30 percent federal ITC and MACRS depreciation further improve returns.
Should an airport solar project buy outright or use a PPA?
Direct ownership captures the 30 percent federal ITC, MACRS depreciation, and all long-term savings. It produces the highest lifetime ROI but requires capital and tax appetite. A PPA preserves cash, fixes a long-term energy rate, and transfers O&M risk, but passes tax benefits to the investor. Choose ownership if the balance sheet supports it; choose a PPA if capital is constrained or the airport is municipally owned with limited tax capacity.
What federal incentives apply to airport solar in 2026?
The Section 48E Clean Electricity Investment Credit provides a 30 percent tax credit for qualifying commercial solar. Projects must generally be placed in service by December 31, 2027. Airports may also qualify for FAA Voluntary Airport Low Emission (VALE) grants, which can cover 75 to 90 percent of project costs for eligible airports in non-attainment or maintenance areas. Businesses can also use accelerated MACRS depreciation.
How does net metering affect airport solar ROI?
Full retail net metering makes ROI strongest because surplus generation offsets evening or seasonal usage at the retail rate. Net billing pays only avoided-cost rates for exports, which can be 50 to 70 percent lower. In net-billing markets, size the array closer to verified daytime load and consider battery storage or EV ground support charging to increase self-consumption.
What are the biggest mistakes that hurt airport solar ROI?
The most common mistakes are sizing by available land instead of verified load, ignoring demand charges, assuming 100 percent export value, using optimistic electricity rate escalation, and failing to budget for glare studies, FAA coordination, and security screening. Projects must also verify roof structural loads, soil conditions, and utility interconnection costs before finalizing budget.
When does airport solar not make financial sense?
Airport solar struggles when commercial rates are under 10¢/kWh, the airport has no suitable rooftop or land, export compensation is near wholesale, structural or foundation costs are high, or FAA coordination timelines stretch beyond the useful planning horizon. Sites with frequent shading from control towers or terminal structures also see weaker returns.
Can airport solar projects improve resilience?
Yes. Solar paired with battery storage can provide backup power for critical systems such as emergency lighting, communications, and gate operations during grid outages. Chattanooga Metropolitan Airport operates a 2.74 MW solar and battery microgrid that can run the airport off-grid. Resilience value is harder to monetize but increasingly important for business continuity planning.
How long does an airport solar project take from feasibility to commissioning?
A typical airport solar project takes 18 to 36 months. Feasibility, glare studies, and FAA coordination take 3 to 6 months. Design and permitting take 4 to 6 months. Procurement takes 3 to 4 months. Utility interconnection approval takes 4 to 8 months. Construction, often phased to preserve operations, lasts 3 to 6 months.
Where this fits
This article is part of SurgePV's Solar Business & Operations hub, which works through the topic from first principles to the decisions a project team actually has to make.
