Quick Answer
Solar PPA pricing models include fixed-price (flat $/MWh for 20 years), escalating (2–3% annual increase), and merchant (floating with wholesale market). Fixed-price PPAs provide revenue certainty for financing. Current US utility-scale PPA prices range from $25–$45/MWh depending on region and contract terms.
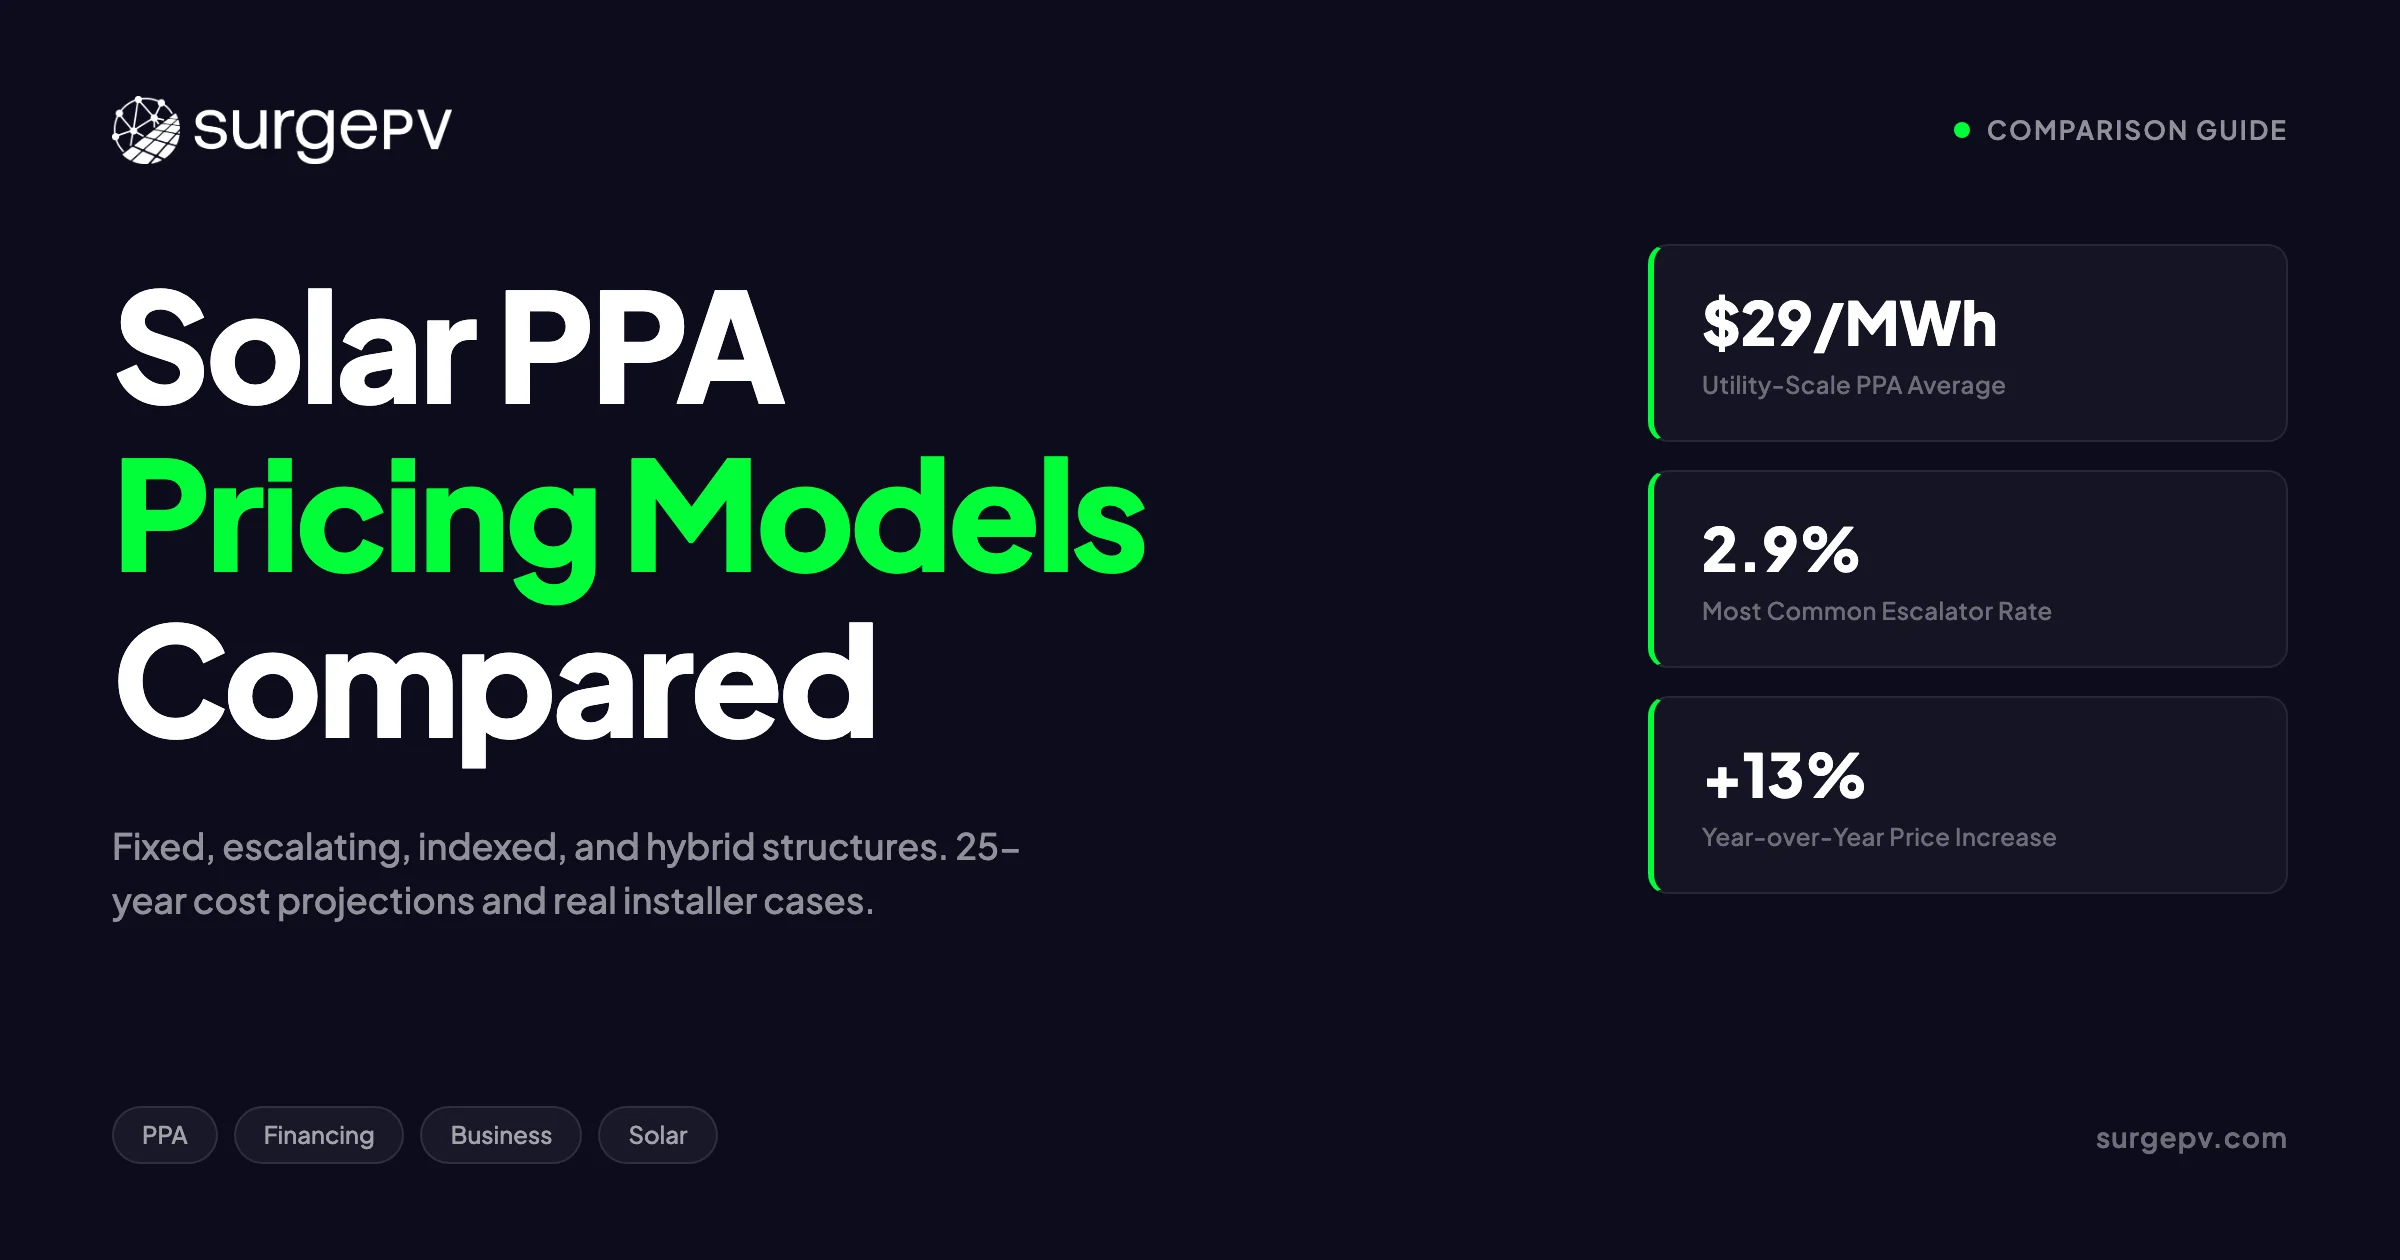
Solar PPA prices jumped 4.7% in the first quarter of 2026, ending a decade of steady decline. LevelTen Energy reports solar PPA prices up 13% year-over-year. Lawrence Berkeley National Laboratory data shows utility-scale contracts averaging $29 per MWh for 2024 projects. But the price per kilowatt-hour is only half the story. The pricing model inside the contract determines whether a homeowner saves $20,000 or loses $8,000 over 25 years.
Solar PPA pricing models include fixed-price (flat $/MWh for 20 years), escalating (2–3% annual increase), and merchant (floating with wholesale market). Fixed-price PPAs provide revenue certainty for financing. Current US utility-scale PPA prices range from $25–$45/MWh depending on region and contract terms.
Solar PPA pricing models include fixed-price (flat $/MWh for 20 years), escalating (2–3% annual increase), and merchant (floating with wholesale market). Fixed-price PPAs provide revenue certainty for financing. Current US utility-scale PPA prices range from $25–$45/MWh depending on region and contract terms.
A fixed-rate PPA at $0.18 per kWh and an escalating PPA starting at $0.15 per kWh can look similar on a one-page quote. Over 25 years, the difference is not $0.03. It is $13,000 in lifetime cost.
This guide covers every solar PPA pricing model active in 2026: fixed-rate, escalating-rate, indexed, and hybrid structures. You will see 25-year cost projections, real installer cases, the compound math that most sales presentations hide, and a decision framework for matching the right model to the right buyer.
Quick Answer
A solar PPA pricing model determines how the per-kWh rate changes over the contract term. Fixed-rate PPAs hold the price constant and deliver the greatest lifetime savings. Escalating PPAs start lower but compound 0.99% to 2.9% annually, often erasing savings by year 15. Indexed PPAs track market benchmarks and transfer risk to the buyer. Hybrid models blend flat periods with step-ups or capped adjustments. Most buyers should choose fixed-rate or negotiate the escalator below 1.5%.
In this guide:
- How each of the four PPA pricing models works, with real 2026 rate examples
- 25-year cost projections for fixed vs. escalating vs. indexed vs. hybrid structures
- A Texas commercial case where an escalating PPA turned negative by year 14
- 2026 PPA pricing by market segment: residential, commercial, and utility-scale
- Why most sales training pushes escalating models and what that costs the buyer
- How to choose the right pricing model based on time horizon, risk tolerance, and utility rate trajectory
- What to negotiate before signing any PPA contract
What Is a Solar PPA and How Does Pricing Work?
A solar Power Purchase Agreement (PPA) is a contract between a solar system owner and an electricity buyer. The owner installs, owns, and maintains the system on the buyer’s property. The buyer pays only for the electricity the system produces, at a pre-negotiated rate per kilowatt-hour.
The buyer gets solar electricity without buying the panels. The owner gets a long-term revenue stream and tax benefits. This structure is called third-party ownership. The Solar Energy Industries Association (SEIA) tracks PPA adoption and pricing trends nationally.
PPA vs. Lease vs. Cash Purchase
| Financing Method | Ownership | Payment Structure | Tax Credit Access |
|---|---|---|---|
| PPA | Third party (provider) | Per kWh consumed | Provider claims ITC/PTC |
| Solar lease | Third party (provider) | Fixed monthly fee | Provider claims ITC/PTC |
| Cash purchase | Homeowner/business | Upfront lump sum | Buyer claims ITC (residential expired 2025; commercial via Section 48E) |
| Solar loan | Homeowner/business | Monthly loan payment | Buyer claims ITC (same limits) |
PPAs and solar leases are similar in structure but different in payment logic. A lease charges a fixed monthly amount regardless of production. A PPA charges only for actual generation. This makes PPAs more attractive in cloudy climates or on partially shaded roofs. Shadow analysis software identifies shading issues before installation. See Solar Shading Analysis Guide for detailed guidance.
In 2026, the residential solar Investment Tax Credit (ITC) under Section 25D expired on December 31, 2025. Third-party-owned systems still access the commercial ITC via Section 48E. This makes PPAs relatively more attractive for homeowners who cannot use the direct tax credit.
The Four PPA Pricing Models
Every PPA contract uses one of four pricing structures:
- Fixed-rate — The price per kWh stays constant for the full contract term
- Escalating-rate — The price increases by a fixed percentage every year
- Indexed — The price tracks an external benchmark such as wholesale electricity or CPI
- Hybrid — Combines elements of the above, such as flat periods with step-ups or capped adjustments
The choice between these four models has a larger impact on lifetime cost than the initial rate itself. A fixed PPA at $0.18 per kWh often outperforms an escalating PPA starting at $0.15 per kWh.
Key Takeaway
The pricing model matters more than the headline rate. A 2.9% escalator doubles the effective PPA rate by year 25. Most buyers focus on year-one savings and miss the compound effect. Always model the full 25-year cost before choosing.
Fixed-Rate PPA: The Price-Certainty Model
A fixed-rate PPA holds the per-kWh price constant for the entire contract term. The rate in year one is the rate in year 25.
This is the simplest pricing model. It is also the most favorable to the buyer in most markets. The buyer knows exactly what they will pay for every kilowatt-hour for two decades.
How Fixed-Rate PPAs Work
The provider quotes a single rate, typically 10% to 30% below the current utility rate. The contract locks that rate for 20 to 25 years.
Example: A homeowner in California pays $0.32 per kWh to the utility. The PPA provider quotes $0.19 per kWh fixed for 25 years. The buyer saves $0.13 on every kWh the system produces. That savings grows as utility rates rise.
If utility rates increase at 4% annually, the fixed PPA saves $0.26 per kWh by year 15 and $0.47 per kWh by year 25. The savings compound in the buyer’s favor.
Typical Fixed-Rate PPA Ranges in 2026
| Market Segment | Rate Range | Average | Notes |
|---|---|---|---|
| Residential (US national) | $0.08–$0.30/kWh | $0.15/kWh | Varies widely by state utility rates |
| Residential (California) | $0.12–$0.20/kWh | $0.16/kWh | High utility rates make PPAs attractive |
| Residential (Texas) | $0.08–$0.13/kWh | $0.10/kWh | Low utility rates compress PPA margins |
| Residential (Northeast) | $0.11–$0.20/kWh | $0.15/kWh | NY, MA, CT at the high end |
| Commercial (US) | $0.09–$0.18/kWh | $0.12/kWh | Larger systems get volume discounts |
| Utility-scale | $24–$59/MWh | $29/MWh | LBNL 2024 data; regional spread is wide |
Utility-scale solar PPAs averaged $29 per MWh for projects that began operation in 2024, according to Lawrence Berkeley National Laboratory’s 2025 Utility-Scale Solar report. This was a 14% increase from 2023, reflecting supply chain and interconnection cost pressures.
25-Year Cost Projection: Fixed-Rate PPA
Assume a 6 kW residential system producing 8,500 kWh per year. The buyer consumes 70% of production.
| Year | Fixed PPA Rate | Annual Cost | Cumulative Cost |
|---|---|---|---|
| 1 | $0.18/kWh | $1,071 | $1,071 |
| 5 | $0.18/kWh | $1,071 | $5,355 |
| 10 | $0.18/kWh | $1,071 | $10,710 |
| 15 | $0.18/kWh | $1,071 | $16,065 |
| 20 | $0.18/kWh | $1,071 | $21,420 |
| 25 | $0.18/kWh | $1,071 | $26,775 |
Total 25-year cost: $26,775 for 212,500 kWh consumed.
For comparison, the same consumption at a utility rate starting at $0.28 per kWh and escalating 4% annually costs $53,200 over 25 years. The fixed PPA saves $26,425. Read more about Agricultural Solar Case Study. For France-specific information, see Floating Solar Farms France.
Real-World Example
A 500 kW commercial system in Phoenix signed a fixed PPA at $0.09 per kWh in 2022. The local utility rate was $0.13 per kWh. By 2026, the utility rate reached $0.15 per kWh. The PPA rate remained $0.09. The facility saved $31,200 in year four alone. The finance director now uses the PPA as a hedge against volatile energy costs in their annual budget.
When Fixed-Rate PPAs Win
Fixed-rate PPAs are the best choice when:
- Utility rates are rising faster than inflation
- The buyer values budget certainty over maximum short-term savings
- The contract term is 20 to 25 years
- The buyer plans to stay in the property long-term
- The fixed rate is at least 15% below the current utility rate
When Fixed-Rate PPAs Lose
Fixed-rate PPAs are less ideal when:
- The initial rate is only 5% to 10% below utility rates
- The buyer expects to sell the property within 5 to 7 years
- The local utility rate is flat or declining
- The buyer has access to low-cost capital for a cash purchase or loan
In markets like Texas, where ERCOT wholesale prices have been volatile and retail rates have stagnated, a fixed PPA needs a larger discount to the utility rate to justify the contract.
Escalating-Rate PPA: The Compounding Trap
An escalating-rate PPA starts with a lower per-kWh price than a fixed PPA. The rate increases by a fixed percentage every year. This percentage is called the escalator.
Escalating PPAs are the most common residential structure. They are also the most misunderstood.
How Escalators Work
The escalator is a compound annual growth rate applied to the PPA price. A 2.0% escalator does not add 2% of the starting rate each year. It multiplies the current year’s rate by 1.02.
The math is exponential. Small percentages produce large effects over 25 years.
| Escalator Rate | Year 1 (from $0.15) | Year 10 | Year 20 | Year 25 | Total Increase |
|---|---|---|---|---|---|
| 0% (fixed) | $0.15 | $0.15 | $0.15 | $0.15 | 0% |
| 0.99% | $0.15 | $0.165 | $0.182 | $0.191 | 27% |
| 1.99% | $0.15 | $0.180 | $0.216 | $0.240 | 60% |
| 2.90% | $0.15 | $0.196 | $0.257 | $0.289 | 93% |
| 2.99% | $0.15 | $0.197 | $0.260 | $0.294 | 96% |
A 2.9% escalator nearly doubles the rate by year 25. A 2.99% escalator produces a 96% total increase.
NREL data historically showed that approximately 72% of residential PPAs carried a 2.9% escalator. That was the industry default for years. In 2026, competition has pushed some providers to offer 0.99% and 1.99% options.
Common Escalator Rates in 2026
| Rate | Prevalence | Buyer Impact |
|---|---|---|
| 0% (fixed) | Growing | Best long-term value; 10% to 18% higher initial rate |
| 0.99% | Uncommon | Minimal impact; acceptable for most buyers |
| 1.99% | Common | Moderate long-term cost; negotiate toward this |
| 2.90% | Most common historically | Doubles rate by year 25; push back hard |
| 2.99% | Common | Nearly doubles rate; avoid if possible |
| 3.0% | Maximum typical | Maryland caps at 3% by law; red flag elsewhere |
25-Year Cost Projection: Escalating vs. Fixed
Using the same 6 kW system (8,500 kWh per year, 70% consumption):
| Model | Year 1 Rate | Year 10 Rate | Year 20 Rate | Year 25 Rate | 25-Year Total Cost |
|---|---|---|---|---|---|
| Fixed | $0.18 | $0.18 | $0.18 | $0.18 | $26,775 |
| 0.99% escalator | $0.17 | $0.187 | $0.206 | $0.217 | $28,940 |
| 1.99% escalator | $0.16 | $0.192 | $0.230 | $0.256 | $30,850 |
| 2.90% escalator | $0.15 | $0.196 | $0.257 | $0.289 | $32,680 |
| 2.99% escalator | $0.15 | $0.197 | $0.260 | $0.294 | $32,980 |
The 2.9% escalating PPA costs $5,905 more than the fixed PPA over 25 years. It costs $6,205 more than the 2.99% model. The “savings” in years one through five are an illusion. They are funded by higher costs in years 10 through 25.
What Most Guides Miss
Most PPA comparison articles show the year-one rate and call it a day. They do not model year 15 or year 25. A homeowner who signs a 2.9% escalating PPA at $0.15 per kWh pays $0.257 per kWh in year 20. If the local utility rate only rose to $0.24 per kWh, the PPA has become more expensive than the grid. This is not a theoretical risk. It happens in markets with flat utility rates.
For the latest details on France, see France Solar Feed-in Tariffs.
The Texas Commercial Failure: A Real Case
A 500 kW commercial rooftop system in Houston signed a PPA in 2019. The starting rate was $0.085 per kWh. The escalator was 2.9%. The local utility rate was $0.095 per kWh.
Year one looked good. The facility saved $0.01 per kWh. The annual savings were $4,250.
By year five, the PPA rate reached $0.098 per kWh. The utility rate had stalled at $0.10 per kWh due to flat natural gas prices and ERCOT market volatility. The savings had shrunk to $170 per year.
By year 14, the PPA rate hit $0.127 per kWh. The utility rate was $0.115 per kWh. The PPA was now more expensive than the grid. The facility was losing $1,020 per year.
By year 25, the PPA rate would reach $0.173 per kWh. The total lifetime cost exceeded a fixed PPA by $48,000.
The finance team had modeled only the first five years. They had assumed utility rates would rise 3% annually. Texas rates did not cooperate.
SurgePV Analysis
The Houston case reveals a critical flaw in most PPA sales pitches: they assume utility rates rise at historical averages forever. In reality, utility rate trajectories vary by region, regulation, and fuel mix. Texas ERCOT rates have been volatile but flat in real terms. California PG&E rates have risen 6% to 8% annually. A 2.9% escalator is safe in California and dangerous in Texas. Model your specific market, not national averages.
For a direct comparison, see Arka 360 vs SurgePV.
When Escalating PPAs Make Sense
Escalating PPAs are not always wrong. They fit specific scenarios:
- The buyer needs the lowest possible year-one payment for cash flow reasons
- The local utility rate is rising faster than the escalator
- The escalator is 1.5% or below
- The buyer plans to buy out the system within 7 to 10 years
The key is matching the escalator to the utility rate trajectory. A 1.5% escalator in a market with 5% annual utility increases is a good deal. A 2.9% escalator in a market with 2% utility increases is a bad deal.
Indexed PPA: Market-Linked Risk
An indexed PPA ties the per-kWh price to an external benchmark. The rate moves up and down based on market conditions.
Indexed PPAs are rare in residential markets. They are common in corporate procurement, utility-scale deals, and markets with volatile electricity prices.
Types of Indexed PPAs
| Index Type | Benchmark | Risk Profile | Common In |
|---|---|---|---|
| Wholesale market | ERCOT, PJM, CAISO day-ahead price | High; can go negative | Texas, corporate VPPAs |
| Utility tariff | Local utility’s published residential rate | Moderate; tracks retail | States with regulated utilities |
| CPI / inflation | Consumer Price Index | Low-moderate; smooth | Long-term contracts with inflation protection |
| Fuel cost pass-through | Natural gas price index | Moderate; volatile | Markets with gas-heavy generation mix |
Wholesale-Indexed PPAs
A wholesale-indexed PPA tracks the regional electricity market price. In ERCOT, this means the real-time or day-ahead settlement price.
The buyer benefits when wholesale prices are low. The buyer pays more when wholesale prices spike.
In 2024, ERCOT saw wholesale prices range from negative $50 per MWh during midday solar oversupply to $5,000 per MWh during grid emergencies. An indexed PPA in that market would have produced wildly variable bills.
Wholesale-indexed PPAs are typically structured with a floor and a ceiling. The floor protects the developer from extremely low prices. The ceiling protects the buyer from price spikes.
CPI-Linked PPAs
A CPI-linked PPA adjusts the rate annually based on the Consumer Price Index. If inflation is 3%, the PPA rate rises 3%.
This is more predictable than wholesale indexing. It protects the developer from inflation eroding their revenue. It gives the buyer a rate that tracks the general cost of living.
CPI-linked escalators are rare in residential solar. They appear more often in commercial and utility-scale contracts where both parties have finance teams that can model inflation scenarios.
Virtual PPAs (VPPAs)
A Virtual Power Purchase Agreement (VPPA) is a financial contract, not a physical power contract. The buyer does not receive electricity directly. Instead, they receive the difference between a fixed strike price and the floating market price.
If the market price is above the strike, the developer pays the buyer. If the market price is below the strike, the buyer pays the developer.
VPPAs are used by corporations like Google, Amazon, and Microsoft to claim renewable energy credits and hedge against electricity price risk. They are not relevant to residential or small commercial buyers.
Key Takeaway — Indexed PPAs
Indexed PPAs transfer market risk to the buyer. They make sense for sophisticated buyers with finance teams who can hedge exposure. For residential and small commercial buyers, fixed or low-escalator PPAs are almost always the better choice. The complexity of indexed pricing rarely justifies the marginal benefit.
When Indexed PPAs Work
Indexed PPAs fit these scenarios:
- Large corporate buyers with dedicated energy procurement teams
- Buyers in markets with predictable, rising utility rates
- Utility-scale projects where the offtaker wants price transparency
- Buyers who can hedge market risk through financial instruments
For a typical homeowner, an indexed PPA adds complexity without commensurate benefit. The fixed-rate model is simpler and safer.
Hybrid PPA: Combining the Best of Both Worlds?
A hybrid PPA blends two or more pricing mechanisms. The goal is to balance the buyer’s desire for low initial rates with the need for long-term cost control.
Common Hybrid Structures
| Hybrid Type | Structure | Best For |
|---|---|---|
| Flat then step-up | Fixed rate for 10 years, then 2% annual increase | Buyers who plan early buyout |
| Escalator with cap | 2% annual increase, capped at $0.25/kWh | Buyers wanting inflation protection with ceiling |
| CPI with floor | CPI-linked, minimum 1% annual increase | Developers needing revenue floor; buyers wanting inflation hedge |
| Prepaid hybrid | 70% of cash cost paid upfront, balance via low PPA | Buyers with capital who still want third-party ownership |
| Wholesale with collar | Indexed to market, floor at $0.08/kWh, ceiling at $0.25/kWh | Sophisticated buyers in volatile markets |
Flat-Then-Step-Up Hybrid
This is the most common hybrid in residential solar. The rate stays flat for the first 10 years. Then it increases by a modest amount each year.
Example: $0.16 per kWh for years 1 to 10. Then $0.18 per kWh for years 11 to 15. Then $0.20 per kWh for years 16 to 25.
This gives the buyer a decade of price certainty at a moderate rate. The later increases are smaller than a continuous 2.9% escalator because they do not compound for the full term.
Prepaid PPA Hybrid
A prepaid PPA requires the buyer to pay 60% to 75% of the system’s cash cost upfront. The provider claims the tax credits and passes some savings through. The buyer then pays a very low PPA rate for the remaining term.
Example: Pay $15,000 upfront on a $25,000 system. Then pay $0.05 per kWh for 20 years.
This structure works for buyers who have capital but want the provider to handle maintenance and monitoring. The effective cost is often lower than a standard PPA but higher than a cash purchase.
Pro Tip
When evaluating a hybrid PPA, build a year-by-year cash flow model. Do not rely on the provider’s summary sheet. A flat-then-step-up hybrid at $0.16 flat for 10 years then $0.20 for 15 years costs $34,680 over 25 years for our 6 kW example. A fixed PPA at $0.18 costs $26,775. The hybrid is $7,905 more expensive despite the lower initial rate.
When Hybrid PPAs Make Sense
Hybrid PPAs are worth considering when:
- The buyer has partial capital for a prepaid structure
- The buyer plans to buy out the system after year 10
- The contract includes a hard cap that limits maximum exposure
- The flat period covers the buyer’s expected time in the property
For most buyers, a simple fixed-rate PPA outperforms hybrids on lifetime cost. The added complexity rarely produces enough benefit to justify the higher total cost.
Side-by-Side Comparison: 25-Year Cost Model
Here is the master comparison table for a 6 kW residential system producing 8,500 kWh per year, with 70% self-consumption.
Lifetime Cost by PPA Model
| PPA Model | Starting Rate | Year 10 Rate | Year 20 Rate | Year 25 Rate | 25-Year Total | vs. Fixed |
|---|---|---|---|---|---|---|
| Fixed-rate | $0.18 | $0.18 | $0.18 | $0.18 | $26,775 | — |
| 0.99% escalating | $0.17 | $0.187 | $0.206 | $0.217 | $28,940 | +$2,165 |
| 1.99% escalating | $0.16 | $0.192 | $0.230 | $0.256 | $30,850 | +$4,075 |
| 2.90% escalating | $0.15 | $0.196 | $0.257 | $0.289 | $32,680 | +$5,905 |
| 2.99% escalating | $0.15 | $0.197 | $0.260 | $0.294 | $32,980 | +$6,205 |
| Flat 10yr + 2% step | $0.16 | $0.16 | $0.196 | $0.216 | $34,680 | +$7,905 |
| CPI-linked (3% avg) | $0.16 | $0.215 | $0.289 | $0.335 | $38,420 | +$11,645 |
| Utility grid (4% rise) | $0.28 | $0.390 | $0.542 | $0.660 | $53,200 | +$26,425 |
Every PPA model saves money compared to the utility grid. But the spread between the best PPA (fixed at $0.18) and the worst (CPI-linked) is $11,645.
The escalating models look attractive in year one because the starting rate is lower. By year 15, the picture reverses. The fixed PPA is the cheapest option for every year after year 8.
NPV Analysis at 5% Discount Rate
Discounting future cash flows at 5% annually:
| PPA Model | NPV (25 years) | vs. Fixed NPV |
|---|---|---|
| Fixed-rate | $18,420 | — |
| 0.99% escalating | $19,250 | +$830 |
| 1.99% escalating | $19,980 | +$1,560 |
| 2.90% escalating | $20,680 | +$2,260 |
| 2.99% escalating | $20,820 | +$2,400 |
Even with a 5% discount rate, the fixed PPA has the lowest net present value. The escalating models only look better if the buyer applies a very high discount rate (above 12%) that heavily discounts future payments.
SurgePV Analysis
The math is unambiguous: fixed-rate PPAs deliver the lowest lifetime cost for standard discount rates. Escalating PPAs only win if the buyer uses a discount rate above 12% or if the utility rate rises faster than the escalator. For a typical homeowner with a 5% to 8% cost of capital, fixed is the rational choice. The prevalence of 2.9% escalating PPAs is a market failure driven by sales incentives, not buyer economics.
Break-Even Analysis: When Does Each Model Win?
| Scenario | Best Model | Why |
|---|---|---|
| Buyer stays 25+ years, utility rises 4%+ | Fixed-rate | Lowest NPV, maximum savings |
| Buyer stays 5 to 7 years, then sells | 1.99% escalating | Lower initial rate, easy transfer |
| Buyer has 12%+ discount rate | 2.9% escalating | Future costs heavily discounted |
| Buyer plans early buyout (year 7) | 2.9% escalating | Minimizes payments before buyout |
| Utility rates flat or declining | Fixed-rate | Escalating models become expensive |
| Buyer wants inflation hedge | CPI-linked | Tracks cost of living |
| Sophisticated corporate buyer | Indexed with collar | Market exposure with bounds |
PPA Pricing by Market Segment in 2026
PPA pricing varies dramatically by system size, location, and buyer type. Here is the full 2026 market picture.
Residential PPA Rates by Region
| Region | Rate Range | Typical Utility Rate | PPA Discount |
|---|---|---|---|
| California | $0.12–$0.20/kWh | $0.30–$0.38/kWh | 35–50% |
| Texas | $0.08–$0.13/kWh | $0.12–$0.16/kWh | 15–30% |
| Northeast (NY, MA, CT) | $0.11–$0.20/kWh | $0.22–$0.32/kWh | 35–50% |
| Southeast (FL, GA, NC) | $0.09–$0.16/kWh | $0.13–$0.18/kWh | 20–35% |
| Southwest (AZ, NV) | $0.09–$0.14/kWh | $0.13–$0.17/kWh | 20–35% |
| Midwest (IL, OH, MI) | $0.10–$0.16/kWh | $0.14–$0.20/kWh | 20–35% |
California and the Northeast offer the largest absolute savings because utility rates are highest. Texas offers the lowest PPA rates but also the smallest savings margin.
Commercial PPA Rates
Commercial systems range from 100 kW to several megawatts. Economies of scale reduce the per-kWh rate.
| System Size | Typical PPA Rate | Typical Utility Rate | Annual Savings (70% consumption) |
|---|---|---|---|
| 100 kW | $0.10–$0.14/kWh | $0.14–$0.20/kWh | $2,500–$5,000 |
| 250 kW | $0.09–$0.12/kWh | $0.13–$0.18/kWh | $7,000–$13,000 |
| 500 kW | $0.08–$0.11/kWh | $0.12–$0.16/kWh | $14,000–$26,000 |
| 1 MW | $0.07–$0.10/kWh | $0.11–$0.15/kWh | $28,000–$52,000 |
Commercial solar buyers should use financial modeling tools to compare PPA, lease, loan, and cash purchase options. The optimal structure depends on tax position, cost of capital, and expected hold period. For a deeper comparison of all financing methods, see our guide to solar financing options.
Utility-Scale PPA Pricing
Utility-scale solar PPAs are priced in dollars per megawatt-hour ($/MWh), not per kilowatt-hour.
| Metric | 2024 Value | Change from 2023 |
|---|---|---|
| National average (LBNL) | $29/MWh | +14% |
| Lowest region (non-ISO West) | $24/MWh | +10% |
| Highest region (NYISO) | $59/MWh | +18% |
| LevelTen Q1 2025 P25 | $48.81/MWh | +10% YoY |
| LevelTen Q3 2025 P25 | $59.77/MWh | +6% YoY |
LBNL’s 2025 Utility-Scale Solar report shows prices rising across all regions after a decade of decline. LevelTen Energy’s Q1 2026 Price Index confirms the trend, with solar PPA prices climbing 4.6% to 4.7% quarter-over-quarter.
IRENA’s Renewable Power Generation Costs in 2024 report places utility-scale solar LCOE at $37 to $44 per MWh globally. PPA prices typically sit at or slightly above LCOE, with the premium reflecting developer margin, financing costs, and risk. For Global-specific compliance details, see Global net-metering-by-country. For Global-specific compliance details, see Global solar-permitting-speed-by-country.
Key Takeaway — 2026 Pricing Context
PPA prices are rising in 2026 after a decade of decline. LevelTen reports a 13% year-over-year increase for solar. Buyers who delayed procurement in 2023 to 2024 are now facing higher rates. However, PPA prices still undercut utility rates in most markets by 15% to 50%. The window for savings remains open, but it is narrowing.
What Most Installers Get Wrong About PPA Pricing
PPA pricing models are not just a consumer issue. They affect installer margins, close rates, and long-term customer satisfaction. Here are the three most common mistakes installers make when presenting PPA options.
Mistake 1: Quoting the Escalator Without Showing the Year-20 Rate
Most sales presentations show the starting rate and the escalator percentage. They do not show what the rate becomes in year 10, 15, or 20.
A homeowner sees “$0.15 per kWh, 2.9% escalator.” They do the math in their head: “$0.15 plus a little bit.” They do not realize the rate becomes $0.26 per kWh in year 20.
Installers who show the full 25-year rate schedule build more trust. They also close fewer escalating PPAs. That is the tradeoff. Transparency reduces short-term commissions but increases referral rates. Read Solar Sales Commission Structure for a complete walkthrough.
Mistake 2: Assuming National Average Utility Rate Growth
Sales training often teaches: “Utility rates rise 3% to 4% annually. A 2.9% escalator tracks below that.” This is mathematically true as a national average. It is dangerously wrong for specific markets.
Texas ERCOT retail rates have been flat for years. Florida rates have risen slowly. California rates have spiked. A 2.9% escalator is safe in California and risky in Texas.
Installers should model the buyer’s actual utility rate trajectory. Use the local utility’s historical rate filings. Project forward based on the utility’s announced rate cases. Do not use a national average.
Mistake 3: Not Modeling NPV Correctly
Many installers compare PPA options using simple arithmetic: total payments over 25 years. This ignores the time value of money.
A 2.9% escalating PPA has lower payments in years 1 to 8 and higher payments in years 15 to 25. The early savings are worth more than the later costs because of discounting. A proper NPV analysis is required.
Installers who use solar proposal software with built-in NPV calculators produce more accurate comparisons. SurgePV’s generation and financial tool models fixed, escalating, and hybrid PPA structures side-by-side with NPV, IRR, and payback period.
Pro Tip for Installers
Show three scenarios on every PPA quote: fixed-rate, 1.99% escalating, and 2.9% escalating. Display the 25-year NPV for each. Let the buyer see the full picture. Buyers who understand the math almost always choose fixed or low-escalator models. The ones who choose 2.9% escalating do so with informed consent.
How to Choose the Right PPA Pricing Model
The optimal PPA structure depends on the buyer’s financial situation, time horizon, and risk tolerance. Use this framework.
Decision Matrix
| Buyer Profile | Recommended Model | Key Terms to Negotiate |
|---|---|---|
| Long-term owner (20+ years) | Fixed-rate | Rate, contract length, buyout price |
| First-time buyer, cash-constrained | 0.99% to 1.5% escalating | Escalator rate, cap, early buyout |
| Planning to sell in 5 to 10 years | Fixed-rate or low escalator | Transferability, assumption fees |
| Corporate with finance team | Indexed with floor/ceiling | Collar width, settlement frequency |
| Has partial capital | Prepaid hybrid | Upfront percentage, residual rate |
| Risk-averse, values certainty | Fixed-rate | Production guarantee, maintenance terms |
| High discount rate (>10%) | 1.99% to 2.5% escalating | Cap at 2.5%, early buyout option |
Questions to Ask Before Signing
- What is the rate in year 1, year 10, year 20, and year 25?
- Is the escalator compounded annually or simple?
- What is the total 25-year cost, not just the monthly payment?
- How does this compare to a fixed-rate PPA from the same provider?
- What happens if I sell my home? Is the contract transferable?
- What is the early buyout schedule and price?
- What is the production guarantee, and how is underperformance compensated?
- Who pays for inverter replacement after year 12?
- Is there an escalator cap or ceiling?
- Can I see the NPV comparison against cash purchase and solar loan?
In Simple Terms
If you plan to stay in your home for 15 years or more, choose a fixed-rate PPA. The higher initial rate is worth the long-term savings. If you need the lowest possible payment today and plan to buy out or sell within 7 years, a low escalator (1.5% or below) is acceptable. Never sign a 2.9% escalating PPA without seeing the year-25 rate in writing.
2026 Market Outlook: Where PPA Prices Are Heading
Several forces are pushing PPA prices higher in 2026. Buyers and installers should understand the drivers.
Rising PPA Prices
LevelTen Energy’s Q1 2026 Price Index shows solar PPA prices up 4.6% to 4.7% quarter-over-quarter. Year-over-year, solar is up 13% and wind is up 24%.
This ends a decade of declining PPA prices. The reversal is driven by:
- Supply chain costs: Module prices stabilized after a period of decline. Inverters, racking, and labor costs rose.
- Interconnection delays: Queue backlogs stretch to 3 to 5 years in some markets. Delayed projects carry higher financing costs.
- Interest rates: Higher cost of capital increases project finance expenses. These flow through to PPA rates.
- Trade policy: Section 232 tariffs on steel and aluminum, plus anti-dumping investigations on solar components from Southeast Asia, increased input costs.
Policy Uncertainty
The One Big Beautiful Bill Act (OBBBA) created uncertainty around the Investment Tax Credit timeline. The Foreign Entity of Concern (FEOC) rules complicate supply chain sourcing.
Developers face a 2028 tax credit cliff. Projects that do not qualify before the deadline may lose 30% of their tax equity value. This pushes developers to accelerate procurement, increasing demand for equipment and labor.
Data Center Demand Surge
Tech companies are signing massive renewable energy contracts to power AI data centers. Google, Amazon, Microsoft, and Meta are the largest corporate PPA buyers. Their demand is soaking up available solar and wind capacity.
This corporate demand competes with utility and residential procurement for the same project pipeline. More demand with constrained supply means higher prices.
What This Means for Buyers
PPA prices are unlikely to return to 2020 lows in the near term. However, they still undercut utility rates in most markets. The savings window is open but narrowing.
Buyers who are considering solar should act within the next 12 to 18 months. Further price increases are likely before supply chain and interconnection bottlenecks resolve.
Model Your PPA Options in SurgePV
Compare fixed, escalating, and hybrid PPA structures side-by-side with NPV, IRR, and 25-year cash flow projections.
Try the Financial ModelerFree · No signup required · Compare all financing models
Conclusion
Solar PPA pricing models determine lifetime savings more than the headline rate. A fixed PPA at $0.18 per kWh outperforms a 2.9% escalating PPA starting at $0.15 per kWh by $5,905 over 25 years.
The compound effect of escalators is the single most underexplained concept in solar sales. Most buyers never see the year-20 rate. Most sales presentations never show the NPV comparison.
Three actions for buyers and installers:
- Request the full 25-year rate schedule for any PPA quote, not just the starting rate. Calculate the total cost yourself or use solar design software with financial modeling built in.
- Negotiate the escalator below 1.5% if you choose an escalating model. Push back on 2.9%. The provider will accept a lower rate to close the deal.
- Model your specific utility rate trajectory, not a national average. A 2.9% escalator is safe in California and dangerous in Texas. The right model depends on your market.
PPA prices are rising in 2026, but the savings opportunity remains real. The buyers who understand the pricing model math will capture the most value. The ones who do not will overpay by thousands over the contract term. Also see: Us Residential Solar Market Trends 2026.
Frequently Asked Questions
What are the four main solar PPA pricing models?
The four main solar PPA pricing models are fixed-rate (constant price per kWh for the full contract term), escalating-rate (price increases 0.99% to 2.9% annually compounded), indexed (price tracks a market benchmark like wholesale electricity or CPI), and hybrid (combines flat periods with step-up adjustments or cap-and-collar bands). Fixed-rate delivers the greatest lifetime savings for buyers. Escalating models trade lower initial rates for higher long-term costs.
Is a fixed-rate or escalating PPA better in 2026?
A fixed-rate PPA is better for most buyers in 2026. A 2.9% annual escalator compounds to a 108% total rate increase over 25 years. A fixed PPA at $0.18/kWh saves approximately $13,000 over 25 years compared to a 2.9% escalating PPA starting at $0.15/kWh. The exception is buyers with very high discount rates who need maximum year-one cash flow.
What is a good solar PPA rate in 2026?
Good solar PPA rates in 2026 range from $0.08 to $0.15 per kWh for residential systems in low-cost markets like Texas, and $0.12 to $0.20 per kWh in high-cost markets like California and the Northeast. Utility-scale PPAs averaged $29 per MWh for 2024 projects according to LBNL data. Commercial systems typically fall between $0.09 and $0.18 per kWh.
How does a PPA escalator work?
A PPA escalator is an annual percentage increase applied to the per-kWh rate. It compounds every year. A 2.0% escalator on a $0.15/kWh starting rate produces $0.153 in year two, $0.156 in year three, and $0.246 in year 25. The escalator is the single most important clause in a PPA contract. A 2.9% escalator doubles the effective rate by year 25.
What is an indexed PPA and how is it different from an escalator?
An indexed PPA ties the price to an external benchmark such as the local wholesale electricity price, the Consumer Price Index (CPI), or the utility’s published tariff. Unlike a fixed escalator, an indexed PPA can move up or down. This transfers market risk to the buyer. Indexed PPAs are common in corporate procurement and utility-scale markets but rare in residential.
Can you negotiate PPA pricing terms?
Yes. Most PPA providers will accept a 1.5% to 1.75% escalator if you push back on the default 2.9% rate. You can also negotiate the contract length, buyout schedule, production guarantee floor, and early termination fees. The escalator rate and contract duration have the largest impact on lifetime cost. Always request three quotes and compare 25-year NPV, not just year-one rates.
What happens at the end of a solar PPA contract?
At the end of a typical 20 to 25-year PPA, you have three options: renew the PPA at a reduced rate, purchase the system at fair market value or a predetermined price, or request the provider remove the system at no cost. The buyout price in year 25 is often 10% to 15% of the original system cost. Some contracts include an early buyout option starting in year 5 to 7.
How do PPA pricing models affect installer margins?
Escalating PPAs generate higher long-term revenue streams for PPA providers and financiers. A 2.9% escalator increases total contract revenue by 35% to 45% compared to a fixed rate. Installers who sell escalating PPAs often receive higher upfront commissions. Fixed-rate PPAs have thinner margins for the provider but deliver better value to the buyer. This is why most sales training pushes the escalating model.
Are solar PPAs worth it compared to buying outright in 2026?
PPAs are worth it for buyers who lack upfront capital, do not qualify for tax credits, or want zero maintenance responsibility. However, cash purchase or solar loan typically delivers $20,000 to $30,000 more in lifetime savings for a standard residential system, according to NREL analysis. In 2026, with the residential ITC expired, third-party-owned PPAs retain access to the commercial ITC via Section 48E, making them relatively more attractive than ownership for some buyers.
What is a hybrid PPA pricing model?
A hybrid PPA combines two or more pricing mechanisms. Common hybrids include: flat rate for 10 years then a step-up increase, a base rate plus a CPI adjustment capped at 3%, or a wholesale-indexed rate with floor and ceiling bands. Hybrids try to balance buyer and seller risk. They are most common in corporate and utility-scale procurement where both parties have sophisticated finance teams.


