Quick Answer
The most efficient solar panels in 2026 are SunPower Maxeon 7 (22.8%), LONGi Hi-MO 9 (23.0%), Jinko Tiger Neo (23.2%), and Trina Solar Vertex (22.5%). HJT (heterojunction) technology leads efficiency but costs 10–15% more than TOPCon. Bifacial panels add 5–20% rear-side gain on reflective surfaces.
The average residential solar panel shipped in 2024 was 20% efficient. The most efficient solar panels in 2026 now break 25% — a threshold the industry spent two decades approaching. That gap changes the design math on every constrained rooftop: one percentage point of efficiency gain translates to roughly 4 fewer panels on a 10 kW system, or the same output from 2 fewer square meters of roof area.
The most efficient solar panels in 2026 are SunPower Maxeon 7 (22.8%), LONGi Hi-MO 9 (23.0%), Jinko Tiger Neo (23.2%), and Trina Solar Vertex (22.5%). HJT (heterojunction) technology leads efficiency but costs 10–15% more than TOPCon. Bifacial panels add 5–20% rear-side gain on reflective surfaces. Read Bifacial Solar Panel Design Guide for a complete walkthrough.
This database covers 22 residential modules ranked by STC efficiency, four active cell architectures competing for installer specification, commercial 500W+ format modules, bifacial performance gains, and the degradation trajectories that determine real 25-year output. Each section includes data that matters for system design: temperature coefficients, derating factors, and the tradeoffs that determine which efficiency tier fits each project type.
If you are designing systems using solar design software, the numbers in this database feed directly into layout density decisions, energy yield simulations, and proposal accuracy.
TL;DR — Solar Panel Efficiency 2026
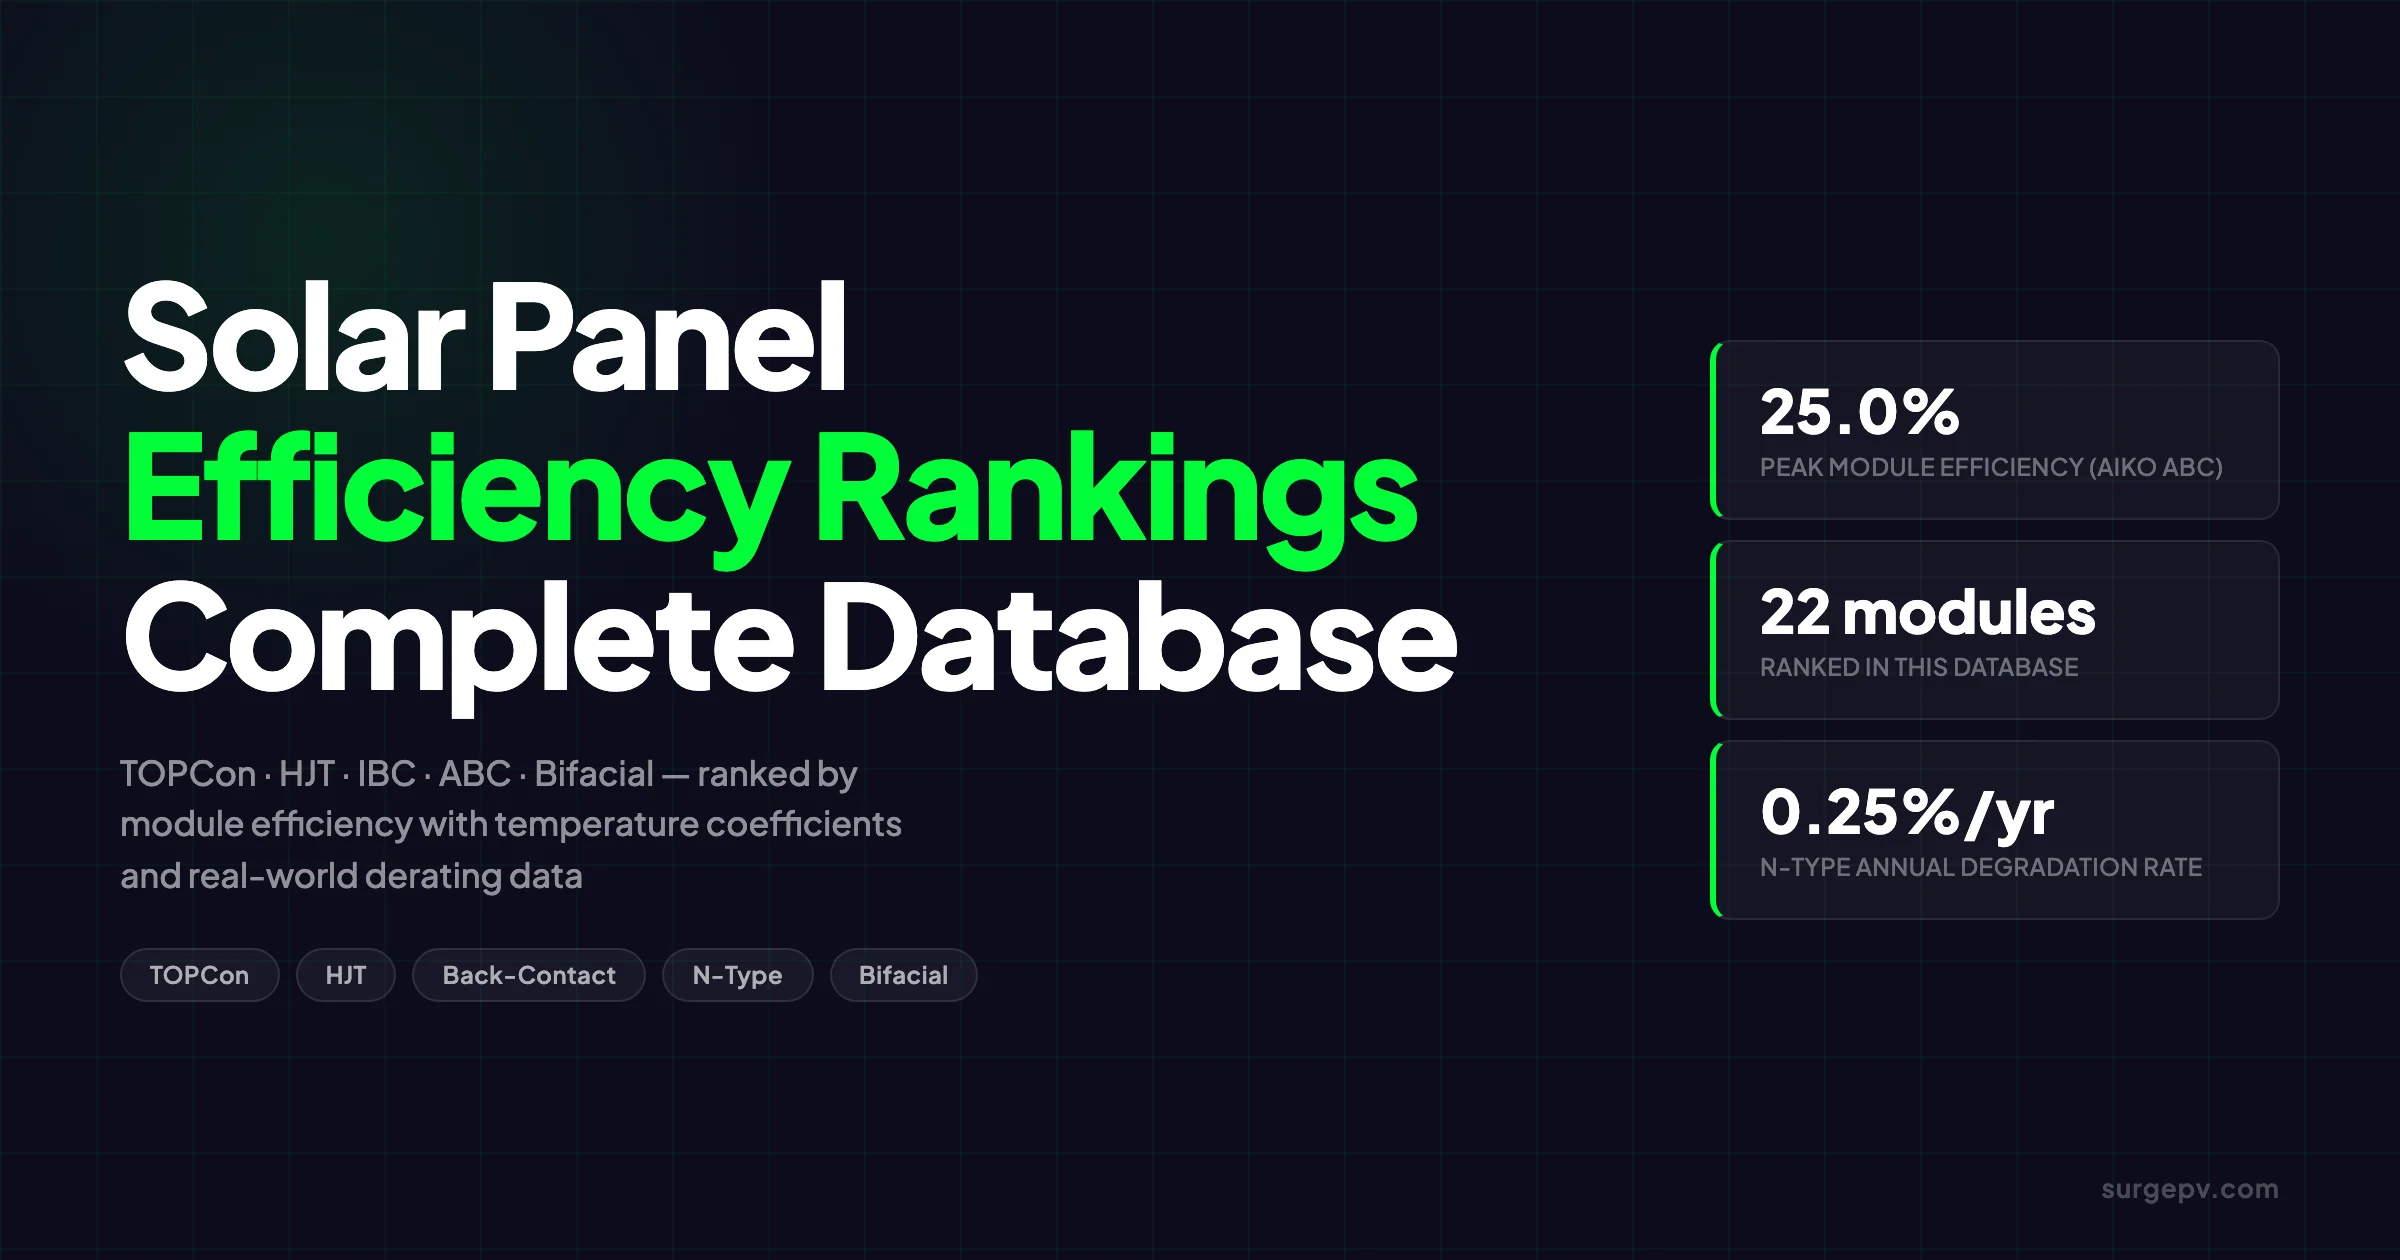
25.0% is the peak residential module efficiency (Aiko Solar Neostar 3P54, ABC back-contact). TOPCon dominates volume production with top models at 23.8-24.0%. HJT panels carry the best temperature coefficients (-0.25 to -0.27%/°C) — the decisive advantage in hot climates. N-type panels degrade at 0.25-0.40%/yr vs. 0.50-0.70%/yr for P-type PERC. Premium efficiency is worth paying only when roof space is the binding constraint.
What Solar Panel Efficiency Actually Means
Solar panel efficiency is the percentage of sunlight hitting the panel surface that converts to usable electricity under Standard Test Conditions (STC): 1,000 W/m² irradiance, 25°C cell temperature, and AM 1.5 solar spectrum. A 22% efficient panel converts 220 W of every 1,000 W per square meter into electricity. Also see: Us Residential Solar Market Trends 2026.
Two distinct metrics appear in manufacturer data. Cell efficiency measures a single solar cell in isolation, excluding frame, busbars, and inactive surface area. A high-efficiency TOPCon cell might reach 26-27% in laboratory conditions. Module efficiency applies to the entire assembled panel — cells plus glass, encapsulant, backsheet, and frame — and runs consistently lower due to inactive area and optical losses.
The practical metric for system design is power density: watts per square meter (W/m²). Two panels can carry identical efficiency ratings but different power outputs if one uses a larger format. A 500W panel at 23.8% efficiency occupies more roof area than a 445W panel at 24.1% efficiency. Understanding this distinction prevents the most common sizing errors when comparing modules across formats.
STC efficiency appears in all marketing materials, specification sheets, and certification documents. Real-world output is lower — typically 75-85% of STC for a complete system — due to temperature, irradiance variation, soiling, mismatch, and inverter losses. Solar irradiance at a specific site determines whether efficiency gain converts to meaningful additional generation. A 25% efficient panel in Arizona generates more absolute kWh than the same panel in Scotland, even though both share the same STC rating. Read more about Battery Solar System Design UK.
Cell Efficiency vs. Module Efficiency
Manufacturers sometimes advertise cell efficiency in press releases. Aiko Solar’s ABC cells achieve 26.5%+ cell efficiency, but the Neostar 3P54 module rates at 25.0% due to inactive panel area. Always compare module efficiency figures, not cell efficiency, when specifying panels for a project.
Solar Panel Efficiency Rankings 2026: Complete Residential Module Database
The following database covers the 22 most efficient residential-format solar modules available or specifiable in 2026. Data is sourced from manufacturer datasheets, independent review databases, and industry benchmark reports. Panels are ranked by STC module efficiency.
| Rank | Brand | Model | Technology | Efficiency | Power (W) | Temp Coeff (°C) | Annual Degradation |
|---|---|---|---|---|---|---|---|
| 1 | Aiko Solar | Neostar 3P54 | ABC Back-Contact | 25.0% | 500W | -0.26%/°C | 0.25%/yr |
| 2 | Recom Technologies | Black Tiger Series | Back-Contact | 24.8% | 495W | -0.25%/°C | 0.25%/yr |
| 3 | LONGi Solar | Hi-MO X10 Explorer | HPBC | 24.3% | 495W | -0.29%/°C | 0.40%/yr |
| 4 | Maxeon | Maxeon 7 | IBC | 24.1% | 445W | -0.27%/°C | 0.25%/yr |
| 5 | Jinko Solar | Tiger NEO III | TOPCon | 24.0% | 520W | -0.30%/°C | 0.40%/yr |
| 6 | Suntech | Ultra BC | ABC | 24.0% | 480W | -0.26%/°C | 0.30%/yr |
| 7 | Trina Solar | Vertex S+ | TOPCon | 23.8% | 475W | -0.30%/°C | 0.40%/yr |
| 8 | Astronergy | Astra N7 2.0 | TOPCon | 23.8% | 530W | -0.29%/°C | 0.40%/yr |
| 9 | Winaico | WST-485BDX54 | N-Type | 23.8% | 485W | -0.25%/°C | 0.30%/yr |
| 10 | Risen Energy | N-Type Series | HJT | 23.8% | 475W | -0.26%/°C | 0.30%/yr |
| 11 | JA Solar | DeepBlue 4.0 Pro | TOPCon | 23.0% | 450W | -0.30%/°C | 0.40%/yr |
| 12 | CW Energy | CWT-450M | TOPCon | 23.0% | 450W | -0.30%/°C | 0.40%/yr |
| 13 | Maxeon | Maxeon 3 | IBC | 22.8% | 440W | -0.27%/°C | 0.25%/yr |
| 14 | LONGi Solar | Hi-MO X6 | HPBC | 22.8% | 430W | -0.30%/°C | 0.40%/yr |
| 15 | SEG Solar | YUKON N | TOPCon | 22.7% | 440W | -0.30%/°C | 0.40%/yr |
| 16 | Silfab | Elite QD | TOPCon | 22.6% | 440W | -0.30%/°C | 0.35%/yr |
| 17 | CertainTeed | CTTC HC | TOPCon | 22.6% | 440W | -0.30%/°C | 0.35%/yr |
| 18 | Canadian Solar | HiHero | HJT | 22.5% | 430W | -0.26%/°C | 0.30%/yr |
| 19 | REC Solar | Alpha Pure-R | HJT | 22.3% | 430W | -0.25%/°C | 0.25%/yr |
| 20 | Qcells | Q.TRON BLK M-G2+ | HJT | 22.3% | 435W | -0.25%/°C | 0.30%/yr |
| 21 | CW Energy | CWT-450M Standard | TOPCon | 22.1% | 440W | -0.30%/°C | 0.40%/yr |
| 22 | Panasonic | EverVolt HK Black | HJT | 21.7% | 410W | -0.26%/°C | 0.26%/yr |
Database Notes
Efficiency and power ratings are from published manufacturer datasheets under STC (1,000 W/m², 25°C, AM 1.5). Temperature coefficients are per manufacturer spec sheets. Annual degradation reflects first-year stabilization and does not include light-induced degradation (LID), which N-type cells are largely immune to. Availability varies by region — confirm stock with distributors before specifying.
The database shows a clear performance tier structure: back-contact architectures (ABC, IBC, HPBC) hold the 24%+ efficiency positions, while TOPCon and HJT fill the 22-24% tier that represents the bulk of 2026 installations. The gap between rank 1 and rank 22 is 3.3 percentage points — in practical terms, about 2.5 m² of additional roof area needed to generate the same output from the least efficient panel vs. the most efficient.
Technology Breakdown: Which Cell Architecture Leads in 2026?
Four distinct cell architectures compete in the 2026 market. Each involves different manufacturing processes, cost structures, and performance characteristics. Understanding the technology behind the efficiency rating matters for specifying the right module for each installation context.
Back-Contact Cells (IBC and ABC) — The Efficiency Leaders
Back-contact architectures eliminate front-side metal contacts entirely by moving all electrical connections to the rear of the cell. This removes the shading losses from front busbars and allows more active silicon area, pushing module efficiencies to the 24-25% range.
IBC (Interdigitated Back Contact) cells — used in Maxeon panels — interleave positive and negative contact fingers across the rear surface. This architecture has been in commercial production since 2004 and has a long reliability track record. Maxeon 7 at 24.1% represents the mature IBC product line for residential applications.
ABC (All Back Contact) cells — Aiko Solar’s proprietary variant — combine IBC contact geometry with an amorphous silicon passivation layer similar to HJT technology. The result is the highest certified module efficiencies currently available commercially: 25.0% for the Neostar 3P54. Suntech’s Ultra BC uses a similar architecture at 24.0%.
Back-contact panels carry the best temperature coefficients in the -0.25 to -0.27%/°C range (alongside HJT) and the lowest annual degradation rates (0.25%/yr for IBC/ABC). The tradeoff is cost — these panels remain premium-priced, typically at a 30-60% cost premium per watt over standard TOPCon.
LONGi’s HPBC (High Performance Back Contact) occupies a cost-competitive middle position. The Hi-MO X10 Explorer reaches 24.3% efficiency while using a manufacturing process more amenable to high-volume production than traditional IBC. HPBC panels have become a strong installer choice in markets where premium efficiency is needed without full IBC pricing.
TOPCon — The Volume Mainstream
TOPCon (Tunnel Oxide Passivated Contact) is now the dominant cell technology by production volume. IEA data shows TOPCon cells accounting for over 60% of new global module production capacity, with that share continuing to grow through 2026. For Global-specific compliance details, see Global net-metering-by-country.
TOPCon improves on PERC cells by adding a thin tunnel oxide layer and polysilicon contact on the rear surface, dramatically reducing recombination losses. The result: commercial modules reaching 22-24% efficiency at a cost competitive with PERC just two years ago.
Manufacturers including Jinko Solar, Trina Solar, JA Solar, Astronergy, and CW Energy now produce TOPCon modules. The performance range among them is narrow — 22.5 to 24.0% — with differentiation coming from cell quality consistency, bifacial factor, and degradation rate rather than peak efficiency.
TOPCon’s main limitation for hot-climate installations is its temperature coefficient of -0.29 to -0.32%/°C, which is meaningfully worse than HJT. For the comparison between these technologies in depth, the gap matters in summer peak production. Read more about Agricultural Solar Case Study.
HJT — Temperature Performance Leaders
HJT (Heterojunction Technology) cells combine crystalline silicon with thin amorphous silicon layers on both sides, creating a structure that is particularly resistant to temperature-induced efficiency loss. With temperature coefficients of -0.25 to -0.27%/°C, HJT panels outperform TOPCon by roughly 0.05%/°C — a difference that compresses system size in warm climates.
REC Solar’s Alpha Pure-R, Canadian Solar’s HiHero, Panasonic EverVolt, and Qcells Q.TRON BLK M-G2+ represent the established HJT residential lineup. Risen Energy has pushed HJT into larger commercial formats with 740W modules at 23.8% efficiency, demonstrating that HJT scales well to high-power formats. For Canada-specific compliance details, see Canada comparisons/solar-design-software.
HJT cells also carry no light-induced degradation (LID), since amorphous silicon passivation prevents the boron-oxygen defects that affect P-type cells. Annual degradation of 0.25-0.30%/yr means HJT panels retain more output in the final years of a 25-year warranty compared to TOPCon.
The manufacturing challenge for HJT is cost — it requires deposition equipment different from standard silicon production, keeping costs slightly above TOPCon for equivalent efficiency. That gap is narrowing as production scales.
PERC — The Outgoing Baseline
PERC (Passivated Emitter and Rear Cell) was the dominant technology from 2018 to 2023, pushing residential efficiencies past 20%. In 2026, PERC is no longer competitive at the top efficiency tiers. Standard monocrystalline PERC panels now range from 20-21.5% efficiency — below the bottom of this database.
PERC P-type cells also carry higher annual degradation (0.5-0.7%/yr) and a temperature coefficient of -0.35 to -0.40%/°C. For budget residential installs with ample roof area, PERC modules still offer value. For any project where space or long-term production is a priority, N-type alternatives are the better choice.
Perovskite: Not Yet Commercial in 2026
Perovskite-silicon tandem cells have reached 34.85% certified efficiency in laboratory settings. However, no major commercial perovskite modules are available in 2026. Industry timelines point to limited commercial availability in 2027-2028 at best. For current system specifications, perovskite remains a future technology, not a present procurement option. See our dedicated post on perovskite solar cells for the development timeline.
The Efficiency vs. Power Rating Trap
A common specification error: selecting panels based on power output (watts) rather than module efficiency. The two are related but not the same.
Power output depends on panel size. A 530W Astronergy Astra N7 2.0 at 23.8% efficiency and a 445W Maxeon 7 at 24.1% efficiency are close in efficiency but differ by 85W because the Astronergy panel uses a physically larger format. In a system with unlimited roof space, the Astronergy might be preferable for lower installed cost per watt. On a constrained rooftop, the Maxeon delivers more watts per square meter.
The correct comparison metric is power density (W/m²). To calculate:
Power density (W/m²) = Panel power (W) ÷ Panel area (m²)Or equivalently: efficiency (%) × 10 = power density in W/m².
A 25.0% panel produces 250 W per square meter. A 21.7% panel produces 217 W/m². On a 20 m² available roof area, the difference is 660W of additional system capacity — roughly 10-15% more annual energy.
For installers designing with solar design software, modern tools model both panel footprint and power density directly in the layout engine. The layout interface shows available roof area, panel spacing, and shading — and the efficiency ranking in this database maps directly to which panels unlock the most output from a given roof geometry.
The other factor: larger-format panels (520W+) often achieve lower cost per watt but create mechanical challenges on residential rooftops. Taller panels may require additional racking rows, and heavy 530W+ modules require structural verification on older roofs. Half-cut cell technology has helped manage this by splitting panels into two halves that reduce hot-spot sensitivity.
Real-World Efficiency: How STC Ratings Derate in the Field
STC efficiency is a lab measurement. In the field, multiple loss factors reduce system output below STC predictions. Accurate yield modeling accounts for each one.
Temperature Derating
Panels in direct sun reach cell temperatures 20-35°C above ambient air temperature. A panel with an ambient temperature of 30°C may have a cell temperature of 55-65°C. Using the temperature coefficient formula:
Output change = Temp coefficient × (Cell temp - 25°C)For a TOPCon panel (-0.30%/°C) with cell temperature at 65°C:
- Output change = -0.30% × (65 - 25) = -12.0% below STC output
For an HJT panel (-0.26%/°C) at the same cell temperature:
- Output change = -0.26% × (65 - 25) = -10.4% below STC output
The HJT panel produces 1.6 percentage points more output in that condition. Across a full summer day in a hot climate, this adds up to a meaningful yield advantage.
| Panel Technology | Temp Coeff | Output Loss at 65°C Cell Temp | vs. HJT |
|---|---|---|---|
| HJT / ABC Back-Contact | -0.25 to -0.27%/°C | 10.0-10.8% | Baseline |
| IBC Back-Contact | -0.26 to -0.30%/°C | 10.4-12.0% | +0.4-1.2% loss |
| TOPCon | -0.29 to -0.32%/°C | 11.6-12.8% | +1.6-2.0% loss |
| Monocrystalline PERC | -0.35 to -0.40%/°C | 14.0-16.0% | +4.0-5.2% loss |
| Polycrystalline | -0.39 to -0.43%/°C | 15.6-17.2% | +5.6-6.4% loss |
This is why temperature coefficient matters for hot-climate system specifications, not just peak efficiency.
Irradiance Derating (Low-Light Performance)
STC uses 1,000 W/m² irradiance. On overcast days, irradiance falls to 100-300 W/m². Most panels lose efficiency at lower irradiance levels, though the degree varies by technology.
HJT panels show some of the best low-irradiance performance due to their amorphous silicon layer reducing surface recombination. TOPCon performs comparably in most conditions. Back-contact modules excel here as well — Maxeon IBC panels are known for low-irradiance advantage in markets like northern Europe where diffuse irradiance days dominate. Also see: European Solar Incentives.
For accurate yield modeling in cloudy climates, use measured low-irradiance efficiency data from manufacturer datasheets, not just the STC figure.
Additional System Losses
A full system performance ratio typically accounts for these loss factors:
| Loss Source | Typical Range | Notes |
|---|---|---|
| Temperature losses | 5-10% | Depends on climate and technology |
| Irradiance (low-light) | 3-8% | Higher in cloudy climates |
| Soiling / dust | 2-5% | Climate and maintenance dependent |
| Shading (near and far) | 2-15% | Site-specific — analyze with software |
| DC cable / resistive | 1-2% | Wire sizing and run length |
| Module mismatch | 1-3% | Reduces with MLPE (optimizers/microinverters) |
| Inverter losses | 2-4% | Inverter efficiency at operating point |
| Availability (downtime) | 1-2% | Inverter faults, grid outages |
Typical system Performance Ratio: 0.75 to 0.85
An efficient system on a well-designed roof with quality wiring achieves 0.82-0.85 PR. A poorly designed or heavily shaded system can fall below 0.75. Understanding these losses is why choosing high-efficiency panels alone does not guarantee high-output systems — the full system loss picture matters equally.
For sites with shading, the solar shadow analysis tool quantifies shading losses per string and per panel, enabling layout decisions that account for the efficiency derating directly.
Design with Real Efficiency Data
SurgePV’s solar design software lets you specify any module from a full equipment library, model real-world derating factors, and generate accurate energy yield reports for client proposals.
Book a DemoNo commitment required · 20 minutes · Live project walkthrough
For a direct comparison, see Arka 360 vs SurgePV.
Commercial Module Efficiency: 500W+ Format Database
Commercial and utility-scale installations use larger-format modules to reduce labor and balance-of-system costs. These panels maintain competitive efficiencies with residential modules while delivering significantly higher power output per unit.
| Brand | Model | Technology | Efficiency | Power (W) | Temp Coeff | Annual Degradation |
|---|---|---|---|---|---|---|
| Risen Energy | HJT XL Series | HJT | 23.8% | 740W | -0.26%/°C | 0.30%/yr |
| Jinko Solar | Tiger NEO N-type | TOPCon | 23.0-24.0% | 620-700W | -0.30%/°C | 0.40%/yr |
| Trina Solar | Vertex N | TOPCon | 22.5-23.0% | 600-670W | -0.30%/°C | 0.40%/yr |
| Astronergy | Astra N7 Commercial | TOPCon | 23.5% | 620W | -0.29%/°C | 0.40%/yr |
| SEG Solar | YUKON N | TOPCon | 22.7% | 585W | -0.30%/°C | 0.40%/yr |
| Canadian Solar | BiKu CS7N | Bifacial TOPCon | 22.3% | 655W | -0.30%/°C | 0.40%/yr |
Large-format commercial modules reduce the number of connections, string calculations, and installation labor hours per kWp. The tradeoff is structural — 600W+ panels are heavier (28-35 kg) and require structural verification for rooftop commercial applications. Ground-mount and carport applications handle large-format modules more easily. For more on this topic, see Commercial Solar Carport Design Guide.
For commercial project specifications, the generation and financial tool models both large-format and standard residential modules, calculating kWh yield and financial return on different module configurations for the same roof area.
Bifacial Modules: The Effective Efficiency Gain
Most N-type panels listed above are available in bifacial variants that capture reflected light from the rear surface. Bifacial gain — the additional energy captured from rear-side irradiance — ranges from 5% to 25% depending on installation conditions.
The bifacial gain formula:
Effective output = Front output × (1 + Bifacial factor × Ground albedo × Rear irradiance fraction)In practical terms, a bifacial panel with a 70% bifacial factor installed over a light-colored roof with 25% albedo captures an additional 5-10% energy annually. Over white gravel (30-40% albedo) on a ground mount, the gain reaches 15-20%.
Conditions that maximize bifacial gain:
- High ground/surface albedo (light-colored substrate)
- Elevated mounting height (1m+ above ground)
- East-west orientation (more diffuse rear illumination)
- Open racking with no obstruction behind panels
Conditions that minimize bifacial gain:
- Dark roofing material (low albedo)
- Flush-mounted rooftop installations
- Modules mounted close to ground surfaces
The effective module efficiency of a bifacial panel in optimal conditions:
| Base Module Efficiency | Bifacial Gain (15%) | Effective Efficiency |
|---|---|---|
| 25.0% (Aiko ABC) | +3.75% | 28.75% |
| 24.0% (TOPCon) | +3.60% | 27.60% |
| 22.3% (HJT) | +3.35% | 25.65% |
| 20.5% (Standard mono) | +3.08% | 23.58% |
These effective efficiency figures apply only under favorable bifacial conditions. For bifacial system design details including row spacing requirements and rear-shading calculations, the full design guide covers the complete modeling process.
Bifacial gains also factor into inter-row spacing. Closer rows increase mutual shading on the front surface but also reduce rear irradiance. The optimal row spacing for bifacial systems is wider than for monofacial — typically 2.5-3.5x panel height vs. 2-3x for monofacial. Inter-row spacing calculations require site-specific irradiance modeling.
Degradation Rates: Which Technology Stays Efficient Longer?
Module efficiency at installation is not the number that determines 25-year energy production. Annual degradation rate determines how much of that initial efficiency remains decade by decade.
The comparison between N-type and P-type technology on degradation is one of the clearest advantages of modern panels: See our guide on Floating Solar Farms France for more.
| Technology | Annual Degradation | Year-10 Output | Year-25 Output |
|---|---|---|---|
| IBC Back-Contact (Maxeon) | 0.25%/yr | 97.5% | 93.9% |
| ABC Back-Contact (Aiko) | 0.25%/yr | 97.5% | 93.9% |
| HJT (REC, Panasonic) | 0.25-0.30%/yr | 97.2-97.5% | 92.3-93.9% |
| N-type TOPCon | 0.35-0.40%/yr | 96.5-96.5% | 90.0-91.6% |
| Monocrystalline PERC | 0.50-0.60%/yr | 95.0-94.2% | 87.5-85.9% |
| Polycrystalline | 0.60-0.70%/yr | 94.1-93.2% | 86.0-83.8% |
On a 10 kW system, the difference between Maxeon IBC (0.25%/yr) and PERC (0.55%/yr) at year 25:
- IBC output: 9,390W
- PERC output: 8,670W
- Delta: 720W — roughly 900-1,200 kWh/year of additional generation
That difference materializes in energy savings, utility bill reduction, and any PPA or FIT revenue. For projects with long-term financial models, degradation rate often changes the NPV calculation more than the upfront efficiency premium.
N-type panels are also largely free of Light-Induced Degradation (LID). P-type PERC cells experience rapid efficiency drop in the first hours of sun exposure due to boron-oxygen defects, which manufacturers partially mitigate with factory pre-conditioning treatments. N-type cells use phosphorus-doped silicon, which has no boron-oxygen defect mechanism — so first-year LID does not apply.
How to Use Module Efficiency Data in Solar System Design
Efficiency data from this database affects four elements of system design directly.
1. Layout Density and System Size
Higher efficiency panels pack more power into a given roof footprint. On a 25 m² net-available rooftop (after setbacks and obstructions):
| Module Efficiency | Power Density | Max System Size (25 m²) |
|---|---|---|
| 25.0% | 250 W/m² | 6.25 kW |
| 23.8% | 238 W/m² | 5.95 kW |
| 22.3% | 223 W/m² | 5.58 kW |
| 20.5% | 205 W/m² | 5.13 kW |
The difference between top-tier and mid-tier efficiency on a constrained roof is over 1 kW — significant when sizing to meet consumption targets.
In solar design software, the panel library pulls manufacturer efficiency data and models panel-by-panel layout considering roof shape, tilt, and keepout zones. Running two layout scenarios — one with 22% panels and one with 24% panels — takes under a minute and shows the capacity difference directly.
2. String Sizing
Higher wattage panels often come with higher open-circuit voltage (Voc) and short-circuit current (Isc). When switching to higher-efficiency modules, verify that string sizing remains within inverter MPPT voltage ranges. A 520W TOPCon panel may have higher Isc than a 445W IBC panel — enough to change the maximum safe string length on some inverters.
3. Inverter DC/AC Ratio
A more efficient panel arrangement often generates higher peak DC output from a fixed roof area. This affects the DC/AC ratio and inverter loading. For inverters already operating near clipping limits, upgrading to higher-efficiency panels in the same layout can increase clipping losses. Rerun the energy yield simulation with the new module specs before confirming the inverter is appropriate.
4. Energy Yield and Proposal Accuracy
Efficiency data — combined with temperature coefficient and degradation rate — feeds into the generation and financial tool that powers the production simulation and financial proposal. Using manufacturer-specific derating inputs rather than generic defaults improves yield prediction accuracy by 3-8% in most cases. Accurate yield predictions reduce post-installation disputes and improve customer trust.
Check the Equipment Library First
Before specifying a module, verify it is in your design software’s equipment library with current datasheet values. Using outdated module specs — even for the right model name — can introduce yield calculation errors if power ratings or temperature coefficients have been revised. SurgePV’s module library is updated from manufacturer databases quarterly.
Efficiency Tier Guide: Matching Module Efficiency to Project Type
Not every project needs the most efficient panels. The following guide maps efficiency tiers to project types based on the constraints that drive the choice.
| Efficiency Tier | Typical Technology | Best Suited For | When to Avoid |
|---|---|---|---|
| 24-25% (Premium back-contact) | IBC, ABC, HPBC | Constrained rooftops under 25 m²; premium residential installs; sites where max kW matters; export-limited systems maximizing watts per m² | Open ground mounts with no space constraint; budget-sensitive residential where cost/W is the primary driver |
| 22-24% (High N-type) | TOPCon, HJT | Standard residential and commercial; hot-climate installs (favor HJT in this tier); most C&I rooftop projects | Budget residential with excess roof space |
| 20-22% (Mainstream N-type) | TOPCon, entry HJT | Residential with ample roof area; large commercial where cost-per-W dominates; utility-scale with no space constraint | Small rooftops; premium installs; projects requiring long degradation warranty |
| Under 20% (PERC and below) | Monocrystalline PERC, bifacial PERC | Budget applications; large ground mounts where land cost is negligible; retrofit expansions matching existing installed systems | Any new install where quality N-type options are price-competitive |
The break-even analysis for premium efficiency:
Suppose a TOPCon panel at 22.5% costs $0.30/W and an IBC panel at 24.1% costs $0.45/W. On a 30 m² roof:
- TOPCon system: 22.5% × 10 × 30 m² = 6.75 kW → cost: $2,025
- IBC system: 24.1% × 10 × 30 m² = 7.23 kW → cost: $3,254
The IBC system generates 480W more capacity at a cost premium of $1,229. At $0.15/kWh electricity and 1,300 peak sun hours, the additional 480W produces about 624 kWh/year — worth $93.60/year. Payback on the premium: 13 years.
On a 15 m² constrained roof where the TOPCon system can only reach 3.375 kW but the IBC system reaches 3.615 kW, the additional 240W of capacity might represent the difference between meeting a customer’s consumption target or not. In that case, the premium is justified by the value of the capacity gain, not the raw payback calculation.
Every project has a different break-even. The generation and financial tool runs both scenarios against real consumption data and shows the NPV and payback for each.
Half-Cut Cells and Module-Level Efficiency Optimization
The majority of panels in this database use half-cut cell technology. It deserves explanation because the efficiency gains are additive to the cell-type improvements described above — and they appear across all four architectures.
A conventional 60-cell panel connects all cells in series, meaning a single shaded cell reduces output for the entire string of cells it belongs to. Half-cut cells split each 166mm or 210mm cell into two 83mm or 105mm halves using a laser cutting process. The resulting panel contains 120 half-cells wired in two parallel sub-strings.
This produces two measurable efficiency improvements:
Reduced resistive losses. Cutting a cell in half halves its current output. Electrical resistive losses scale with the square of current (P = I²R). Half the current means one-quarter the resistive heating losses in the cell’s internal circuitry. On a 500W panel, this alone recovers 0.3-0.5% absolute efficiency.
Partial shading tolerance. When shade hits the lower half of a half-cut panel, only one of the two internal sub-strings loses output. The upper sub-string continues generating. A fully shaded lower half reduces total panel output by only 50%, compared to a near-total output loss on a conventional full-cell panel under the same shade condition.
Every panel in the top 10 of this database uses half-cut or full-cell back-contact designs that achieve the same low-resistance benefit through their architecture. For constrained rooftops with nearby obstructions — chimneys, vent pipes, neighboring buildings — how shading affects panel output explains why the sub-string architecture matters beyond raw efficiency numbers.
The full-cell vs. half-cut comparison also affects temperature coefficient in practice: lower resistive heating in half-cut panels keeps cell temperatures slightly lower under load, which reduces temperature-related derating by 0.1-0.3% under full-sun conditions.
For a direct comparison of how these cell construction choices play out across technologies, the half-cut vs. full-cell solar panels guide covers the tradeoffs in depth.
Module Warranty Terms and What They Mean for Long-Term Efficiency
Efficiency rankings at installation are one number. The warranty structure determines the guaranteed minimum efficiency at years 10 and 25 — the numbers that matter for long-term financial models.
Most premium N-type modules carry two distinct warranty guarantees:
Product warranty (materials and workmanship): 12-15 years for standard modules, up to 40 years for Maxeon IBC panels. This covers manufacturing defects, delamination, frame corrosion, and junction box failure.
Performance warranty (power output guarantee): Specifies the minimum output at defined years. The structure varies significantly by manufacturer and technology:
| Brand | Technology | Year-1 Guarantee | Year-25 Guarantee | Annual Degradation Implied |
|---|---|---|---|---|
| Maxeon (IBC) | IBC | 98.0% | 92.0% | 0.25%/yr |
| Aiko Solar | ABC | 98.0% | 92.0% | 0.25%/yr |
| REC Alpha Pure-R | HJT | 98.0% | 92.0% | 0.25%/yr |
| Panasonic EverVolt | HJT | 98.0% | 92.0% | 0.26%/yr |
| Jinko Tiger NEO | TOPCon | 98.0% | 87.4% | 0.45%/yr |
| Trina Vertex S+ | TOPCon | 98.0% | 87.4% | 0.45%/yr |
| Canadian Solar HiHero | HJT | 98.0% | 88.4% | 0.39%/yr |
| Standard mono PERC | PERC | 97.5% | 83.7% | 0.55%/yr |
The difference between 87.4% and 92.0% at year 25 on a 10 kW system is 460W — roughly 575-650 kWh of annual energy generation in a typical mid-latitude climate. Over years 20-25, that difference compounds.
When presenting system proposals to commercial or industrial clients with 20+ year investment horizons, the year-25 performance guarantee carries more weight than the initial efficiency number. Clients evaluating lease agreements, PPAs, or green energy certificates need to know the minimum output floor. The guaranteed degradation rate from the warranty, not the typical degradation, is the conservative number to use in financial models.
For residential clients, the practical difference between 87% and 92% year-25 output often amounts to $1,500-3,000 in additional electricity savings over 25 years, depending on electricity prices and system size. Framing this correctly in proposals — using the solar proposal software that models multi-year production with degradation curves — differentiates technical installers from those who quote flat annual production estimates.
Frequently Used Specifications in System Design
A quick reference for the most commonly specified efficiency metrics used in system design documentation and permit packages:
| Metric | What It Measures | Where It Appears |
|---|---|---|
| STC Efficiency (%) | Output at 1,000 W/m², 25°C, AM 1.5 | Datasheets, module library, energy yield calculations |
| NOCT Efficiency | Output at 800 W/m², 20°C ambient, 1 m/s wind | Thermal modeling, NOCT-based yield estimates |
| Temperature Coefficient (%/°C) | Efficiency loss per degree above 25°C | Thermal derating in energy models |
| Power Density (W/m²) | Power output per unit panel area | Roof layout and system sizing |
| Bifacial Factor (%) | Rear surface vs. front surface efficiency ratio | Bifacial gain modeling |
| Annual Degradation (%/yr) | Yearly efficiency loss over panel lifetime | 25-year financial projections |
| Year-25 Performance Guarantee (%) | Minimum output at end of warranty period | Warranty comparison and financing |
These specifications appear in permit packages, energy yield reports, and financing applications. For installers using solar software, the module library populates these values directly from datasheet data, reducing manual entry errors.
Conclusion
The efficiency gap between the best and most mainstream solar panels in 2026 is 3+ percentage points — enough to change system sizing by 1-2 panels on a typical residential roof. For constrained installations, back-contact technology (IBC, ABC, HPBC) at 24-25% efficiency justifies its premium. For standard residential and commercial projects with adequate roof space, TOPCon panels in the 22-24% range offer the best cost-efficiency balance.
Three actions for installers and designers:
- Match efficiency tier to project constraint: Run the layout on 22-24% and 24-25% panels and compare system size. If the capacity difference is under 5%, the premium tier is rarely worth the cost.
- Weight temperature coefficient in hot climates: In markets where summer ambient temperatures exceed 30°C, HJT or ABC back-contact panels produce measurably more energy than TOPCon despite similar STC efficiency ratings.
- Use degradation rate in 25-year NPV models: N-type panels retain 90-94% output at year 25 vs. 84-88% for PERC. On commercial projects with long-term PPAs, this changes the financial case for premium modules.
Frequently Asked Questions
What is the most efficient solar panel available in 2026?
The Aiko Solar Neostar 3P54 holds the top position at 25.0% module efficiency using ABC (All Back Contact) cell architecture. It is followed by Recom Technologies Black Tiger Series at 24.8% and LONGi Hi-MO X10 Explorer at 24.3%. These are residential-format panels. Commercial bifacial modules from Jinko and Trina with TOPCon cells now exceed 700W output.
What is the difference between cell efficiency and module efficiency?
Cell efficiency measures how well a single solar cell converts light to electricity under controlled conditions. Module efficiency measures the entire panel — cells plus frame, glass, busbars, and wiring — and is always lower than cell efficiency due to inactive area. A cell rated at 27% might yield a module at 24-25%, depending on cell layout and packing density. Module efficiency is the number relevant for system design and roof area calculations.
Is a higher-efficiency solar panel always worth the premium cost?
Not always. Higher efficiency directly reduces the roof area required for a given system size. On constrained rooftops, the efficiency premium is worth paying. On open ground mounts or large commercial rooftops with ample space, extra capacity from additional standard panels often costs less per watt than the premium efficiency uplift. The break-even depends on your cost-per-watt differential and available area.
How does temperature affect solar panel efficiency?
Solar panels lose output as cell temperature rises above 25°C. The loss rate is defined by the temperature coefficient, measured in %/°C. HJT and IBC panels have coefficients around -0.25 to -0.27%/°C. TOPCon panels lose about 0.29-0.32%/°C, and older PERC panels lose 0.35-0.40%/°C. In a climate where panels reach 65°C cell temperature, an HJT panel produces 10-15% more energy relative to PERC over the year.
What efficiency level do I need for a residential solar installation?
For most residential rooftops with adequate space, panels in the 20-22% efficiency range offer a strong cost-efficiency balance. If available roof area falls under 30 m² or shading requires tight layout optimization, moving to 22-24% panels makes sense. Panels above 24% efficiency are premium products suited to high-value installations where every square meter of roof space counts. Most installers specify TOPCon panels in the 21-23% range for standard residential projects.
Are TOPCon or HJT panels more efficient?
In peak module efficiency, back-contact panels (IBC/ABC) lead, followed by HJT, then TOPCon. However, TOPCon now reaches 23.8-24.0% at the top end, nearly matching HJT’s best commercial modules. The real difference is temperature performance: HJT panels have better temperature coefficients (-0.25 to -0.27%/°C vs. TOPCon’s -0.29 to -0.32%/°C), making HJT the better choice in hot climates. For temperate climates, the annual yield difference is under 2%.