A 5% error in annual energy yield can shift the net present value of a 50 MW solar plant by several million dollars. That is why every serious solar proposal, independent engineering report, and lender memo contains two numbers where homeowners might expect one: P50 and P90. The first is the median case. The second is the bankable case. Confusing them has killed financings, voided production guarantees, and turned expected profits into equity cures.
If you sell, design, or finance solar projects, you need to know which figure belongs in which conversation. This guide explains the difference between P50 and P90 solar estimates, shows how they are calculated, and maps each probability level to the decision it should drive. Teams using modern solar design software can generate both figures from the same hourly simulation instead of running separate models.
In this guide you will learn:
- What P50, P75, P90, and P99 actually mean in a yield report
- Why lenders care more about P90 than P50
- How to calculate P90 from P50 using real uncertainty inputs
- Typical P50/P90 spreads by region and project type
- Which stakeholders should use which P-level
- Common mistakes that inflate or misapply P90
- What to include in a bankable proposal or customer quote
Quick Answer
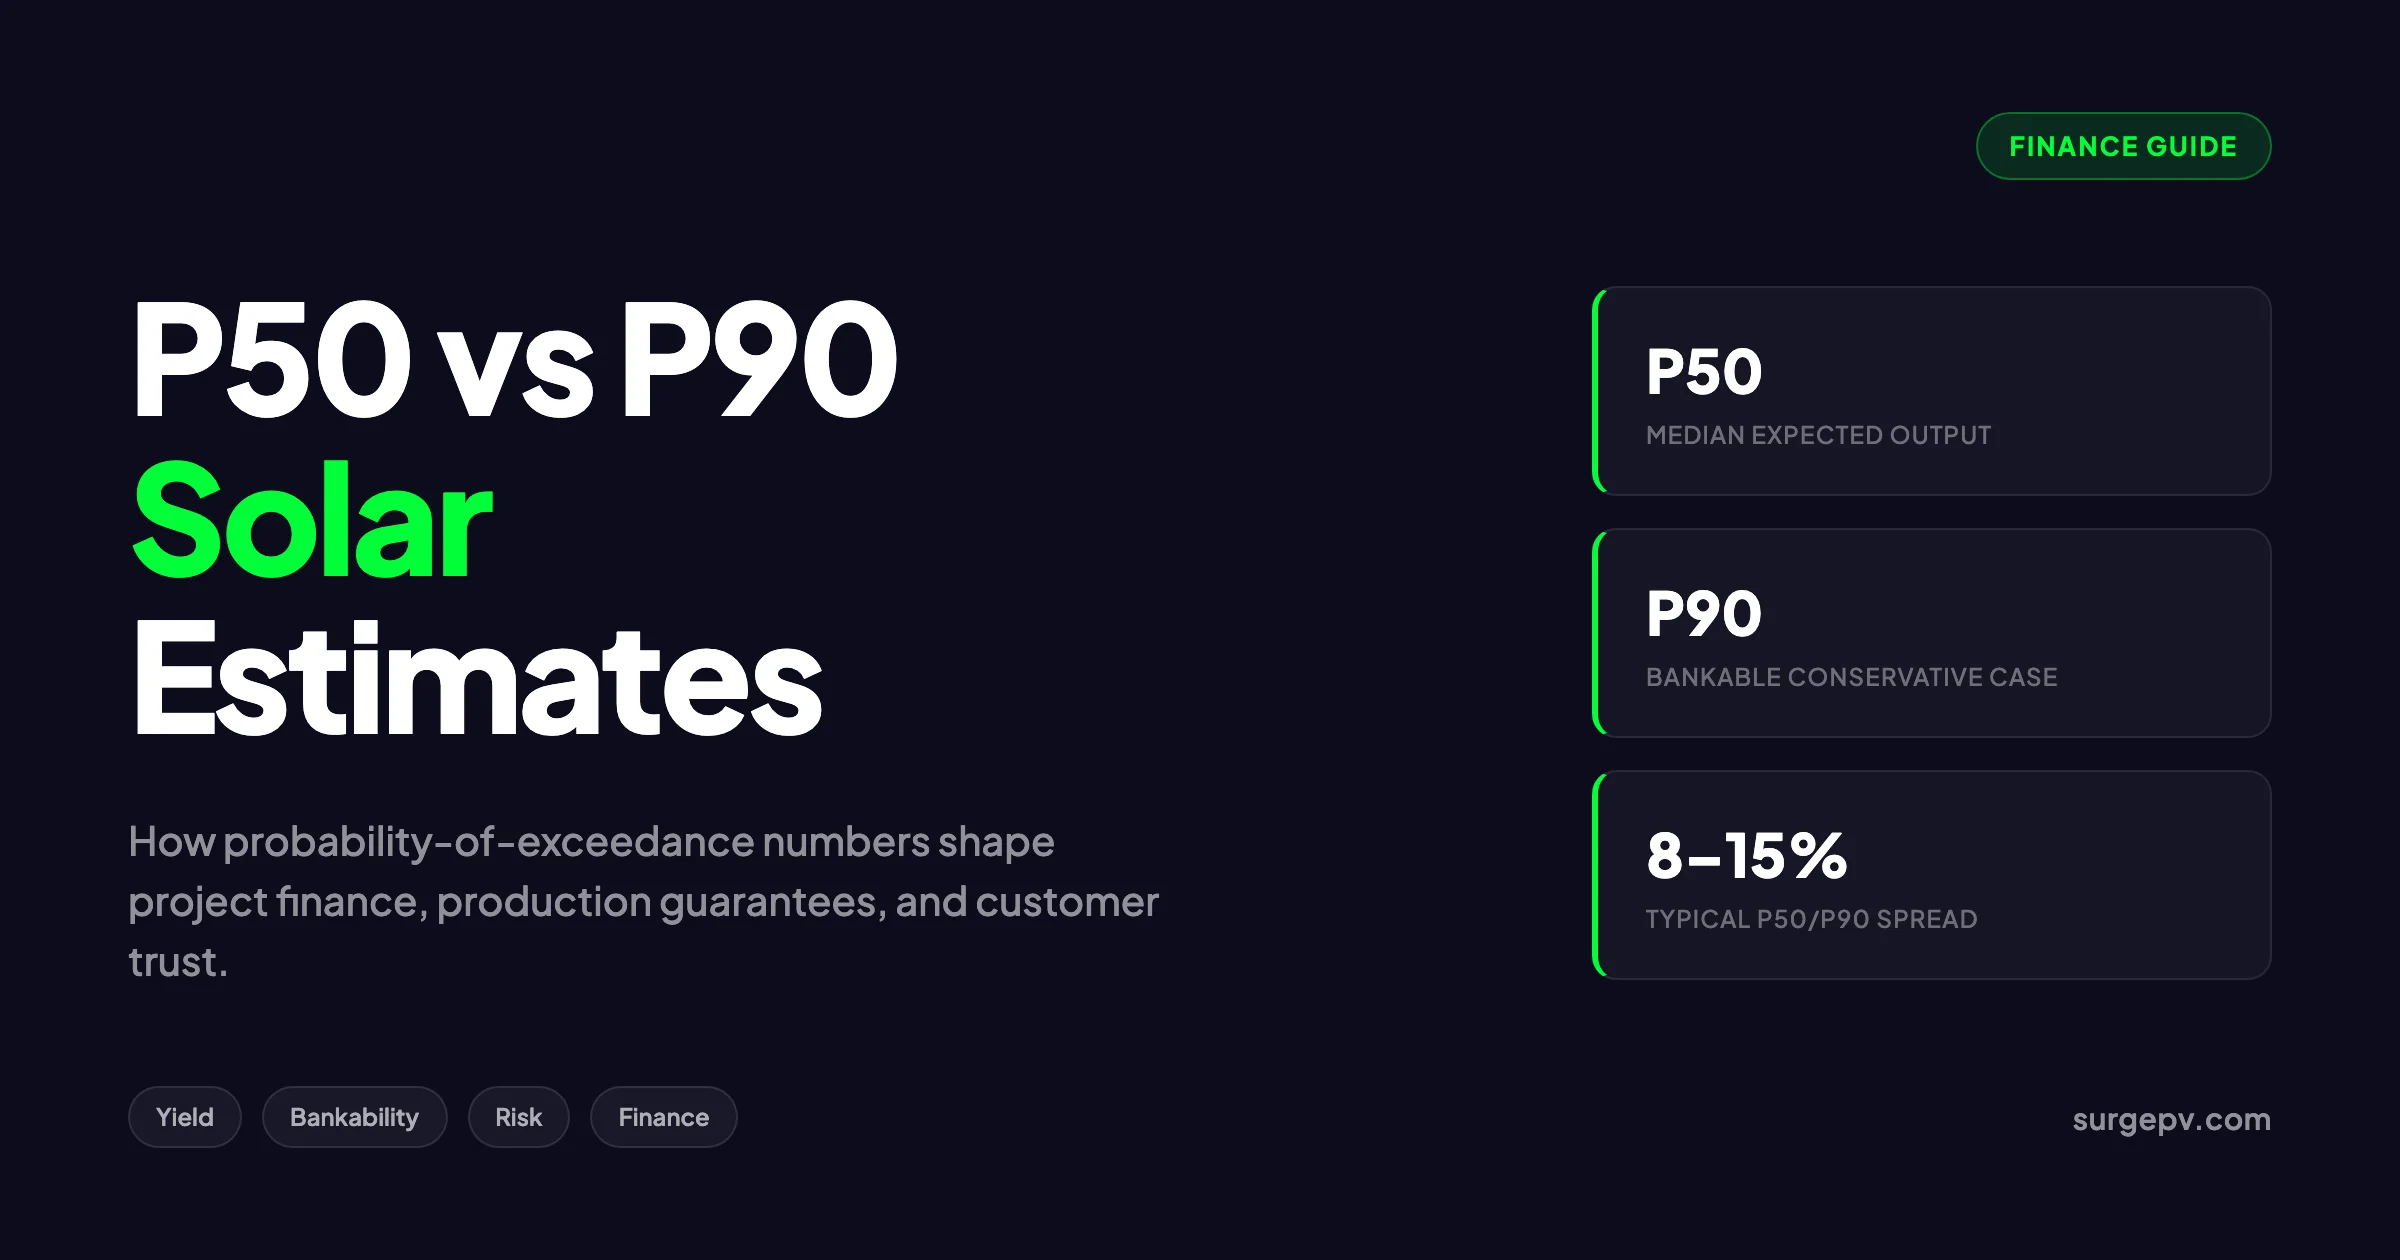
P50 vs P90 solar compares the median expected annual energy output with a conservative, bankable output. P50 means a 50% chance production will be at least that high; P90 means a 90% chance. P90 is typically 8–15% lower than P50 and is the figure lenders use for debt sizing.
What P50 and P90 Actually Mean
P50 and P90 are probability-of-exceedance values. They describe how likely a solar plant is to produce at least a given amount of energy in a given year.
- P50 is the median. In any single year, there is a 50% chance actual production will be above the P50 value and a 50% chance it will be below. Over the long life of a project, cumulative production should track close to P50.
- P90 is the conservative estimate. There is a 90% chance annual production will be at least the P90 value, and only a 10% chance it will fall below.
Think of a bell curve. P50 sits at the centre. P90 sits to the left, in the lower tail. The further left you move, the higher the confidence that any single year will beat that number.
Other P-values appear in reports too:
| P-value | Probability of exceedance | Common use |
|---|---|---|
| P50 | 50% | Expected returns, asset management target |
| P75 | 75% | Mid-case planning, some European project finance |
| P90 | 90% | Bank debt sizing, production guarantees |
| P99 | 99% | Stress testing, insurance, critical off-grid systems |
The gap between P50 and P90 is not a safety margin added by the engineer. It is the measured uncertainty in the yield estimate itself. A wider gap means less confidence in the prediction, usually because of variable weather or limited data.
Why P50/P90 Matters for Solar Finance
Solar projects are financed with long-term debt. Lenders do not ask whether the project will repay in an average year. They ask whether it will repay in a bad year. That is why P90 dominates project finance.
Debt service coverage ratio
The debt service coverage ratio, or DSCR, compares annual cash available for debt service to annual debt payments. Most lenders require a minimum DSCR of 1.20x to 1.35x in the P90 year. If the P90 revenue cannot cover debt service at that ratio, the loan size shrinks or the interest rate rises.
A project with a narrow P50/P90 spread has lower perceived risk. Lower risk means more debt capacity and a lower cost of capital. A wide spread signals uncertainty, which lenders price into higher interest rates or smaller loans.
Equity returns
Equity investors usually model returns around P50. This is the base case for internal rate of return and net present value. But experienced investors also run sensitivity cases at P75 and P90 to see how bad years affect distributions.
Production guarantees
Many EPC and O&M contracts include production guarantees. The guaranteed number is often set at or near P90. If the plant underperforms the guaranteed figure, the contractor pays liquidated damages. Using P50 as a guarantee is dangerous because actual output will fall below it roughly half the time.
Customer proposals
Residential and commercial customers want to know expected savings. P50 is the honest expected value. P90 shows what happens in a poor sun year. Proposals that only show P50 set customers up for disappointment when an El Niño or ash cloud year arrives. For customer-facing documents, solar proposal software can pull P50 and P90 numbers directly into branded, itemised quotes.
How P50 and P90 Are Calculated
P50 is produced by running an hourly energy yield simulation, usually with a Typical Meteorological Year dataset. P90 is derived from P50 by quantifying uncertainty and applying statistics.
Step 1: Build the base-case model
The simulation combines:
- Meteorological inputs: global horizontal irradiance, direct normal irradiance, diffuse horizontal irradiance, temperature, wind
- System design: module type, tilt, azimuth, DC/AC ratio, inverter efficiency
- Loss factors: soiling, shading, mismatch, wiring, transformer, availability, degradation
The output is an annual energy yield, usually expressed as kWh/kWp. This becomes the P50 value. A robust solar software platform automates this loss cascade and lets you compare multiple design iterations without rebuilding spreadsheets.
Step 2: Quantify uncertainty sources
Every input carries uncertainty. Common ranges for a well-modelled commercial project are:
| Uncertainty source | Typical range |
|---|---|
| Inter-annual weather variability | 3–7% |
| Irradiance dataset accuracy | 2–5% |
| PV simulation model uncertainty | 2–4% |
| Equipment performance tolerance | 1–3% |
| Soiling estimate | 1–4% |
| Degradation assumption | 0.5–1.5% |
| Shading model | 1–3% |
These values are not guesses. They come from validation studies, manufacturer datasheets, and independent engineering standards. Solargis, for example, publishes solar radiation model uncertainty around ±3.5% for satellite-derived datasets.
Step 3: Combine uncertainties with root-sum-square
Uncertainties are combined using root-sum-square, or RSS, because independent errors do not add linearly. The formula is:
σ_total = √(σ_weather² + σ_irradiance² + σ_model² + σ_equipment² + ...)Step 4: Apply the z-score
For a normal distribution, each P-value has a fixed z-score:
| P-value | Z-score |
|---|---|
| P75 | 0.675 |
| P90 | 1.282 |
| P95 | 1.645 |
| P99 | 2.326 |
The final formula is:
Pxx = P50 × (1 − z × σ_total)Worked example
Assume a 5 MW plant in India with these uncertainty inputs:
- P50 annual yield: 1,650 kWh/kWp
- Inter-annual weather variability: 4.5%
- Irradiance dataset uncertainty: 3.5%
- Model uncertainty: 3.0%
- Equipment tolerance: 2.0%
- Soiling uncertainty: 2.5%
Total uncertainty:
σ_total = √(4.5² + 3.5² + 3.0² + 2.0² + 2.5²) = √(20.25 + 12.25 + 9 + 4 + 6.25) = √51.75 ≈ 7.2%P90 calculation:
P90 = 1,650 × (1 − 1.282 × 0.072) = 1,650 × 0.908 = 1,498 kWh/kWpThe P50/P90 spread is 9.2%, which is typical for an Indian project with good but not perfect data.
Typical P50/P90 Spreads by Region and Project Type
The spread between P50 and P90 depends mainly on climate variability and data quality. Stable, sunny regions produce tighter spreads. Cloudy or monsoon-driven regions produce wider spreads.
| Region or climate | Typical P50/P90 spread | Main driver |
|---|---|---|
| Southwest US desert | 6–8% | Low inter-annual variability, high data quality |
| Southern Spain | 8–10% | Stable Mediterranean irradiance |
| Central India | 9–11% | Monsoon variability |
| Northern Europe | 12–17% | High cloud variability |
| Southeast Asia | 10–15% | Monsoon and haze events |
| UK | 11–15% | Frequent cloud cover |
Project type also matters. Residential rooftop systems often have wider spreads than utility-scale plants because shading and soiling are harder to model precisely. Off-grid systems with storage may use P95 or P99 because a shortfall has severe consequences.
P50 vs P90: How Each Stakeholder Should Use Them
Different decisions need different confidence levels. Using P50 for a lender memo or P90 for an equity return pitch creates mismatched expectations.
| Stakeholder | Primary metric | Why |
|---|---|---|
| Homeowner | P50, with P90 for worst-case savings | Sets realistic expectations and shows downside protection |
| Commercial buyer | P50 and P75 | Balances expected savings with budget certainty |
| EPC contractor | P90 for guarantees | Limits liquidated damages exposure |
| Equity investor | P50 for IRR/NPV | Base-case returns |
| Lender | P90 for DSCR | Protects debt repayment in poor years |
| Insurance underwriter | P95 or P99 | Prices tail risk |
| Off-grid designer | P90 or P99 | Ensures critical load coverage |
A good rule of thumb: P50 is for planning, P90 is for promising. If you are making a promise that triggers a penalty if broken, use P90 or lower.
Common Mistakes and Misconceptions
Treating P50 as a guarantee
This is the most expensive mistake. A P50 value will be exceeded only half the time. If a customer or lender expects the P50 number every year, the project will disappoint them within the first few years of operation.
Ignoring inter-annual variability
Some teams run a single TMY year and call it P50. That ignores the fact that real weather varies from year to year. A proper P50/P90 analysis uses 10 to 20 years of data, or a TMY dataset that represents long-term variability.
Using the wrong weather dataset
Not all irradiance datasets are equal. Satellite-derived data may have ±3.5% uncertainty. Ground-measured data can reduce that to ±2% if it covers 12 months or more. Using a low-resolution dataset inflates the P50/P90 spread and makes the project look riskier than it is.
Confusing P90 with percentile
P90 is a probability of exceedance, not a percentile rank. In a percentile view, P90 would be the 10th percentile because 90% of outcomes are above it. The language is inverted, which causes confusion in reports and contracts. Always define the term when sharing with non-technical stakeholders.
Forgetting degradation
P50 and P90 are usually calculated for year one. Over 25 years, module degradation shifts both values downward. A production guarantee should specify whether it applies to year one or is degradation-adjusted over the contract term.
Practical Guidance for Proposals and Reports
What to include in a customer proposal
A transparent solar proposal should show:
- P50 annual production, clearly labelled
- P90 annual production, clearly labelled
- Monthly production breakdown for at least the first year
- Degradation-adjusted output for years 5, 10, and 25
- Savings estimates based on both P50 and P90
- Assumed electricity tariff and escalation rate
- Software and weather dataset used
What to include in a lender report
Lender-grade yield reports need more detail:
- 8,760 hourly simulation output
- Full loss cascade with quantified assumptions
- Uncertainty table with each source and value
- P50, P75, and P90 annual energy
- DSCR calculation in the P90 year
- Sensitivity cases for soiling, degradation, and curtailment
- Independent engineering review for large projects
When to upgrade from P90 to P99
Most grid-tied commercial projects do not need P99. Use P99 when:
- The project is off-grid and must cover critical loads
- Insurance or warranty pricing depends on tail risk
- The offtaker has zero tolerance for shortfall
- The project is in a highly variable climate
Reducing the P50/P90 spread
You can narrow the spread, and therefore improve financing terms, by:
- Using high-quality, long-term irradiance data
- Adding on-site measurements for 12 months or more
- Improving shading accuracy with shadow analysis and 3D modelling
- Using validated simulation software
- Documenting soiling assumptions with local measurements
- Updating the model after the first year of operation
Model P50, P75, and P90 in One Workflow
SurgePV’s generation and financial tool lets you run hourly yield simulations and see how P50, P75, and P90 outputs flow straight into payback, IRR, and DSCR.
Explore the Financial ToolBuilt for installers, EPCs, and finance teams who need bankable numbers.
Frequently Asked Questions
What is the difference between P50 and P90 in solar?
P50 is the median annual energy yield, meaning there is a 50% chance actual production will be higher and a 50% chance it will be lower. P90 is a conservative estimate exceeded 90% of the time, so it is lower than P50 and is used for bank financing and production guarantees.
Why do banks use P90 instead of P50 for solar projects?
Banks use P90 because it reflects a downside year. Debt service coverage ratio calculations must show the project can repay loans even when weather is worse than average. P50 leaves a 50% chance of underperformance, which is too risky for lenders.
How is P90 calculated from P50?
P90 is calculated by combining all sources of uncertainty using root-sum-square, then applying the normal distribution z-score for 90% exceedance, which is 1.282. The formula is P90 = P50 × (1 − 1.282 × total uncertainty).
What is a typical P50 to P90 spread for solar?
The spread is usually 8–15% for utility and commercial projects. Stable desert climates may see a 6–8% gap, while cloudy or monsoon-driven regions can see 12–17%. Residential systems often fall in the 10–15% range.
Should solar proposals show P50 or P90?
Transparent proposals should show both. P50 sets realistic expected-return expectations, while P90 shows the conservative case. Some installers also include P75 as a practical midpoint for homeowners.
What uncertainty sources affect P50/P90 calculations?
Main sources include inter-annual weather variability, irradiance dataset accuracy, simulation model uncertainty, equipment performance tolerance, soiling estimates, shading, and degradation assumptions.
When should a project use P99 instead of P90?
P99 is used for stress testing, insurance pricing, or critical off-grid systems where even a 10% chance of shortfall is unacceptable. Most grid-tied commercial projects stop at P90 for financing.
Can P50 and P90 change after a project is built?
Yes. Adding on-site measured irradiance, refining loss assumptions, or updating to a longer weather dataset can narrow the uncertainty band and raise P90 without changing the physical plant.