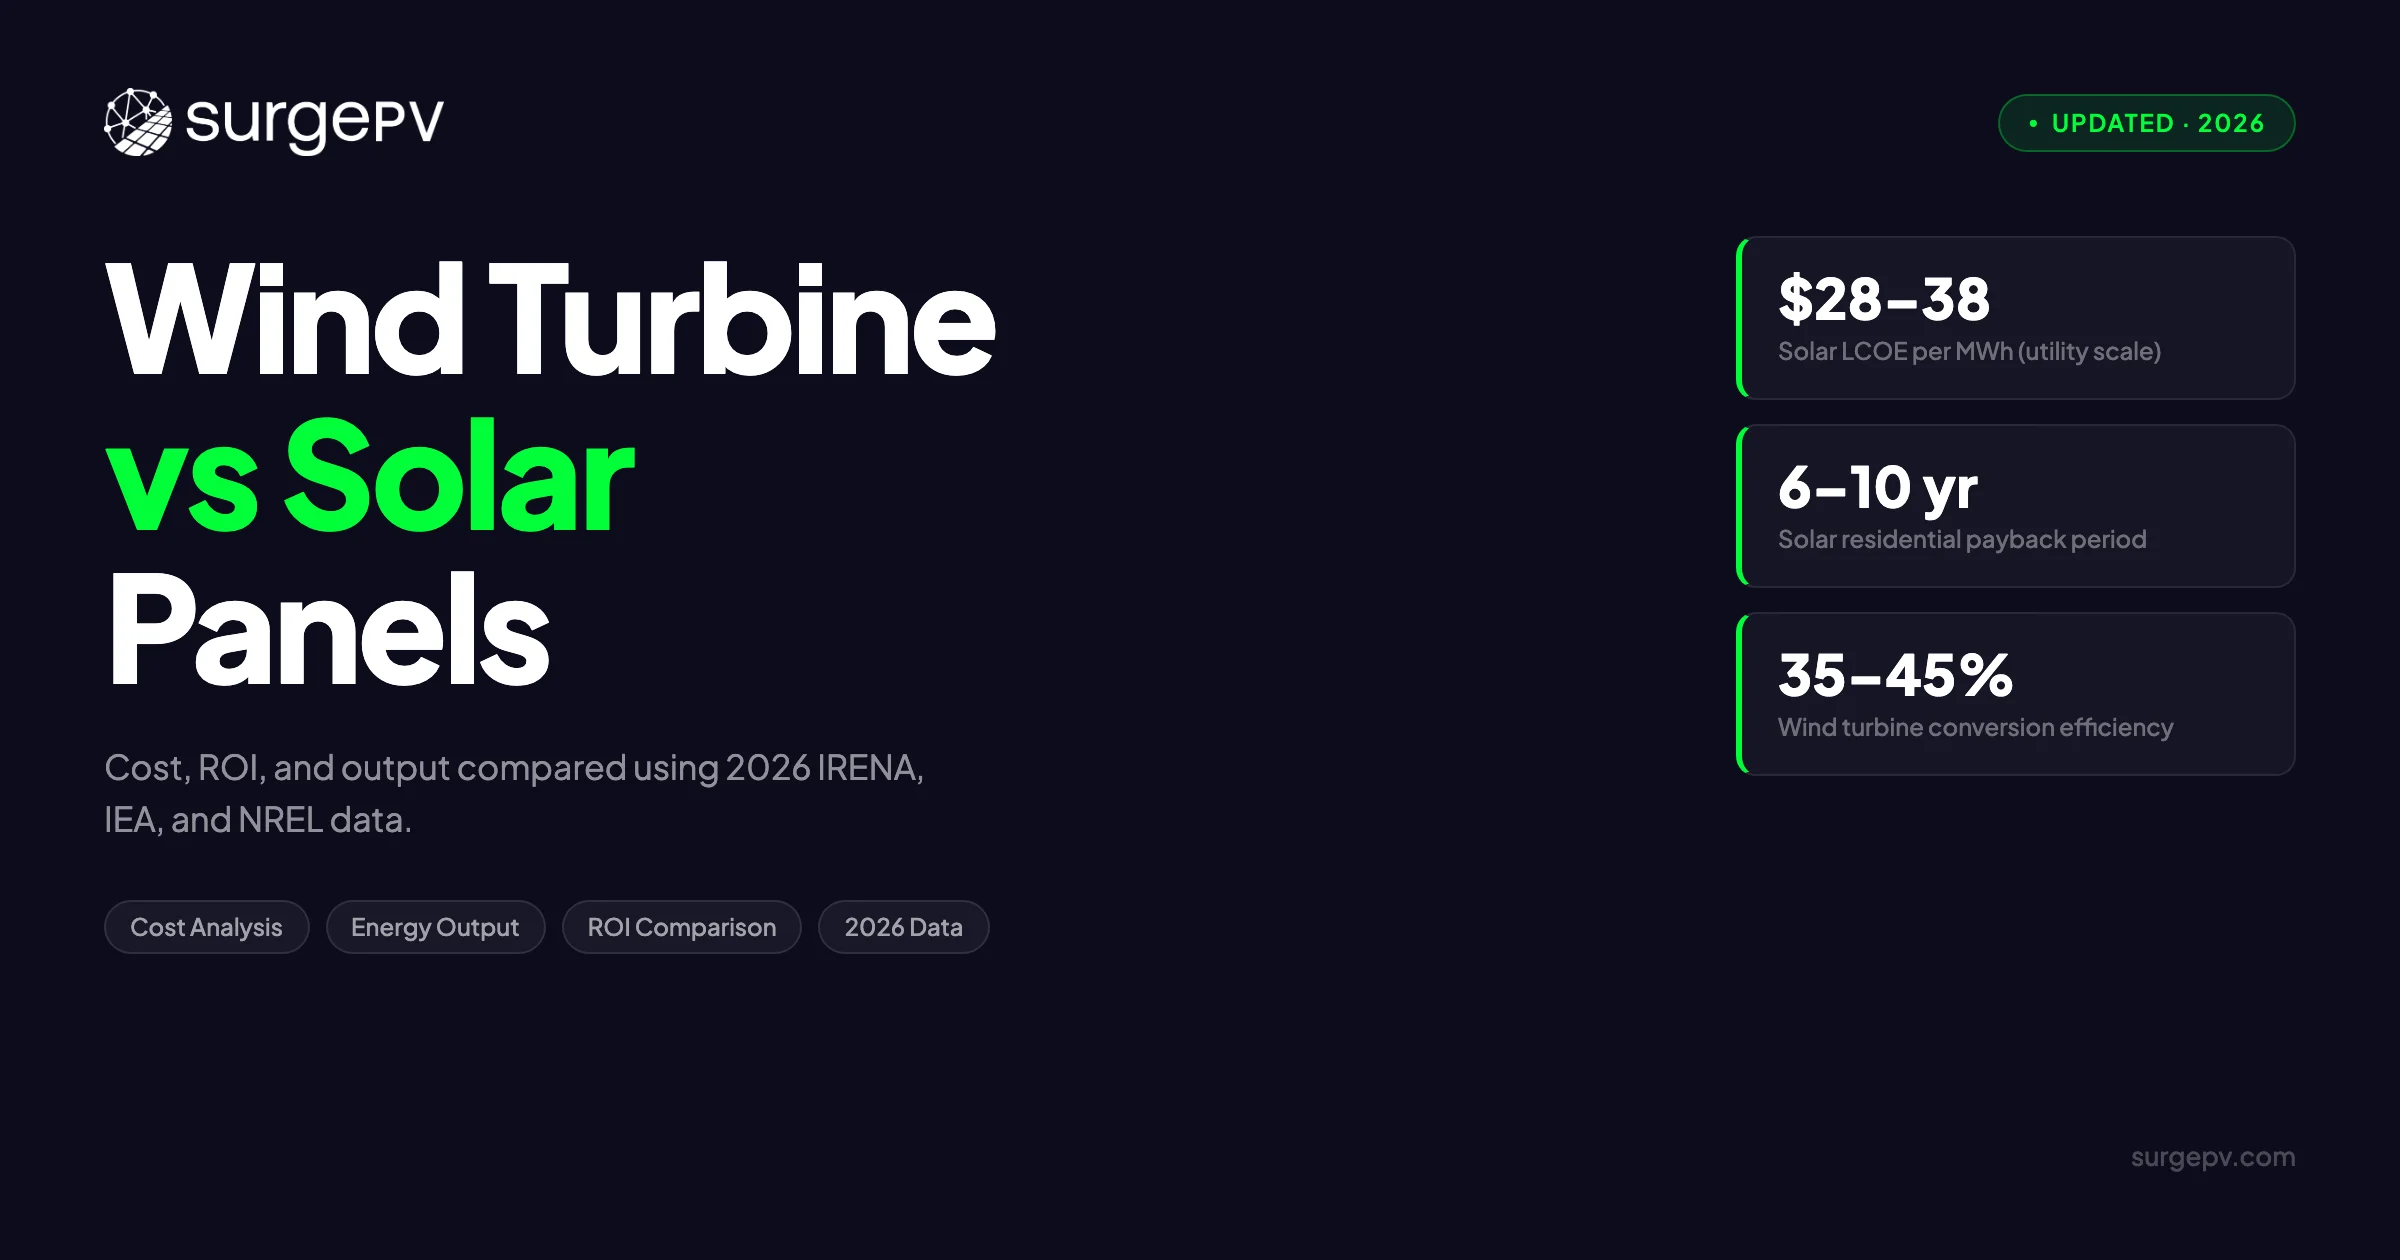
Quick Answer
Solar PV costs $0.03–$0.06/kWh with 15–25% capacity factor; onshore wind costs $0.02–$0.05/kWh with 25–45% capacity factor. Solar wins on modularity and faster deployment (3–6 months vs 12–24 months). Wind requires less land per MWh but has higher visual impact. Hybrid wind-solar systems maximize asset utilization by combining complementary generation profiles.
etter” technology. Every number below comes from 2025–2026 data published by IRENA, the IEA, NREL, and Lazard. A gearbox typically increases rotation speed from about 50 rpm to roughly 1,500 rpm for efficient generation.”
Solar PV costs $0.03–$0.06/kWh with 15–25% capacity factor; onshore wind costs $0.02–$0.05/kWh with 25–45% capacity factor. Solar wins on modularity and faster deployment (3–6 months vs 12–24 months). Wind requires less land per MWh but has higher visual impact.
Choosing between a wind turbine and solar panels is not about picking the “better” technology. It is about matching the right system to your site, your budget, and your energy goals.
Solar PV costs $0.03–$0.06/kWh with 15–25% capacity factor; onshore wind costs $0.02–$0.05/kWh with 25–45% capacity factor. Solar wins on modularity and faster deployment (3–6 months vs 12–24 months). Wind requires less land per MWh but has higher visual impact. Hybrid wind-solar systems maximize asset utilization by combining complementary generation profiles.
We have designed both wind-solar hybrid systems and standalone PV arrays at SurgePV. The data is clear: for most homes and commercial buildings, solar wins on simplicity, cost, and predictability. But wind has real advantages in specific locations — especially rural properties with steady airflow and off-grid sites where reliability matters more than upfront cost. For a direct comparison, see Arka 360 vs SurgePV.
In this guide, we compare wind turbines and solar panels across the metrics that actually determine project success: installation cost, energy output, efficiency, maintenance burden, and long-term ROI. Every number below comes from 2025–2026 data published by IRENA, the IEA, NREL, and Lazard.
TL;DR — Wind Turbine vs Solar
For most residential and commercial applications, solar panels offer lower upfront costs ($20K–$30K vs. $50K–$75K for wind), faster payback (6–10 years vs. 12–20 years), and minimal maintenance. Wind turbines achieve higher conversion efficiency (35–45% vs. 20–25%) and can generate power 24/7 in optimal locations, but require consistent wind speeds of 10+ mph, significant space, and regular mechanical servicing. On a utility scale, both technologies now produce electricity cheaper than any fossil fuel source (IEA, 2026).
In this guide:
- How wind turbines and solar panels convert energy — the physics in plain terms
- Installation cost comparison: residential and utility-scale
- Energy output and efficiency: real-world numbers by system size
- Maintenance requirements and long-term operating costs
- ROI and payback analysis with worked examples
- Location suitability: when wind wins, when solar wins, and when hybrid makes sense
- Environmental impact comparison
- 2026 technology trends and what they mean for buyers
How Wind Turbines and Solar Panels Generate Electricity
Before comparing costs and output, it helps to understand what each system actually does.
Solar panels use the photovoltaic effect. When photons from sunlight strike silicon atoms in a solar cell, they knock electrons loose. A built-in electric field at the p-n junction forces these free electrons to flow in one direction, creating direct current (DC). An inverter converts DC to alternating current (AC) for use in buildings or export to the grid. See our deep dive on how solar panels work for the full physics.
Wind turbines use aerodynamic lift. Wind flows over the turbine blades, creating a pressure difference that causes the rotor to spin. This rotation drives a generator inside the nacelle — the housing at the top of the tower — which produces electricity. A gearbox typically increases rotation speed from about 50 rpm to roughly 1,500 rpm for efficient generation.
The fundamental difference is simple. Solar panels have no moving parts. Wind turbines have many. That distinction drives almost every practical difference between the two technologies: maintenance needs, noise, lifespan, and site requirements.
Installation Cost Comparison
Residential Systems
For homeowners, the cost gap between wind and solar is substantial. (For a detailed breakdown of solar pricing by component, see our solar installation cost breakdown.)
| Cost Factor | Solar Panels (10 kW) | Wind Turbine (10 kW) |
|---|---|---|
| Equipment | $15,000–$22,000 | $20,000–$40,000 |
| Installation labor | $3,000–$6,000 | $8,000–$15,000 |
| Tower/foundation | — | $5,000–$10,000 |
| Permits and interconnection | $500–$1,500 | $1,000–$3,000 |
| Total before incentives | $18,500–$29,500 | $34,000–$68,000 |
| After 30% federal ITC | $13,000–$20,650 | $23,800–$47,600 |
Source: NREL U.S. Solar Photovoltaic System Cost Benchmarks 2025; AWEA Small Wind Turbine Cost Database; installer survey data.
A 10 kW residential solar system after incentives typically costs $20,000–$25,000. A comparable wind turbine system costs roughly 2–2.5x as much. The tower alone — which must rise 80–120 feet to access clean wind — adds significant cost that solar does not have.
Smaller wind turbines exist. A 1–2 kW rooftop or pole-mounted turbine might cost $3,000–$8,000. But these systems rarely generate enough electricity to meaningfully offset a home’s consumption. They work best as supplemental power for off-grid cabins or remote equipment, not as primary residential energy sources.
Utility-Scale Projects
At utility scale, the economics flip. Wind becomes highly competitive — sometimes cheaper than solar.
The levelized cost of energy (LCOE) — the total cost per megawatt-hour over a project’s lifetime — tells the real story:
| Technology | LCOE Range (USD/MWh) | Source |
|---|---|---|
| Utility-scale solar (fixed tilt) | $28–$38 | Lazard LCOE v17.0, 2025 |
| Onshore wind | $24–$75 | IRENA Renewable Power Generation Costs, 2024 |
| Offshore wind | $67–$146 | IRENA, 2024 |
| Natural gas combined cycle | $45–$74 | Lazard, 2025 |
| Coal | $68–$166 | Lazard, 2025 |
Onshore wind in locations with strong, consistent wind resources can undercut even the cheapest solar. A modern onshore turbine generates 2.5–3 MW of power with a capacity factor of 35–50% in prime wind regions. That is why the Great Plains of the United States, coastal Northern Europe, and parts of China have seen massive wind farm development. Also see: European Solar Incentives.
Solar’s advantage is ubiquity. A solar farm works in almost any sunny location. A wind farm only works where the wind blows reliably. For more on why solar works in places you might not expect, read our solar energy myths debunked guide.
Pro Tip — Check Your Local Wind Resource Before Considering Turbines
Average annual wind speed matters more than peak gusts. Residential wind turbines need sustained average speeds of at least 10–12 mph (4.5–5.4 m/s) at hub height to be economically viable. The U.S. Department of Energy’s Wind Resource Maps and the Global Wind Atlas provide free site-specific data. If your location shows average speeds below 9 mph, solar is almost certainly the better investment.
For Global-specific compliance details, see Global net-metering-by-country. For Global-specific compliance details, see Global solar-permitting-speed-by-country.
Energy Output and Efficiency
Conversion Efficiency
Wind turbines convert a higher percentage of available energy into electricity than solar panels:
- Wind turbine efficiency: 35–45% under optimal conditions, with some modern designs reaching 50% at peak wind speeds
- Solar panel efficiency: 20–25% for mainstream monocrystalline silicon panels in 2026
See also: solar panel efficiency ranking.
But raw efficiency does not tell the complete story. A wind turbine at 45% efficiency in a location with weak wind still produces less energy than a solar panel at 22% efficiency in a sunny climate.
Capacity Factor
Capacity factor measures actual energy output versus theoretical maximum output. It is the metric that matters for real-world production:
| Technology | Typical Capacity Factor | Notes |
|---|---|---|
| Residential solar | 15–22% | Varies by latitude, shading, and orientation |
| Utility-scale solar (single-axis tracking) | 25–32% | Higher in desert Southwest |
| Onshore wind (good resource) | 35–50% | Best sites in Great Plains, coastal areas |
| Onshore wind (average resource) | 25–35% | Most commercially viable sites |
| Offshore wind | 40–55% | Higher and more consistent wind speeds |
Source: NREL Annual Technology Baseline 2025; IEA Renewables 2025.
Annual Energy Production: Worked Examples
Here is what a 10 kW system actually produces in a typical year:
10 kW residential solar system (Phoenix, AZ):
- Specific yield: ~1,850 kWh/kW/year
- Performance ratio: 0.80
- Annual output: 10 × 1,850 × 0.80 = 14,800 kWh/year
10 kW residential solar system (New York, NY):
- Specific yield: ~1,350 kWh/kW/year
- Performance ratio: 0.78
- Annual output: 10 × 1,350 × 0.78 = 10,530 kWh/year
10 kW residential wind turbine (good wind site, 12 mph average):
- Capacity factor: ~35%
- Annual output: 10 kW × 8,760 hours × 0.35 = 30,660 kWh/year
10 kW residential wind turbine (moderate wind site, 10 mph average):
- Capacity factor: ~20%
- Annual output: 10 × 8,760 × 0.20 = 17,520 kWh/year
10 kW residential wind turbine (marginal wind site, 8 mph average):
- Capacity factor: ~10%
- Annual output: 10 × 8,760 × 0.10 = 8,760 kWh/year
The wind turbine in a good location outperforms solar dramatically. But in a marginal wind location — which describes most suburban and urban areas — the same turbine underperforms even a moderate solar installation.
That is why site assessment matters so much for wind. Solar is forgiving. Wind is not.
Maintenance and Operating Costs
This is where the two technologies diverge most sharply.
Solar Panel Maintenance
Solar panels have no moving parts. Their maintenance needs are minimal:
- Cleaning: $150–$300/year in dusty climates; often zero in areas with regular rainfall
- Inverter replacement: Every 10–15 years, $1,000–$3,000
- Annual inspection: Visual check for damage, debris, or shading changes — often free if done by the homeowner
- Total 25-year maintenance: Approximately $3,000–$8,000
Panel degradation is slow and predictable. Modern panels lose about 0.3–0.5% of output per year. A panel rated at 400W at installation still produces roughly 360–375W after 25 years.
Wind Turbine Maintenance
Wind turbines are mechanical systems exposed to the elements. Their maintenance needs are significant:
- Annual servicing: $1,000–$3,000 for inspection, lubrication, and minor repairs
- Gearbox overhaul: Every 7–10 years, $5,000–$15,000
- Blade repair or replacement: $2,000–$10,000 per incident
- Electrical system checks: $500–$1,000/year
- Total 20-year maintenance: $25,000–$60,000
Wind turbines also face storm damage risk. Most residential turbines include automatic shutdown systems that feather blades or apply brakes when wind speeds exceed safe limits (typically 55–65 mph). But extreme weather — ice storms, lightning, and high winds — can still cause damage that solar panels rarely experience.
| Maintenance Factor | Solar Panels (25 years) | Wind Turbine (20 years) |
|---|---|---|
| Annual maintenance cost | $150–$300 | $1,000–$3,000 |
| Major component replacement | Inverter: $1,000–$3,000 (1x) | Gearbox: $5,000–$15,000 (1–2x) |
| Storm damage risk | Low (hail-rated to 1 inch at 52 mph) | Moderate (lightning, ice, high wind) |
| Expected lifespan | 25–30 years | 20–25 years |
| End-of-life decommissioning | Simple removal and recycling | Complex tower disassembly |
ROI and Payback Analysis
Residential Payback: Worked Example
Let us run the numbers for a homeowner with a $200/month electricity bill in a market with $0.18/kWh rates.
Solar scenario (10 kW system):
- Gross cost: $25,000
- Federal ITC (30%): –$7,500
- Net cost: $17,500
- Annual production: 13,000 kWh
- Annual savings: $2,340
- Simple payback: 7.5 years
- 25-year savings (post-payback): $2,340 × 17.5 = $40,950
Wind scenario (10 kW system, good wind site):
- Gross cost: $55,000
- Federal ITC (30%): –$16,500
- Net cost: $38,500
- Annual production: 25,000 kWh
- Annual savings: $4,500
- Simple payback: 8.6 years
- 20-year savings (post-payback): $4,500 × 11.4 = $51,300
The wind system generates more savings long-term, but only in a location with excellent wind resources. In a moderate wind site where the same turbine produces 15,000 kWh/year:
- Annual savings: $2,700
- Simple payback: 14.3 years
- 20-year savings (post-payback): $2,700 × 5.7 = $15,390
At that point, solar is the clear winner.
Key Takeaway — Solar Wins for Predictable ROI
Solar panels deliver consistent, predictable returns across a wide range of locations. Wind turbines can outperform solar in ideal conditions, but their economics collapse in moderate or poor wind sites. Unless you have verified average wind speeds above 10 mph at hub height, solar is the safer financial bet.
Location Suitability: When Wind Wins, When Solar Wins
Choose Solar If:
- Your roof gets unobstructed sun for most of the day
- You live in a suburban or urban area with limited open space
- Your average electricity bill is $100–$300/month
- You want a low-maintenance, “set it and forget it” system
- Your local utility offers net metering or favorable export rates
- You need a system permitted and installed within weeks, not months
Choose Wind If:
- You own at least one acre of open land with minimal obstructions
- Your property has documented average wind speeds above 10–12 mph
- You live in a rural area where zoning allows tall towers (80–120 feet)
- You are comfortable with ongoing maintenance or can contract it
- You want 24/7 generation capability (wind blows day and night)
- You are building an off-grid system where reliability matters more than cost
Consider a Hybrid System If:
- You have both good sun and good wind resources
- You are off-grid and need maximum energy independence
- You want to smooth out seasonal variations (solar peaks in summer; wind often peaks in winter)
- You have the budget for both technologies plus battery storage
Hybrid wind-solar systems are increasingly common for remote cabins, farms, and rural estates. The two technologies complement each other well: solar covers sunny afternoons, while wind can generate at night and during cloudy weather. A shared battery bank stores excess from both sources.
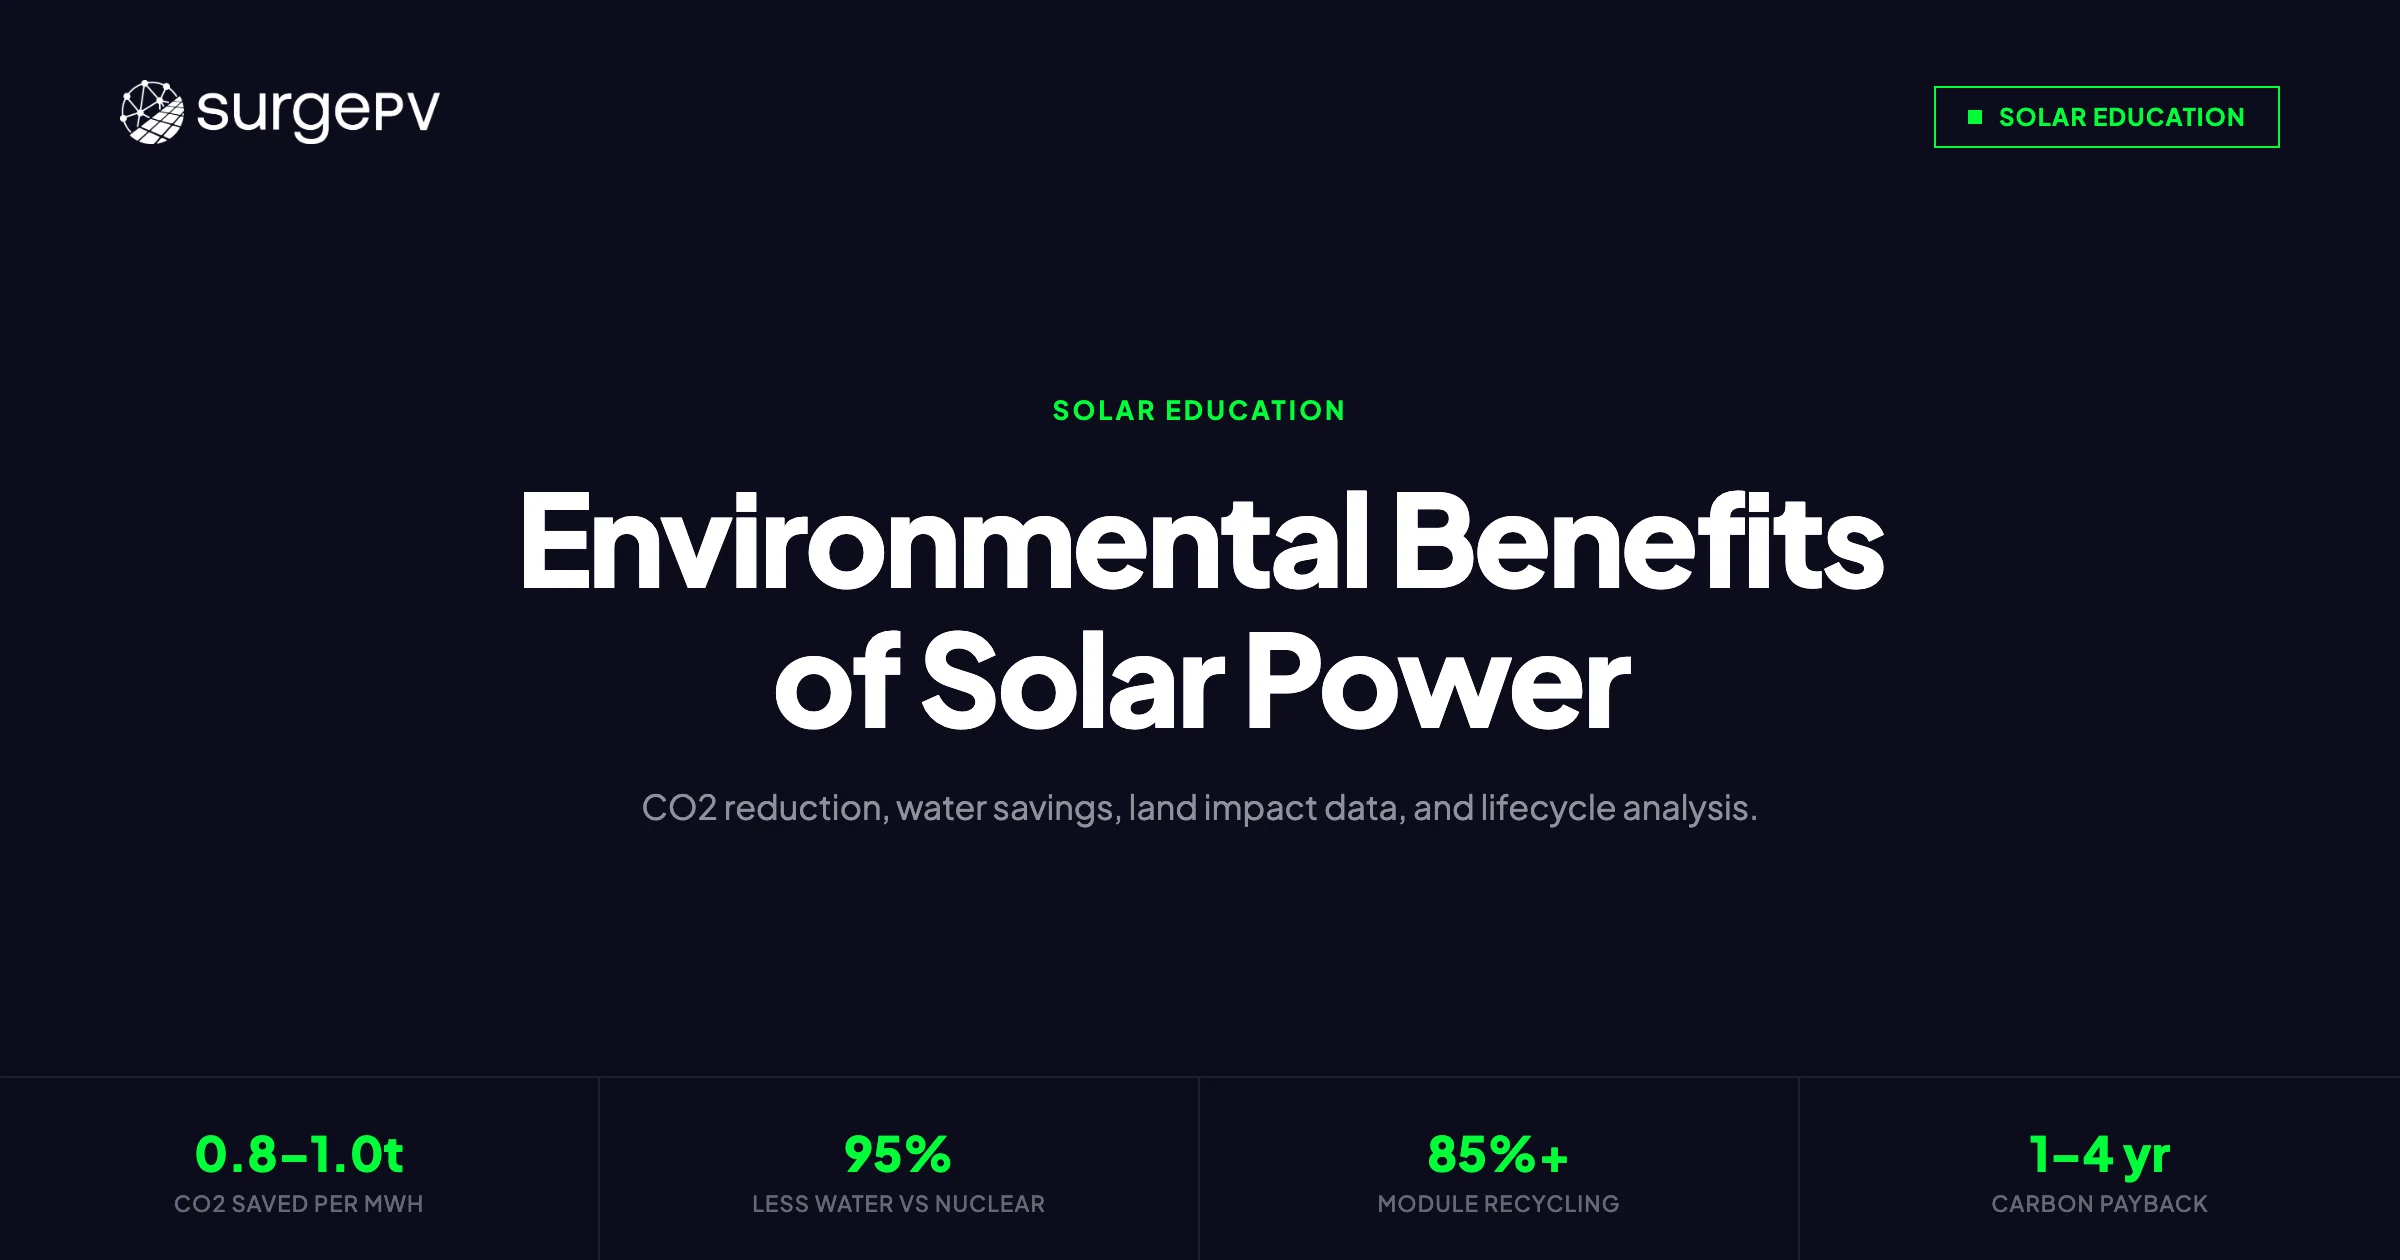
Environmental Impact
Both wind and solar produce zero direct emissions during operation. Their environmental differences lie in manufacturing and land use.
Carbon Footprint
| Technology | Life-Cycle CO₂ (g/kWh) | Source |
|---|---|---|
| Onshore wind | ~7–15 | IPCC AR6, 2022 |
| Solar PV | ~20–50 | IPCC AR6, 2022 |
| Natural gas | ~490 | IPCC AR6, 2022 |
| Coal | ~820 | IPCC AR6, 2022 |
Wind has a slightly lower life-cycle carbon footprint than solar, primarily because turbine manufacturing uses less energy-intensive materials than silicon purification and cell fabrication.
Land and Wildlife Impact
Solar farms require significant land area — roughly 3.5–10 acres per MW depending on configuration. However, panels can be mounted on rooftops, carports, and brownfields, avoiding new land disturbance. Solar farms have minimal wildlife impact beyond initial construction.
Wind farms use less land per MW (turbine foundations are small; the rest of the land can often remain in agricultural use). But turbines pose collision risks for birds and bats. Modern turbine designs — including slower blade tip speeds and ultrasonic deterrents — have reduced wildlife mortality, but the impact remains a consideration for siting.
Noise: Solar panels are silent. Wind turbines produce a low-frequency whoosh at roughly 30–45 dB at a distance of 300 feet — comparable to a quiet refrigerator. This is why most residential turbines are restricted to rural areas with adequate setbacks from neighbors.
2026 Technology Trends
Solar Trends
Module prices keep falling. Utility-scale crystalline silicon modules reached approximately $0.16/Wp in late 2025 (BloombergNEF). Residential all-in costs average $2.50–$3.20/W before incentives.
TOPCon is now the default. Nearly all tier-1 manufacturers have shifted new production to Tunnel Oxide Passivated Contact cells, delivering 22–24.5% module efficiency with better low-light and high-temperature performance than previous PERC technology.
Bifacial modules are standard. Most commercial and utility-scale projects now use bifacial panels that capture reflected light from the ground or roof surface, adding 5–15% energy yield. For more on this topic, see Bifacial Solar Panel Design Guide.
Wind Trends
Turbines are getting larger. Modern onshore turbines now commonly feature 150–170 meter rotor diameters and hub heights above 150 meters, accessing stronger, steadier winds at higher altitudes.
Offshore wind is scaling rapidly. Turbines rated at 15+ MW are now being deployed offshore, with single machines capable of powering 15,000–20,000 homes. Floating offshore platforms are opening deeper water sites.
Small residential turbines face headwinds. The residential wind market has shrunk relative to solar as panel costs have fallen. New compact designs — like the LIAM F1 UWT, a 1.5-meter silent turbine — are attempting to revive urban wind, but solar remains dominant for home applications.
Design and Compare Solar Systems in Minutes
SurgePV’s solar design software lets you model energy production, calculate ROI, and generate professional proposals — all from a single platform. See why installers in 30+ countries use it to close more deals.
Book a DemoNo commitment required · 20 minutes · Live project walkthrough
Summary: Wind vs Solar at a Glance
| Factor | Solar Panels | Wind Turbines |
|---|---|---|
| Upfront cost (10 kW residential) | $20,000–$30,000 | $50,000–$75,000 |
| LCOE (utility-scale) | $28–$38/MWh | $24–$75/MWh |
| Conversion efficiency | 20–25% | 35–45% |
| Capacity factor (typical) | 15–25% | 25–50% |
| Payback period | 6–10 years | 12–20 years (residential) |
| Annual maintenance | $150–$300 | $1,000–$3,000 |
| Lifespan | 25–30 years | 20–25 years |
| Works at night | No | Yes |
| Noise level | Silent | 30–45 dB at 300 ft |
| Best for | Most homes, urban/suburban | Rural, windy, off-grid |
| Ease of permitting | Simple, standardized | Complex, zoning-dependent |
Bottom Line
For the vast majority of homeowners and commercial building owners in 2026, solar panels are the right choice. They cost less upfront, pay back faster, require almost no maintenance, and work reliably across a wide range of locations.
Wind turbines make sense in specific scenarios: large rural properties with verified strong wind resources, off-grid sites where energy independence is the top priority, and utility-scale projects in prime wind regions where LCOE can undercut solar.
If you are unsure which technology fits your property, start with a solar assessment. Solar works in almost every location that receives daylight. Wind only works where the data proves it will.
Your next steps:
- Check your property’s solar potential using satellite irradiance data or a professional site survey
- If considering wind, verify average wind speeds at hub height using the Global Wind Atlas or a local anemometer
- Model both options with accurate financial projections before making a decision
- For off-grid or rural properties, explore hybrid wind-solar systems with battery storage For more on this topic, see Adding Battery Storage Services.
Frequently Asked Questions
Is a wind turbine or solar panels cheaper to install?
For residential applications, solar panels are significantly cheaper. A typical 10 kW residential solar system costs $20,000–$30,000 after federal tax credits. A comparable residential wind turbine system costs $50,000–$75,000 including tower, foundation, and installation. On a utility scale, both technologies are cost-competitive, with onshore wind LCOE at $24–75/MWh and utility-scale solar at $28–38/MWh.
Which produces more electricity: wind or solar?
It depends on location and system size. Wind turbines have higher conversion efficiency (35–45% vs. 20–25% for solar) and higher capacity factors (25–50% vs. 15–25%). A 10 kW wind turbine in an optimal location can produce 15,000–25,000 kWh/year, while a 10 kW solar system typically produces 12,000–15,000 kWh/year. However, solar output is far more predictable and consistent across most populated areas, while wind performance varies dramatically by site.
What is the payback period for wind turbines vs solar panels?
Residential solar typically pays back in 6–10 years depending on local electricity rates and incentives. Residential wind turbines average 12–20 years for payback, and that is only in locations with strong, consistent wind. After payback, solar systems provide 15–20 years of essentially free electricity, while wind systems provide 5–13 years due to shorter 20–25 year lifespans and higher maintenance costs.
Can you combine wind and solar in one system?
Yes. Hybrid wind-solar systems pair both technologies with shared inverters and battery storage. Because wind often blows at night and during cloudy weather when solar is not producing, the two sources complement each other well. Hybrid systems are most common in off-grid applications and rural properties where grid connection is expensive or unavailable.
Do wind turbines or solar panels require more maintenance?
Wind turbines require significantly more maintenance than solar panels. Solar systems need only occasional cleaning ($150–$300/year) and an inverter replacement every 10–15 years. Wind turbines have moving parts — bearings, gearboxes, blades, and pitch controls — that require regular servicing, typically costing $1,000–$3,000 annually. Blade inspection, gearbox oil changes, and storm shutdown system checks are all part of routine wind turbine maintenance.
How much wind does a residential turbine need?
Residential wind turbines need average wind speeds of at least 10–12 mph (4.5–5.4 m/s) at hub height — typically 80–120 feet above ground — to be economically viable. Wind speeds increase with height, so a turbine on a short tower may not access the wind resource needed even if ground-level breezes feel strong. Use the U.S. DOE Wind Resource Maps or the Global Wind Atlas to check your specific location before investing.
Do solar panels work better than wind turbines in cities?
Yes. Solar panels are far better suited to urban and suburban environments. They mount on rooftops, make no noise, require no additional land, and face fewer zoning restrictions. Wind turbines need open space, tall towers, and setbacks from buildings — requirements that most city lots cannot meet. Some new compact vertical-axis turbines are designed for urban rooftops, but their output is typically too low to offset a home’s full electricity consumption. Solar design software automates calculations and documentation. Solar proposal software generates professional quotes in minutes.