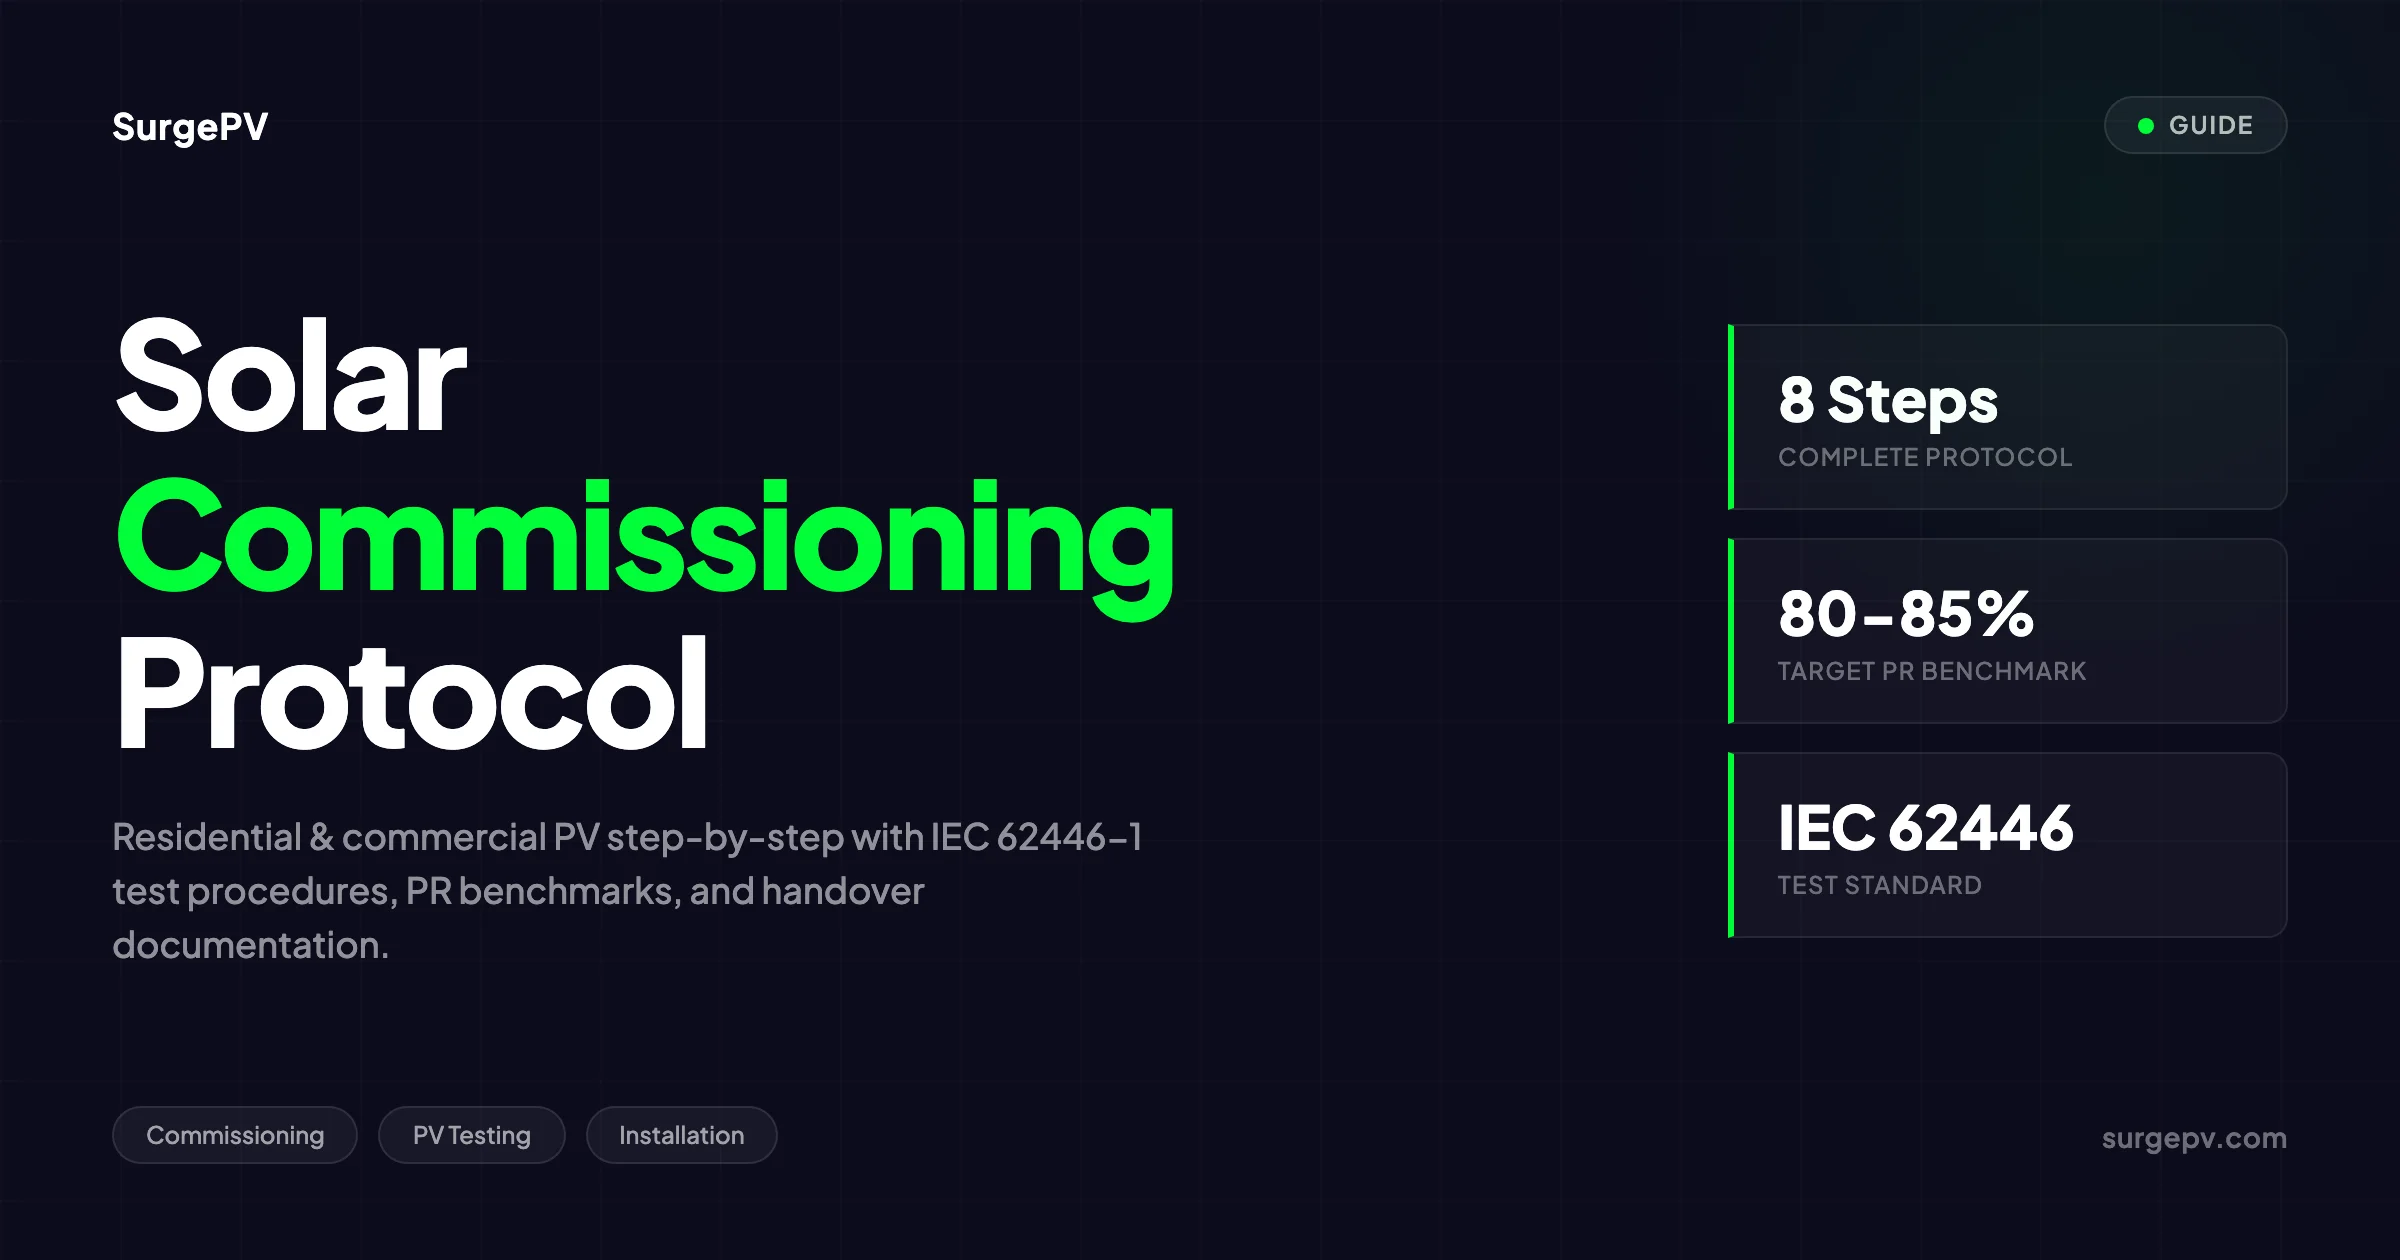
Quick Answer
Solar commissioning protocol includes: visual inspection, insulation resistance testing (≥1 MΩ), polarity verification, open-circuit voltage check, short-circuit current measurement, inverter startup sequence, grid connection test, and performance ratio verification (target: ≥80%). Full protocol prevents 90% of post-installation issues.
A 6 kWp residential system in Bristol failed its first utility inspection. The installer had skipped the insulation resistance test. Water had seeped into a junction box during a rainstorm three days before energization. The megger would have caught it in 30 seconds. Instead, the project sat idle for 11 days while the EPC replaced a string harness, rescheduled the Distribution Network Operator (DNO), and absorbed the cost of a second inspection visit. Accurate shadow analysis during design would have also flagged the suboptimal junction box placement that exposed it to runoff.
Solar commissioning protocol includes: visual inspection, insulation resistance testing (≥1 MΩ), polarity verification, open-circuit voltage check, short-circuit current measurement, inverter startup sequence, grid connection test, and performance ratio verification (target: ≥80%). Full protocol prevents 90% of post-installation issues.
Solar commissioning protocol includes: visual inspection, insulation resistance testing (≥1 MΩ), polarity verification, open-circuit voltage check, short-circuit current measurement, inverter startup sequence, grid connection test, and performance ratio verification (target: ≥80%). Full protocol prevents 90% of post-installation issues.
That single missed test cost more than the entire commissioning budget.
This guide is the complete solar system commissioning protocol for residential and commercial PV installations in 2026. It covers every test, every threshold, every document, and every decision point from pre-commissioning preparation through customer handover. Whether you are commissioning a 4 kWp rooftop in Surrey or a 400 kWp factory array in Birmingham, the sequence and standards are the same. Only the scale and documentation depth change. For installers looking to streamline the design phase before commissioning begins, solar design software can catch string mismatch and shading errors early.
Quick Answer
Solar commissioning is a structured 8-step protocol: pre-commissioning prep, visual inspection, DC testing (Voc, Isc, polarity, insulation), ground continuity, inverter startup and grid connection, performance validation (PR, I-V curves, IR imaging), monitoring setup, and documentation handover. Residential systems take 2–4 hours. Commercial systems take 1–3 days. IEC 62446-1 is the governing standard.
In this guide:
- Pre-commissioning prerequisites: permits, utility approvals, and documentation
- Visual inspection walkthrough: structural, electrical, and labeling checks
- DC testing: string polarity, Voc, Isc, and insulation resistance
- Ground continuity and equipotential bonding verification
- Inverter startup sequence and grid connection testing
- Anti-islanding protection verification
- Performance Ratio (PR) calculation and benchmarks
- I-V curve tracing and interpretation
- IR thermal imaging for hot spot detection
- Monitoring, metering, and SCADA setup
- Final documentation: as-builts, commissioning report, warranties, O&M manual
- Customer training and handover best practices
- Residential vs commercial commissioning: timeline, cost, and scope comparison
- Common commissioning failures and how to fix them
- Real case studies with kWp, location, and timeline data
What Solar Commissioning Actually Means
Commissioning is not a single event. It is a phased verification process that starts before the first module is lifted and ends when the customer signs the handover certificate.
The goal is simple: prove the system is safe, correctly installed, and capable of producing the energy it was designed to produce. Every test, every measurement, and every document serves that goal. Using the SurgePV platform during design helps ensure the as-built system matches the engineered plan, reducing commissioning surprises. Solar software with automated string sizing and voltage drop calculations eliminates a major source of commissioning-day rework. For a direct comparison, see Arka 360 vs SurgePV.
IEC 62446-1:2016 — “Photovoltaic (PV) systems - Requirements for testing, documentation and maintenance - Part 1: Grid connected systems” — is the international reference standard. It defines two categories of testing:
| Test Category | Applies To | Tests Included |
|---|---|---|
| Category 1 | All grid-connected systems | Earthing continuity, polarity, junction box inspection, Voc, Isc, functional test, insulation resistance |
| Category 2 | Larger or complex systems | All Category 1 tests plus I-V curve measurement and IR thermographic inspection |
Amendment 1 (2018) added Harness Sub Array (HSA) testing as an alternative to individual string tests for aggregated configurations. HSA testing is limited to combined Isc of 30A or fewer and 10 strings maximum.
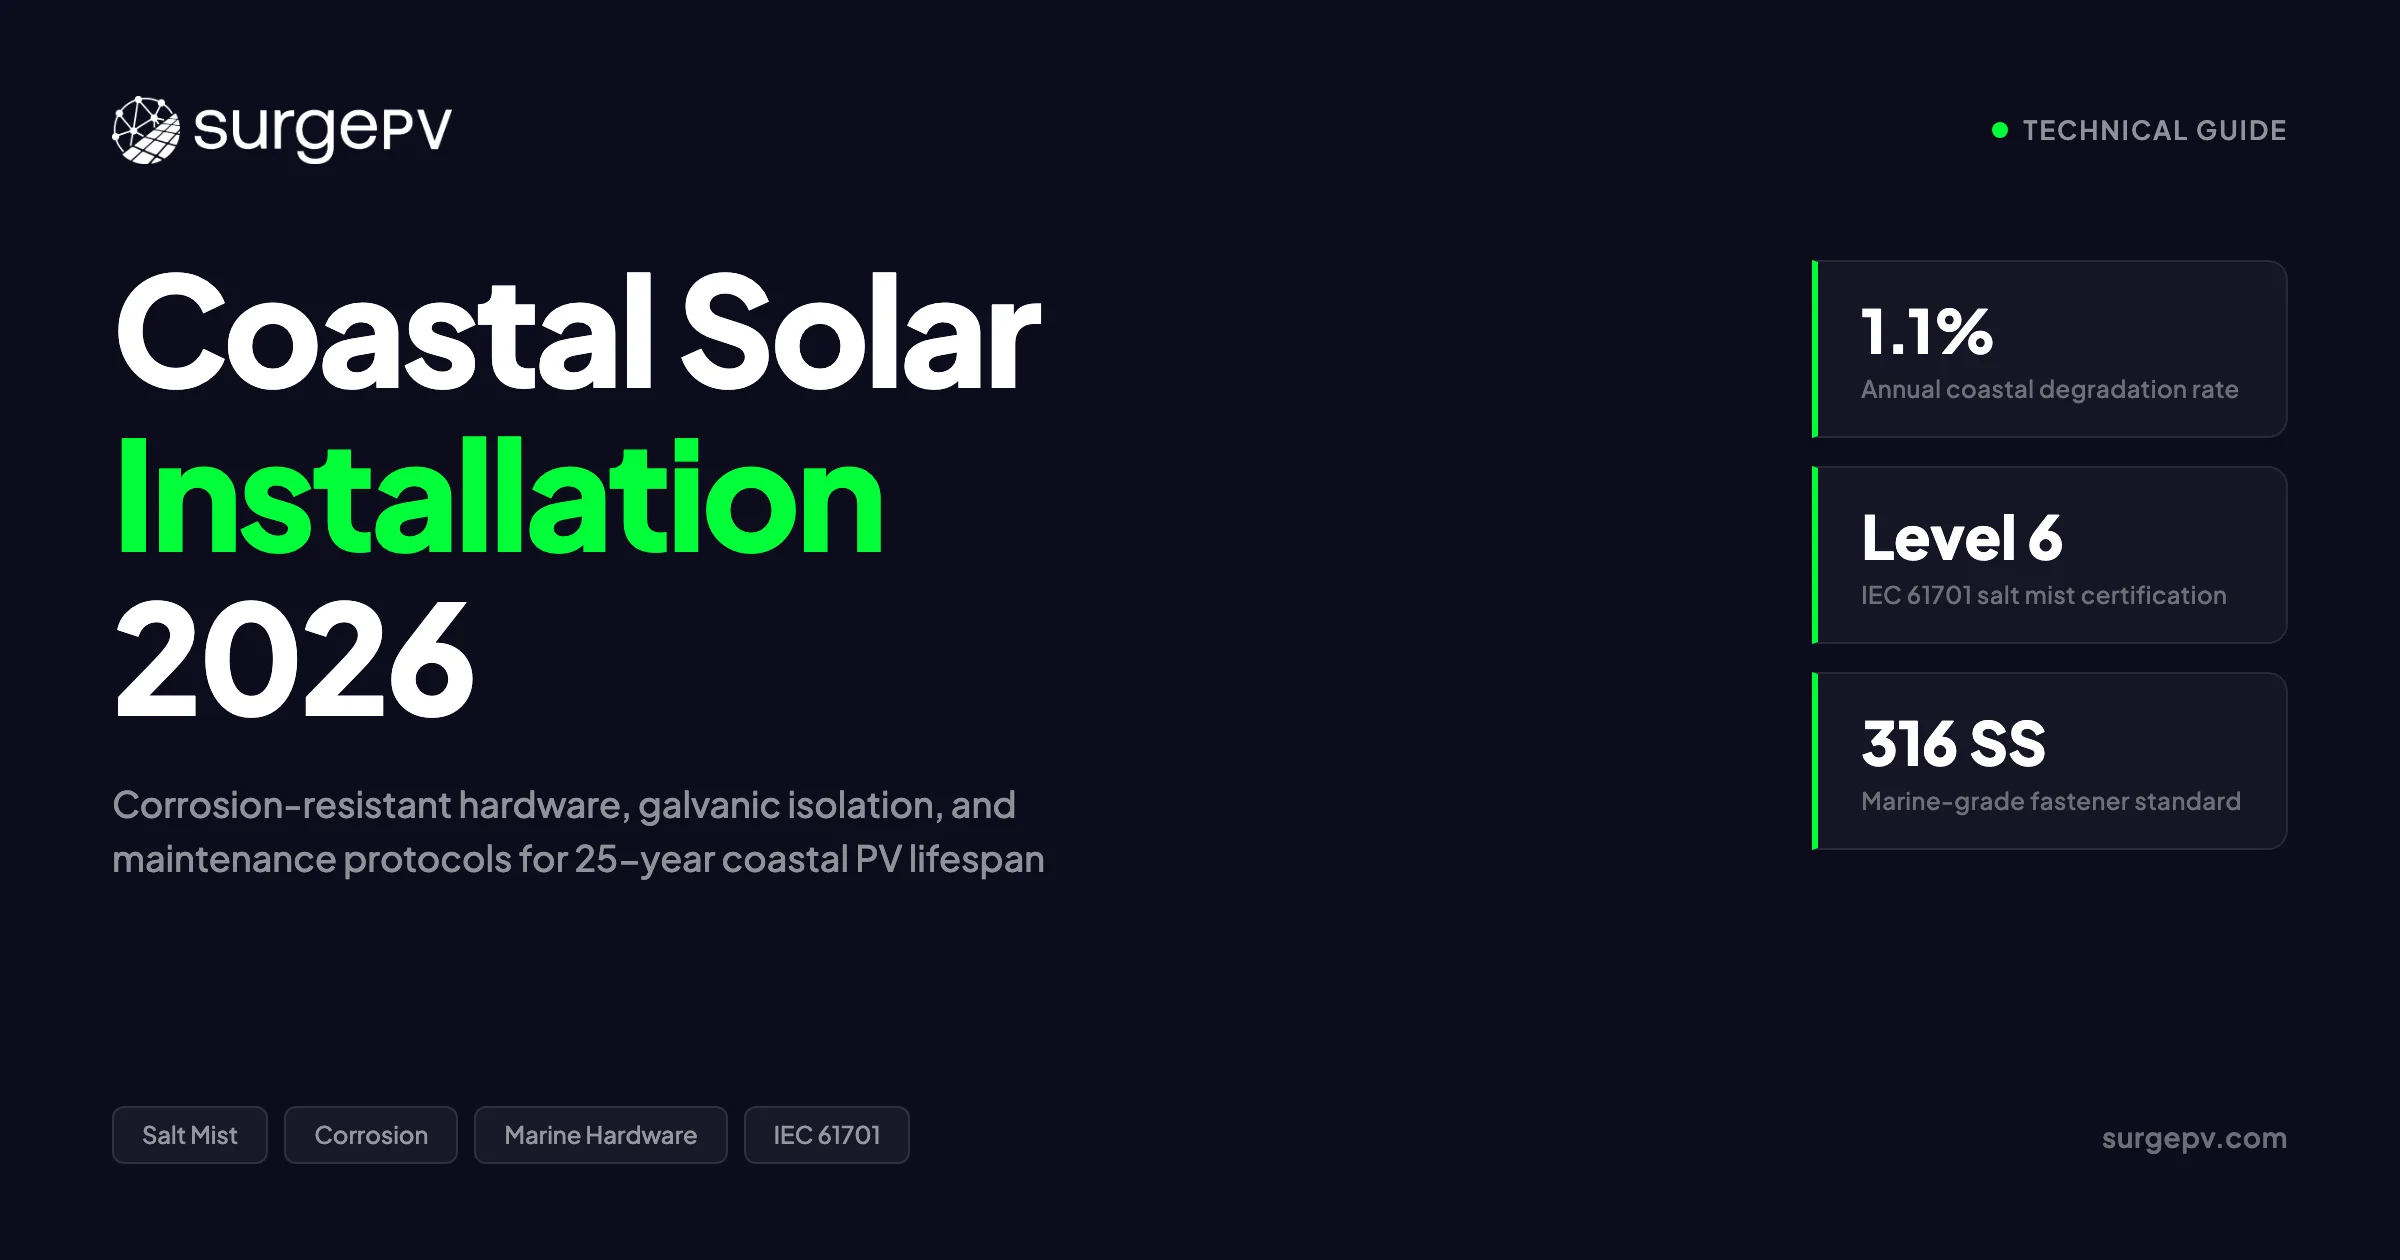
In the United States, NEC Article 690 governs PV system installation and safety. IEEE 1547-2018 covers interconnection and interoperability. In the UK and EU, BS 7671 and local grid codes (G99/G100 in the UK) apply. A commissioning protocol that satisfies IEC 62446-1 will typically satisfy most national codes, but always verify local requirements before starting. For the latest details on UK, see Battery Solar System Design UK. For UK-specific information, see Heritage Building Solar Case Study. For United Kingdom-specific compliance details, see United Kingdom comparisons/mcs-vs-non-mcs.
Pre-Commissioning: The Phase Most Installers Rush
Rushing pre-commissioning is the most expensive mistake in solar project delivery. Every hour saved here costs a day later.
Documentation Checklist
Before testing begins, confirm these documents are complete and physically present on site:
| Document | Residential | Commercial |
|---|---|---|
| Final as-built single-line diagram | Required | Required |
| Array layout drawing with string numbering | Required | Required |
| Equipment datasheets (modules, inverter, mounting) | Required | Required |
| String map showing module-to-combiner routing | Recommended | Required |
| Cable schedule with conductor sizes and routes | Not required | Required |
| Permit sign-off from AHJ (Authority Having Jurisdiction) | Required | Required |
| Utility interconnection agreement | Required | Required |
| Manufacturer installation manuals | Required | Required |
| Warranty registration confirmations | Recommended | Required |
| Test equipment calibration certificates | Recommended | Required |
Punch List Creation
Walk the array before testing. Document every incomplete item with a photo, location reference, and priority flag:
- Critical: Safety issue — blocks energization (exposed conductors, missing grounding, damaged modules)
- Major: Functional issue — blocks performance testing (incorrect labeling, loose terminations, missing seals)
- Minor: Cosmetic or documentation issue — can be corrected during testing (tying cable, replacing a label)
Nothing on the critical list can remain open when DC conductors are energized.
Safety Protocol
Lockout/tagout (LOTO) procedures are mandatory. Every technician on site must confirm:
- DC and AC disconnects are locked in the OFF position
- Fuses are removed from combiner boxes until verification is complete
- Personal protective equipment (PPE) meets NFPA 70E arc flash requirements
- A qualified electrical supervisor is present for all energization steps
- Emergency contact numbers for utility and fire services are posted
Pro Tip
Schedule the pre-commissioning walk for early morning. Module temperatures are lowest then, which gives the most accurate Voc readings. It also means you avoid the afternoon heat that makes working on rooftops dangerous and uncomfortable.
Visual Inspection: What Your Eyes Can Catch
A thorough visual inspection catches 60–70% of installation defects before a single meter is connected. Do not skip this step. Installers using solar software with 3D layout validation often find that design-stage shading analysis reduces the number of physical defects discovered during this walkthrough. For a deeper look at how site assessment impacts system performance, see our guide to shadow analysis.
Structural Checks
| Component | What to Verify | Acceptance Criteria |
|---|---|---|
| Mounting rails | Torque marks present, rails level, no deformation | Within 2 mm/m alignment |
| Module clamps | Correct clamp type, mid-clamp vs end-clamp placement per manufacturer | No overhang, no contact with module glass |
| Roof penetrations | Flashing sealed, sealant intact, no gaps | No visible water ingress paths |
| Ballast blocks (flat roof) | Correct weight per wind load calculation, no cracking | Within 5% of design weight |
| Ground-mount foundations | No settlement, posts plumb, corrosion protection intact | Vertical within 1:100 |
Electrical Checks
| Component | What to Verify | Acceptance Criteria |
|---|---|---|
| DC cabling | Sunlight-resistant insulation, correct rating, neat routing | No contact with sharp edges, strain reliefs installed |
| MC4 connectors | Fully mated, audible click, no dirt or moisture | IP67 rating maintained |
| Junction/combiner boxes | Properly sealed, correct conductor sizing, fuses installed | IP65 minimum, 156% of Isc fuse rating |
| Grounding conductors | Green or bare copper, continuous path, single point of grounding | Resistance less than 1 ohm to earth |
| AC cabling | Correct breaker sizing, proper phasing, torque values marked | Within manufacturer spec |
Labeling Checks
Every disconnect, breaker, and junction box must carry a durable label. Missing or incorrect labels are the most common cause of inspection failure. Verify:
- DC disconnect: “Photovoltaic System DC Disconnect”
- AC disconnect: “Solar AC Disconnect”
- Main panel: Circuit directory updated with solar breaker
- Rapid shutdown label: “Rapid Shutdown Switch for Solar PV System” (NEC 690.12)
- Warning labels: Arc flash, shock hazard, grounding point
DC Testing: The Core of Electrical Verification
DC testing is where most commissioning failures are found. These tests must be performed in sequence. Do not energize the inverter until all DC tests pass.
Test Sequence
| Order | Test | Standard Reference | Typical Acceptance |
|---|---|---|---|
| 1 | Ground continuity | IEC 62446-1 Clause 6.1 | Low resistance path documented |
| 2 | Polarity | IEC 62446-1 Clause 6.2 | No reversals; voltage sign correct |
| 3 | Voc (open-circuit voltage) | IEC 62446-1 Clause 6.4 | Within ±5% of expected |
| 4 | Isc (short-circuit current) | IEC 62446-1 Clause 6.5 | Within ±10% of expected |
| 5 | Insulation resistance | IEC 62446-1 Clause 6.7 | Greater than or equal to 1 MΩ (>120V systems) |
Open-Circuit Voltage (Voc) Testing
Voc is the maximum voltage a PV string produces with no load connected. It is the first and most important electrical test.
How to measure: Use a digital multimeter across the positive and negative terminals of each string at the combiner box or inverter input. Record the value, ambient temperature, and approximate irradiance.
Expected values: The measured Voc should fall within 80–105% of the manufacturer’s specified Voc at Standard Test Conditions (STC), corrected for actual module temperature. Voc increases as temperature drops. A string measured at 15°C will read roughly 5% higher than the STC value (which is defined at 25°C).
What a bad reading means:
| Reading | Likely Cause | Action |
|---|---|---|
| Zero or near-zero | Open circuit, blown fuse, or disconnected string | Trace the string, check MC4 connectors |
| 50% of expected | One panel in string reversed or bypass diode shorted | Check polarity at each junction |
| 150% of expected | Two strings wired in series instead of parallel | Check combiner box wiring |
| String-to-string variance >5% | Shading, soiling, or module mismatch | Inspect array, clean if needed |
Short-Circuit Current (Isc) Testing
Isc is the maximum current a PV string can produce when its terminals are shorted. It is measured with a clamp meter around the positive conductor — never by shorting the terminals directly with a multimeter.
How to measure: Place a DC clamp meter around the positive conductor of each string. Record the value, time of day, and approximate irradiance. Best measured between 10:00 and 14:00 on a clear day.
Expected values: Isc varies strongly with irradiance. At 800 W/m², expect roughly 80% of the STC Isc rating. At 1000 W/m², expect 95–100%. Correct for irradiance if your meter has a reference cell.
Safety note: A brief short-circuit is generally safe for PV modules, but arcing at connectors can damage them. Always use a clamp meter. Never create a hard short with test leads.
Insulation Resistance Testing (Megger Test)
The insulation resistance test verifies that DC conductors are properly isolated from ground. It detects nicks, moisture ingress, and manufacturing defects that could cause ground faults or fires.
How to measure: Use an insulation resistance tester (megohmmeter). Test each polarity separately:
- Disconnect the string from the inverter and combiner box
- Connect the positive lead to the positive conductor
- Connect the negative/ground lead to a verified earth point
- Apply 500V DC for systems under 120V, or 1000V DC for systems over 120V
- Record the resistance value after 60 seconds
Acceptance criteria:
| System Voltage | Minimum Insulation Resistance |
|---|---|
| Less than 120V | Greater than or equal to 0.5 MΩ |
| Greater than 120V | Greater than or equal to 1 MΩ |
Values below 1 MΩ on a new system almost always indicate a wiring fault. Common causes include pinched cables under mounting clamps, moisture in junction boxes, or damaged module backsheets.
Pro Tip
Perform the insulation resistance test on dry modules only. Morning dew or recent rain can drop readings temporarily below threshold. If a string fails, retest after 2–3 hours of direct sun. If it still fails, the fault is real — trace and repair before proceeding.
Ground Continuity and Equipotential Bonding
Grounding is not optional. It is the safety system that protects people and property when insulation fails.
What to Test
| Test Point | Method | Acceptance |
|---|---|---|
| Array frame to earth | Continuity tester or low-resistance ohmmeter | Less than or equal to 1 ohm |
| Inverter chassis to earth | Continuity tester | Less than or equal to 1 ohm |
| Combiner box to earth | Continuity tester | Less than or equal to 1 ohm |
| Mounting structure to earth | Continuity tester | Less than or equal to 1 ohm |
| Equipotential bonding between metal parts | Continuity tester | Less than or equal to 1 ohm |
Common Grounding Errors
- Multiple grounding points on DC side: Creates ground loops and nuisance tripping. The DC side should have one grounding point only.
- Painted surfaces not scraped: A mounting rail painted after galvanizing may read open circuit until the paint is removed at the bonding point.
- Wrong conductor size: Equipment grounding conductors must be sized per NEC 250.122 or BS 7671 Table 54.7, not guessed.
- Missing bonding jumpers: Racking systems with expansion joints need bonding jumpers across each joint.
Inverter Startup and Grid Connection
The inverter startup sequence is the most dangerous moment in commissioning. DC voltage is present. AC voltage is present. The two meet inside the inverter. Follow the manufacturer procedure exactly. For more on this topic, see DC Bus Voltage Optimization.
Startup Sequence
Step 1 — Verify settings before energization:
| Parameter | What to Check | Typical Value |
|---|---|---|
| Grid voltage range | Matches utility service | 230V ±10% (single-phase) or 400V ±10% (three-phase) |
| Grid frequency range | Matches local grid code | 50 Hz ±0.5 Hz (EU/UK) or 60 Hz ±0.7 Hz (US) |
| Anti-islanding settings | Match utility requirements | Trip within 2 seconds per IEC 62116 |
| Ground fault protection | Enabled if required by code | 30 mA RCD for residential, insulated for floating arrays |
| MPPT voltage window | String Voc falls within range | Check at lowest expected temperature |
Step 2 — Energize DC side first:
Close the DC disconnect. The inverter should detect DC voltage and display Voc on its screen. Verify the displayed Voc matches your multimeter reading within 2%. If it does not, check the DC cabling and combiner box fuses.
Step 3 — Energize AC side:
Close the AC disconnect. The inverter will wait for its grid synchronization delay — typically 30–300 seconds depending on grid code settings. During this delay, the inverter monitors grid voltage, frequency, and phase sequence. For more on this topic, see AC Disconnect Sizing for Solar.
Step 4 — Verify production:
Once synchronized, the inverter will begin exporting power. Verify:
- AC voltage at inverter output matches grid voltage within 2%
- Frequency is stable within grid code limits
- Power factor is near unity (0.95–1.00 lagging)
- No error codes or warnings on inverter display
- Production meter registers export correctly
Grid Connection Testing
| Test | Method | Acceptance |
|---|---|---|
| Voltage at point of interconnection | Multimeter, line-to-line and line-to-neutral | Within inverter and utility tolerance |
| Frequency stability | Inverter display or power quality analyzer | 49.5–50.5 Hz (EU/UK) or 59.3–60.5 Hz (US) |
| Phase sequence (three-phase) | Phase sequence indicator | L1-L2-L3 correct rotation |
| Power quality | Power quality analyzer | THD less than 5% voltage, less than 3% current |
Anti-Islanding: The Test That Saves Lives
Anti-islanding is the protection function that disconnects the inverter from the grid when utility power is lost. Without it, a PV system could energize a dead grid segment, electrocuting utility workers and damaging equipment.
How Anti-Islanding Works
Inverters use two detection methods:
| Method | Type | How It Works |
|---|---|---|
| Voltage/frequency threshold | Passive | Monitors grid voltage and frequency; trips if outside normal range |
| ROCOF (Rate of Change of Frequency) | Passive | Measures how fast frequency changes; trips on rapid drift |
| Frequency bias | Active | Slightly perturbs output frequency; detects grid by reaction |
| Impedance measurement | Active | Injects small signal and measures grid impedance response |
Commissioning Verification
Most modern inverters have anti-islanding built-in and certified to IEC 62116 or UL 1741 SA. Commissioning verification focuses on confirming settings, not performing the full test protocol (which requires specialized equipment and is typically done at the factory).
| Verification Step | What to Do |
|---|---|
| Check inverter settings | Anti-islanding enabled, trip times match utility requirements |
| Verify grid code selection | Correct country/region code loaded (e.g., G99 for UK, Rule 21 for California) |
| Document certification | Record inverter anti-islanding certificate number and test standard |
| Confirm fail-safe behavior | If applicable, verify inverter locks out on loss of communications |
For utility-scale projects, the utility may require witnessed anti-islanding testing with a grid simulator. This is typically subcontracted to a specialized testing firm.
Performance Ratio: The Number That Matters
Performance Ratio (PR) is the single metric that tells you whether the system is producing what it should. It strips out weather effects and answers one question: of the sunlight that hit the array, how much became usable AC electricity? Also see: Us Residential Solar Market Trends 2026.
PR Formula
PR = (Actual AC Energy Output / Installed DC Capacity) / (In-Plane Irradiation / 1000 W/m²)Or in simpler terms:
PR = Yf / Yr

Where:
Yf = Final system yield (kWh/kWp) — actual energy per kW installed
Yr = Reference yield (kWh/kWp) — irradiance received, normalized to 1000 W/m²
PR Benchmarks
| PR Value | Assessment | Typical Cause |
|---|---|---|
| Less than 75% | Poor | Major shading, inverter failure, severe soiling, wiring fault |
| 75–80% | Acceptable | Older system, hot climate, minor shading |
| 80–85% | Good | New system with standard design |
| 85–90% | Excellent | High-efficiency modules, premium inverters, clean design |
| Greater than 90% | World-class | Bifacial modules, tracking, advanced O&M |
A new residential system in a temperate climate should achieve 82–86% PR during commissioning. A commercial system with string inverters and good design should hit 80–85%.
How to Measure PR During Commissioning
Minimum requirements:
- Irradiance sensor (pyranometer or reference cell) in plane-of-array
- Module temperature sensor (back-surface thermocouple)
- Revenue-grade production meter
- Minimum test duration: 7 continuous days for commercial systems
Procedure:
- Install the irradiance sensor on the same tilt and azimuth as the array
- Connect the temperature sensor to the back of a representative module
- Record production meter readings and irradiance data at 15-minute intervals
- Calculate daily PR for each day of the test period
- Average the daily PR values, excluding days with irradiance below 400 W/m² for more than 50% of daylight hours
Pro Tip
Do not calculate PR from a single sunny afternoon. Cloud transients, inverter startup delays, and measurement errors create noise. A 7-day minimum smooths this out. For commercial projects with performance guarantees, 15–30 days of continuous monitoring is standard contract language.
I-V Curve Tracing: Looking Inside the String
An I-V curve tracer measures the full current-voltage characteristic of a PV string. It reveals problems that Voc and Isc tests miss: mismatch, degradation, shading, and bypass diode failures.
What the I-V Curve Shows
A healthy I-V curve has a smooth shape with three distinct regions:
| Region | Description | What It Tells You |
|---|---|---|
| Short-circuit point (Isc) | Current at zero voltage | Overall string health |
| Maximum power point (Pmp) | The knee of the curve where power is maximized | Actual power output |
| Open-circuit point (Voc) | Voltage at zero current | String voltage integrity |
Interpreting Curve Shapes
| Curve Shape | Problem | Cause |
|---|---|---|
| Normal smooth curve with correct Pmp | Healthy string | — |
| Steps or plateaus in curve | Partial shading or bypass diode activation | One or more modules shaded or diode failed |
| Lower Isc than expected | Soiling or degradation | Dirt, pollen, or aged modules |
| Lower Voc than expected | Module mismatch or hot cells | Mixed module batches or thermal damage |
| Flattened knee | High series resistance | Loose connections, corroded terminals, undersized cable |
| Multiple humps | Severe mismatch | Different module types or orientations in same string |
When to Use I-V Curve Tracing
| System Type | I-V Curve Requirement |
|---|---|
| Residential less than 10 kWp | Optional; sample 1–2 strings if problems suspected |
| Commercial 10 kW–1 MW | Recommended; sample 10–20% of strings minimum |
| Utility-scale greater than 1 MW | Required; full array testing or 100% string sampling |
Irradiance must be stable above 400 W/m² during testing. Rapidly changing cloud conditions distort the curve. Early morning or late afternoon is usually unsuitable.
IR Thermal Imaging: Seeing What Eyes Cannot
Infrared (IR) thermal imaging detects temperature differences across the PV array. Hot spots — localized areas running 10–20°C above adjacent cells — indicate defects that reduce output and can cause permanent damage.
IR Imaging Protocol
| Parameter | Requirement | Why It Matters |
|---|---|---|
| Minimum irradiance | Greater than 600 W/m² (preferably greater than 900 W/m²) | Sufficient thermal loading to reveal defects |
| Thermal sensitivity (NETD) | Less than 0.05°C | Detects small temperature differences |
| Camera resolution | Minimum 320×240 pixels | Enough detail for cell-level identification |
| Wind speed | Less than 4 m/s | Wind cools hot spots, masking defects |
| Emissivity setting | 0.85–0.90 | Matches glass-covered PV modules |
| Viewing angle | 60–90° to panel surface | Minimizes reflection artifacts |
Temperature Difference Interpretation
| Delta T (Hot Spot vs. Adjacent Cells) | Severity | Action |
|---|---|---|
| Less than 10°C | Minor | Schedule monitoring at next maintenance |
| 10–20°C | Moderate | Investigate cause; clean if soiling; replace if diode failure |
| Greater than 20°C | Critical | Immediate repair or module replacement required |
| Greater than 40°C | Emergency | Shut down string; fire risk |
Common Hot Spot Causes
- Partial shading: Bird droppings, leaves, or dirt on one cell force the bypass diode to conduct, heating the shaded cell
- Bypass diode failure: A failed open diode forces current through a shaded cell, creating extreme localized heating
- Cell cracks: Micro-cracks from handling or hail create high-resistance paths that dissipate power as heat
- Solder bond degradation: Poor factory soldering or thermal cycling breaks electrical connections
- Manufacturing defects: Impurities or gas pockets in silicon create localized high-resistance regions
Differentiating Hot Spots from Reflections
Move the camera position. If the thermal anomaly stays fixed on the same cell, it is a real hot spot. If it moves relative to your position, it is a reflection of the sun or a nearby warm object.
Monitoring, Metering, and SCADA Setup
A commissioned system that nobody monitors degrades into an underperforming system within 12 months. Monitoring setup is part of commissioning, not an afterthought.
Production Metering
| System Type | Meter Requirement | Accuracy Class |
|---|---|---|
| Residential less than 10 kWp | Generation meter (utility or third-party) | Class 2 |
| Commercial 10 kW–1 MW | Revenue-grade meter with remote read | Class 0.5S or better |
| Utility-scale greater than 1 MW | Revenue-grade meter with dual registration | Class 0.2S |
Verify the meter reads correctly by comparing its register to the inverter production display over a 1-hour period. They should agree within 2%.
Monitoring Portal Configuration
For residential systems, this typically means connecting the inverter to Wi-Fi and verifying the manufacturer’s app shows live data. For solar installers managing multiple commercial projects, monitoring setup is where efficiency gains compound. For commercial systems, it means:
- Configuring the SCADA gateway with correct IP addresses and protocols (Modbus TCP, SunSpec, or proprietary)
- Verifying data logging at 5-minute or 15-minute intervals
- Setting alarm thresholds for inverter faults, low PR, and communication loss
- Testing remote access for the O&M provider and the asset owner
- Configuring automated reporting (daily production summary, monthly PR report)
Cybersecurity (Commercial Systems)
Grid-connected commercial assets are increasingly subject to cybersecurity requirements. Verify:
- Default passwords changed on all network devices
- Firewall rules restrict SCADA traffic to authorized IP ranges
- VPN or encrypted tunnel used for remote access
- Firmware versions are current and from verified sources
Final Documentation: The Paper Trail
Documentation is not bureaucracy. It is the evidence that proves the system was commissioned correctly. Missing documents delay utility Permission to Operate (PTO), void warranties, and create liability exposure.
Required Documents
| Document | Contents | Retention |
|---|---|---|
| Commissioning report | All test results, instrument details, environmental conditions, tester sign-off | Permanent |
| As-built drawings | Final single-line diagram, array layout, cable routes | Permanent |
| Test equipment calibration records | Model, serial number, calibration date, certificate ID | 12 months minimum |
| Equipment datasheets | Module, inverter, mounting, monitoring — all with serial numbers | Permanent |
| Warranty certificates | Module performance warranty, inverter warranty, workmanship warranty | Warranty period + 2 years |
| O&M manual | Maintenance schedules, troubleshooting guide, emergency procedures | System lifetime |
| Rapid shutdown test record | Trigger test results, shutdown time verification | Permanent |
| Arc fault test record (if AFCI equipped) | Test button activation, trip verification | Permanent |
| Utility interconnection approval | PTO letter, final inspection sign-off | Permanent |
| Training record | Attendee names, topics covered, date | Permanent |
The Commissioning Report Template
A professional commissioning report contains these sections:
- Project information: Site address, system size, installer name, commissioning date
- System description: Module model and quantity, inverter model, mounting type, tilt/azimuth
- Visual inspection results: Pass/fail for each checklist item with photo references
- Electrical test results: Tabulated Voc, Isc, insulation resistance, and continuity values for every string
- Performance test results: PR calculation, I-V curve summaries, IR image references
- Protection system verification: Anti-islanding settings, ground fault settings, RCD test results
- Monitoring verification: Portal screenshots, meter accuracy check
- Punch list closure: All critical and major items closed with sign-off
- Tester certification: Name, signature, date, qualification level
Customer Training and Handover
The handover meeting is the last chance to set expectations and prevent future disputes. Do not rush it.
Training Agenda (30–45 Minutes)
| Topic | Duration | Key Points |
|---|---|---|
| System overview | 5 min | How the system works, what each component does |
| Monitoring portal | 10 min | How to log in, read daily production, interpret alerts |
| Safety | 5 min | Emergency shutdown procedure, who to call, arc flash warning |
| Maintenance | 10 min | Cleaning schedule, vegetation management, visual inspection checklist |
| Warranty | 5 min | What is covered, how to claim, contact details |
| Documentation | 5 min | What documents the customer receives, where to store them |
Handover Checklist
- Customer has monitoring portal login credentials
- Customer has digital and physical copies of all documentation
- Customer knows the emergency shutdown procedure
- Customer knows who to call for faults, maintenance, and warranty claims
- Customer has signed the handover certificate
- Installer has registered all equipment warranties in the customer’s name
- Utility PTO has been received and shared with the customer
Residential vs Commercial Commissioning
The protocol is the same. The scale, timeline, and documentation depth are not.
| Factor | Residential (less than 10 kWp) | Commercial (10 kW–1 MW) |
|---|---|---|
| Timeline | 2–4 hours | 1–3 days |
| DC testing | Basic Voc, Isc, polarity, insulation | Full string-by-string documentation |
| I-V curve tracing | Optional, sample basis | 10–20% minimum sampling |
| IR thermal imaging | Optional | Recommended or required |
| PR testing | Simplified estimate | 7–15 day continuous monitoring |
| Metering | Basic generation meter | Revenue-grade with remote read |
| SCADA/monitoring | Manufacturer app | Full SCADA with alarms and reporting |
| Documentation | Simplified checklist | Comprehensive certified report |
| Training | 15–30 min walkthrough | Formal training session with multiple attendees |
| Commissioning cost | 1–3% of system cost (~$100–$750) | 0.1–0.5% of system cost (~$1,500–$10,000) |
| Typical cost example | $500 for 6 kWp system | £2,500 for 350 kWp factory roof |
Why Commercial Costs Less as a Percentage
Commercial systems benefit from economies of scale. The same technician with the same test equipment can verify 50 strings in a day. On a residential system, that same technician might verify 2 strings. The fixed cost of mobilization, calibration, and reporting is spread across more kilowatts.
What Most Guides Miss: The Hidden Failure Modes
Most commissioning guides stop at the standard tests. Here is what they leave out.
The String Mismatch Nobody Tests For
Two strings can both pass Voc and Isc tests individually and still underperform when connected to the same MPPT input. If one string has 5% lower current due to partial shading or soiling, the MPPT tracker settles at a compromise voltage that drags both strings down. The fix: measure Isc for all strings on the same MPPT and flag any pair with more than 5% difference.
The Inverter Setting That Destroys Production
A commercial installer in Manchester commissioned a 250 kWp system with the inverter grid code set to “Germany” instead of “UK G99.” The voltage ride-through settings were wrong. The inverter tripped 12 times in the first week during minor grid disturbances. Each trip lost 3–5 minutes of production while the inverter resynchronized. Over a year, that misconfiguration cost roughly 1.2% of annual yield. The fix: always verify grid code selection against the utility interconnection agreement, not the installer’s memory. Modern solar design software with integrated inverter databases prevents this class of error at the design stage. Also see: Germany solar subsidies.
The Monitoring Gap That Hides Underperformance
A residential customer in Bristol called after 8 months complaining that bills had not dropped. The monitoring portal showed the system producing normally. The issue: the portal was reading inverter output, not metered export. A failed meter CT (current transformer) meant the system was producing but not registering for net metering credits. The utility billed the customer for 100% of consumption. The fix: always verify the production meter register against the inverter display during commissioning. Do not trust the monitoring portal alone. For teams managing multiple sites, solar software with integrated monitoring dashboards helps catch these discrepancies before they cost the customer money.
The Ground Fault That Passes the Megger Test
Insulation resistance tests measure DC resistance to ground. They do not detect AC ground faults. A damaged AC cable inside an inverter can leak current to ground without affecting DC insulation readings. The fix: perform RCD (residual current device) testing on the AC side and verify ground fault protection settings on the inverter.
The Documentation Trap
Thirty-four percent of commissioning delays are caused by documentation errors — not technical faults. Missing as-builts, incorrect serial numbers, unsigned test records, or incomplete warranty registrations can block utility PTO for weeks. The fix: assign a dedicated documentation technician who does nothing but verify paperwork during the commissioning phase.
Common Commissioning Failures and Fixes
| Failure | Frequency | Root Cause | Fix |
|---|---|---|---|
| Loose cable connections | 22% | Vibration, thermal cycling, inadequate torque | Retorque all terminals; use calibrated torque wrench |
| Incorrect string polarity | 14% | Rushed wiring, poor labeling | Test polarity before energization; use colored cable ties |
| Inverter communication errors | 12% | Wrong settings, firmware bugs, network issues | Factory reset and reconfigure; update firmware |
| String mismatch/shading | 10% | Design error, vegetation growth, new obstructions | Redesign string layout; trim vegetation; add optimizers |
| Poor grounding | 8% | Painted surfaces, missing jumpers, wrong conductor size | Scrape paint at bonding points; add jumpers; resize conductors |
| Documentation errors | 34% | Rushed paperwork, missing signatures, lost records | Dedicated documentation technician; digital checklists |
Case Studies: Real Projects, Real Timelines
Case Study 1: 6 kWp Residential, Bristol, UK
| Metric | Value |
|---|---|
| System size | 6 kWp |
| Location | Bristol, UK |
| Modules | 15 × 400W monocrystalline |
| Inverter | Single-phase hybrid, 5 kW |
| Commissioning date | March 2026 |
| Commissioning duration | 3.5 hours |
| Tests performed | Voc, Isc, polarity, insulation resistance, ground continuity, inverter startup, RCD test, monitoring setup |
| PR measured | 83.2% (7-day average, March) |
| Commissioning cost | £420 (included in EPC contract) |
| Key lesson | Morning dew caused one string to read 0.4 MΩ on first insulation test. Retest at midday after 3 hours of sun gave 2.1 MΩ — a pass. Always retest marginal insulation readings before replacing components. |
Case Study 2: 350 kWp Factory Rooftop, Leicester, UK
| Metric | Value |
|---|---|
| System size | 350 kWp |
| Location | Leicester, UK |
| Modules | 875 × 400W monocrystalline |
| Inverters | 7 × 50 kW three-phase string inverters |
| Commissioning date | April 2026 |
| Commissioning duration | 2.5 days |
| Tests performed | Full IEC 62446-1 Category 1 and 2: all strings Voc/Isc, insulation resistance, ground continuity, I-V curve sampling (20% of strings), IR thermal imaging, 7-day PR test, power quality analysis, SCADA commissioning |
| PR measured | 84.7% (7-day average, April) |
| Commissioning cost | £2,800 (separate line item) |
| Key lesson | IR imaging found 3 modules with bypass diode failures (delta T 24–31°C) that passed Voc and Isc tests. The modules were replaced under warranty before handover. I-V curve tracing on those strings confirmed normal performance after replacement. |
Case Study 3: 1.2 MW Ground-Mount, Gujarat, India
| Metric | Value |
|---|---|
| System size | 1.2 MW DC / 1.0 MW AC |
| Location | Gujarat, India |
| Modules | 2,400 × 500W bifacial |
| Inverters | 4 × 250 kW central inverters |
| Commissioning date | January 2026 |
| Commissioning duration | 8 days |
| Tests performed | Full Category 1 and 2, 100% string I-V curves, full-array IR drone survey, 15-day PR demonstration, power quality and harmonics testing, anti-islanding witness test with utility, SCADA and cybersecurity verification |
| PR measured | 86.3% (15-day average, January) |
| Commissioning cost | $8,500 (0.7% of EPC value) |
| Key lesson | The 15-day PR test period included 3 days of heavy dust haze. PR dropped to 78% on those days. The EPC contract specified PR testing during “clear sky conditions” but did not define clear sky. The dispute added 5 days to commissioning while lawyers negotiated a retest window. Define weather criteria in the contract. |
Timeline and Cost Summary
Commissioning Timeline by System Size
| Phase | Residential (less than 10 kWp) | Commercial (10 kW–1 MW) | Utility (greater than 1 MW) |
|---|---|---|---|
| Pre-commissioning prep | 1–2 hours | 0.5–1 day | 1–2 days |
| Visual inspection | 0.5–1 hour | 0.5–1 day | 1–2 days |
| DC testing | 0.5–1 hour | 0.5–1 day | 1–2 days |
| AC testing and inverter startup | 0.5–1 hour | 0.5–1 day | 1–2 days |
| Performance validation | Optional | 1–2 days | 3–5 days |
| PR demonstration | Not required | 7 days (parallel) | 15 days (parallel) |
| Monitoring/SCADA setup | 0.5 hour | 0.5–1 day | 1–2 days |
| Documentation and handover | 0.5 hour | 0.5–1 day | 1–2 days |
| Total active commissioning | 2–4 hours | 1–3 days | 1–2 weeks |
| Total calendar time (including PR test) | Same day | 7–10 days | 2–4 weeks |
Commissioning Cost Breakdown
| Cost Component | Residential | Commercial (350 kWp) | Utility (1.2 MW) |
|---|---|---|---|
| Labor (technician days) | £150–£250 | £800–£1,200 | £3,000–£5,000 |
| Test equipment (rental/depreciation) | £50–£100 | £300–£500 | £1,000–£2,000 |
| I-V curve tracer (if used) | Not applicable | £200–£400 | £500–£1,000 |
| IR thermal imaging | Not applicable | £200–£400 | £500–£1,500 |
| Documentation and reporting | £50–£100 | £300–£500 | £500–£1,000 |
| Total | £250–£450 | £1,800–£3,000 | £5,500–£10,500 |
| As % of system cost | 1–3% | 0.5–0.8% | 0.4–0.7% |
Design Systems That Commission Cleanly
SurgePV’s solar design software catches string mismatch, shading, and voltage window errors before installation begins. Fewer surprises on commissioning day means lower costs and faster handover.
Book a DemoNo commitment required · 20 minutes · Live project walkthrough
Commissioning Test Parameters Reference Table
| Test | Instrument | Setting | Acceptance | Standard |
|---|---|---|---|---|
| Voc | Digital multimeter | DC voltage | ±5% of expected | IEC 62446-1 Clause 6.4 |
| Isc | DC clamp meter | DC current | ±10% of expected | IEC 62446-1 Clause 6.5 |
| Polarity | Digital multimeter | DC voltage | No reversals | IEC 62446-1 Clause 6.2 |
| Insulation resistance | Megohmmeter | 500V or 1000V DC | Greater than or equal to 1 MΩ (>120V) | IEC 62446-1 Clause 6.7 |
| Ground continuity | Low-resistance ohmmeter | 4-wire Kelvin | Less than or equal to 1 ohm | IEC 62446-1 Clause 6.1 |
| AC voltage | Digital multimeter | AC voltage | ±10% of nominal | Local grid code |
| Frequency | Power quality analyzer | Frequency | ±0.5 Hz (50 Hz) | Local grid code |
| Power factor | Power quality analyzer | Power factor | 0.95–1.00 lagging | Utility requirement |
| THD voltage | Power quality analyzer | Harmonics | Less than 5% | IEEE 519 / local code |
| PR | Irradiance meter + production meter | 7-day average | 80–85% typical | IEC 61724 |
| I-V curve | Curve tracer | Greater than or equal to 400 W/m² | Pmp within ±5% | IEC 61829 |
| IR thermal | Thermal camera | Greater than or equal to 600 W/m² | Delta T less than 20°C | IEC 62446-3 |
| Anti-islanding | Inverter settings / grid simulator | Trip time | Less than or equal to 2 seconds | IEC 62116 |
Conclusion: Three Actions for Your Next Commissioning
Commissioning is where design meets reality. A system that looks perfect on paper can fail its first test. A system with minor installation errors can be corrected in hours if the tests are done right. The difference between a smooth handover and a 3-week delay is not luck. It is protocol.
Take three actions on your next project:
-
Do the pre-commissioning walk the day before testing. Catch the loose clamp, the missing label, and the wet junction box before they become test failures.
-
Document every reading at the moment you take it. A photo of the multimeter display with the string number written on tape next to it takes 5 seconds and prevents 5 hours of dispute later.
-
Verify the meter, not just the inverter. The monitoring portal shows what the inverter thinks it produced. The revenue meter shows what the utility thinks you produced. They must agree.
Commissioning is not the end of the project. It is the proof that the project was done right. For more solar installation guides, visit our blog. To learn more about technical terms used in this guide, see our glossary. If you are ready to streamline your design-to-commissioning workflow, book a demo to see how SurgePV helps installers deliver projects that pass every test the first time.
Frequently Asked Questions
What is a solar system commissioning protocol?
A solar system commissioning protocol is the structured sequence of inspections, electrical tests, performance validations, and documentation steps required to verify that a photovoltaic system is safe, correctly installed, and ready for operation. It follows standards such as IEC 62446-1 for grid-connected systems and typically covers DC testing, AC testing, inverter startup, anti-islanding verification, performance ratio measurement, and final handover documentation.
How long does solar commissioning take?
Residential systems under 10 kWp typically require 2–4 hours for commissioning. Commercial systems from 10 kW to 1 MW need 1–3 days. Utility-scale systems above 1 MW can take 1–2 weeks or longer, depending on the complexity of SCADA integration, multi-day performance ratio testing, and utility witness testing requirements.
What does IEC 62446-1 require for PV commissioning?
IEC 62446-1:2016 mandates seven Category 1 tests for all grid-connected systems: continuity of protective earthing, polarity verification, PV string junction box inspection, open-circuit voltage (Voc) measurement, short-circuit or operational current test, functional testing of system operation, and insulation resistance testing. For larger or complex systems, Category 2 adds I-V curve measurement and infrared thermographic inspection.
What is Performance Ratio (PR) in solar commissioning?
Performance Ratio (PR) is the ratio of actual energy output to the theoretical maximum output under standard test conditions. It is calculated as PR = (Actual AC Energy / Installed Capacity) / (In-Plane Irradiation / 1000 W/m²). A PR of 80–85% is typical for well-performing new systems. Values below 75% indicate problems such as shading, soiling, inverter underperformance, or wiring losses.
What are the most common solar commissioning failures?
The most common failures are loose cable connections (22% of issues), incorrect string polarity (14%), inverter communication or settings errors (12%), string mismatch or shading (10%), and poor grounding or bonding (8%). Documentation errors — missing test records, incorrect as-builts, or incomplete labeling — cause delays in 34% of commissioning projects.
How much does solar commissioning cost?
Commissioning costs range from 1–3% of total system cost for residential systems (approximately $100–$750) to 0.1–0.5% for commercial systems above 100 kWp. The percentage drops with system size due to economies of scale. A typical 350 kWp commercial rooftop in the UK budgets roughly £1,500–£3,000 for full commissioning including electrical testing, performance validation, and documentation. See our guide on MCS Certification for Solar Installers in the UK for more. For United Kingdom-specific compliance details, see United Kingdom comparisons/solar-design-software.
What tools are needed for PV commissioning?
Essential tools include a digital multimeter for Voc and polarity, a clamp meter for Isc, an insulation resistance tester (megohmmeter) for Riso, a ground continuity tester, an I-V curve tracer for performance diagnostics, an IR thermal camera for hot spot detection, a calibrated irradiance meter, and a torque wrench for verifying electrical connections. All instruments must have current calibration certificates traceable to national standards.
What is anti-islanding and why does it matter?
Anti-islanding is a safety function that forces grid-tied inverters to shut down within 2 seconds when the utility grid loses power. It prevents the PV system from energizing a dead grid segment, which would endanger utility workers and damage equipment. IEC 62116 governs anti-islanding test procedures, and utility interconnection agreements universally require documented proof of compliance.
What is the difference between residential and commercial solar commissioning?
Residential commissioning is simpler: 2–4 hours, basic DC and AC tests, single inverter, minimal documentation, and no SCADA. Commercial commissioning is comprehensive: 1–3 days or more, full IEC 62446-1 Category 1 and 2 testing, revenue-grade metering, multi-inverter coordination, SCADA integration, cybersecurity verification, multi-day PR testing, formal O&M training, and extensive documentation for lender or investor sign-off.
What documentation is required at solar handover?
Required handover documents include: as-built single-line diagrams and array layout drawings, complete commissioning test records with instrument calibration details, equipment datasheets and firmware versions, warranty certificates for modules, inverters, and mounting, O&M manuals with maintenance schedules, rapid shutdown and arc fault test records, utility interconnection approval and Permission to Operate (PTO), and a signed commissioning report with tester identity and date. Solar proposal software generates professional quotes in minutes.