Quick Answer
Solar simulation accuracy decides whether a project pays back on schedule or quietly bleeds revenue for two decades. A 7,500-kWp commercial array forecast to deliver 11.2 GWh per year but actually producing 10.2 GWh is not a rounding error. Clean Power Research now projects 4.9 percent underperformance over the next 30 years from rising panel temperatures and lower rainfall, which compounds soiling.
Solar simulation accuracy decides whether a project pays back on schedule or quietly bleeds revenue for two decades. A 7,500-kWp commercial array forecast to deliver 11.2 GWh per year but actually producing 10.2 GWh is not a rounding error. That 8.9 percent gap represents roughly $90,000 in lost annual revenue at typical European wholesale prices, compounded across the 25-year asset life. This guide breaks down how the top simulation tools, PVsyst, HelioScope, Aurora Solar, SAM, and PV*SOL, actually compare against measured production data, why gaps appear, and what installers and developers can do to tighten the loop between forecast and reality. Also see: European Solar Incentives.
Solar simulation accuracy decides whether a project pays back on schedule or quietly bleeds revenue for two decades. A 7,500-kWp commercial array forecast to deliver 11.2 GWh per year but actually producing 10.2 GWh is not a rounding error. Clean Power Research now projects 4.
TL;DR — Solar Simulation Accuracy in 2026
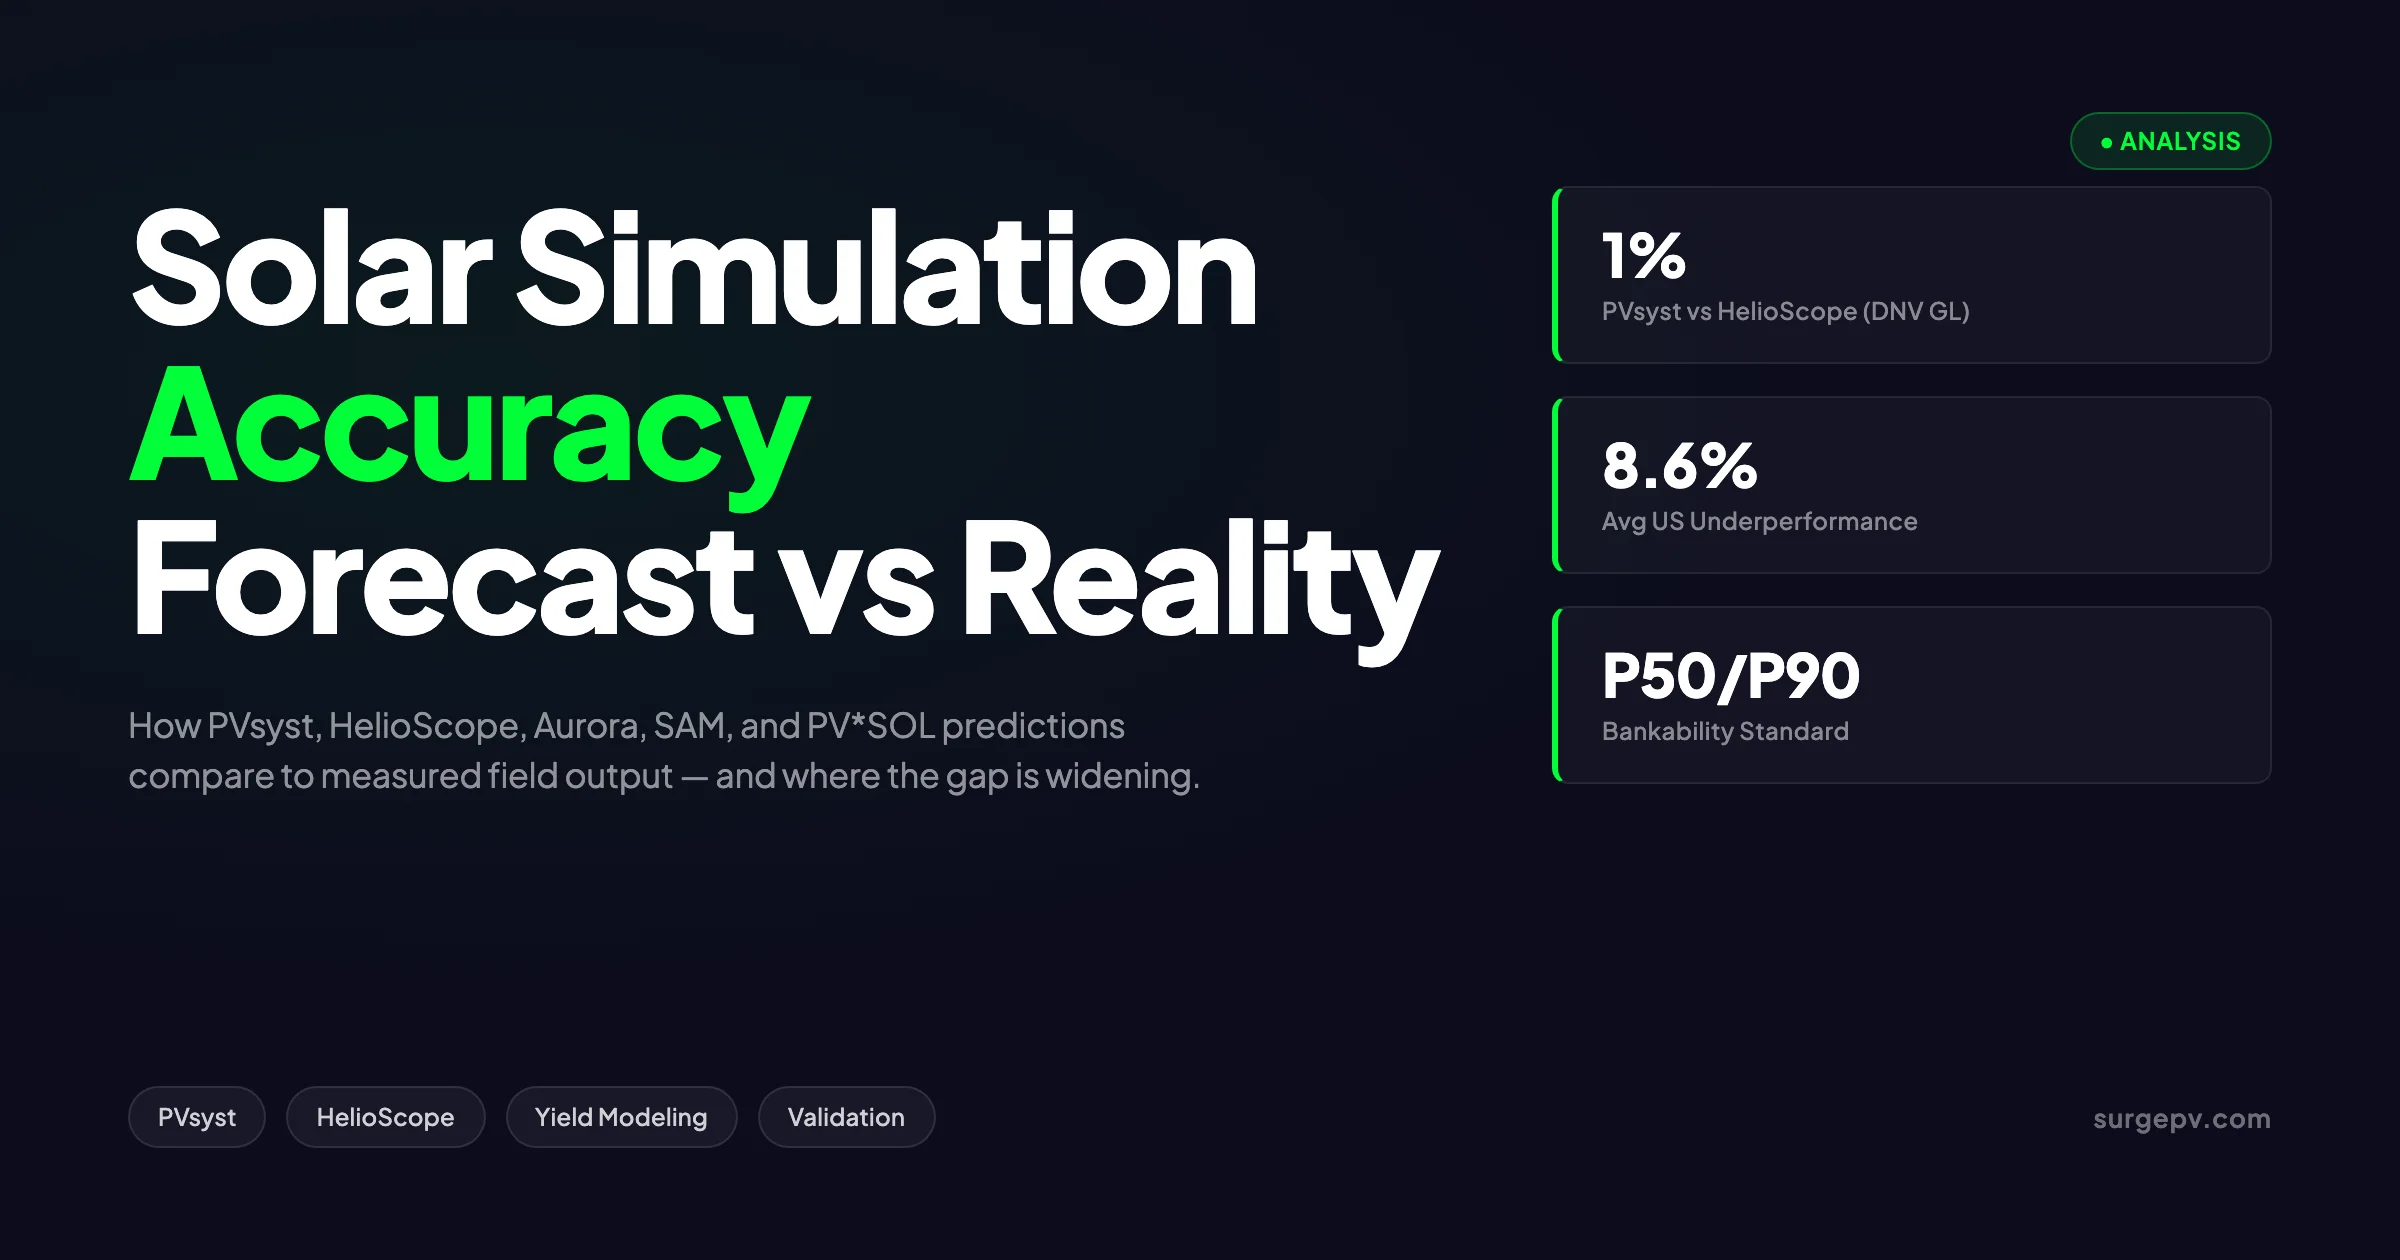
Top simulation tools typically predict annual yield within 1 to 5 percent of measured production when inputs are accurate. PVsyst and HelioScope agree within 1 percent (DNV GL validated). However, the 2025 kWh Analytics Solar Risk Assessment found US systems average 8.6 percent below industry-wide P50 forecasts, driven by overly optimistic soiling, degradation, and availability assumptions rather than core software error. Better meteorological data and disciplined loss modeling close most of the gap.
What this guide covers:
- The actual measured accuracy of PVsyst, HelioScope, Aurora Solar, SAM, and PV*SOL against field data
- How DNV GL, NREL, and PsomasFMG independently validated software output
- The 2025 kWh Analytics underperformance numbers and what drives them
- How P50, P90, and P99 quantify forecast uncertainty
- Eight reasons simulations diverge from real production
- IEC 61724-1 performance ratio analysis and how to close the gap on your own projects
2026 State of Solar Simulation Accuracy
The headline finding from the 2025 kWh Analytics Solar Risk Assessment is that US solar assets are running 8.6 percent below the industry-wide P50 forecast across 34,000 system-months of operating data. That figure has worsened from 6.3 percent measured in the 2016 to 2019 window. The trend is moving in the wrong direction.
This is not a story about bad software. PVsyst, HelioScope, SAM, and PV*SOL all produce accurate yield estimates when their inputs match reality. The gap is driven by what kWh Analytics calls a “systemic overestimation bias”: the developer, the EPC contractor, and the long-term owner are all financially motivated to assume favorable production, and they generally do. Optimistic soiling, snow, availability, and degradation inputs flow into otherwise sound models and produce optimistic outputs.
Where Real Output Lands Versus Forecast
| Metric | 2016-2019 (kWh Analytics) | 2025 (kWh Analytics) |
|---|---|---|
| Average underperformance vs P50 | 6.3% | 8.6% |
| Share of projects missing P99 | ~14% (1 in 7) | ~14% (stable) |
| Projects missing target by >10% (weather-adjusted) | ~25% | Trending higher |
| Inverter share of total downtime | — | ~40% |
| Average module degradation rate | 0.5%-1.0%/year | 0.5%-1.0%/year |
A separate 2025 Australian study comparing PV*Sol Expert simulations to a real plant in Plovdiv, Bulgaria found systematic overestimation, especially during autumn and winter months when reduced solar angles, shorter day lengths, and snow accumulation compress real-world output. The Bulgarian plant data confirmed what field engineers have observed for years: simulation tools handle clear-sky summer well and shoulder-season variability less well. For Australia-specific compliance details, see Australia comparisons/lgc-vs-stc.
Why the Gap Is Widening
Several converging factors:
- Module quality has slipped at the bottom of the price curve. When polysilicon hit historic lows in 2024 and 2025, some Tier 2 and Tier 3 modules showed degradation rates 30 to 50 percent above nameplate.
- Inverter availability is dragging real output. kWh Analytics tied roughly 40 percent of PV system downtime to inverter malfunctions, and warranty replacement cycles have lengthened.
- AI-driven asset management is generating false negatives. kWh Analytics flagged that out-of-the-box AI models misclassified up to 20 percent of operational issues and were wrong on root cause for weather damage 40 to 50 percent of the time.
- Climate change is showing up in long-term forecasts. Clean Power Research now projects 4.9 percent underperformance over the next 30 years from rising panel temperatures and lower rainfall, which compounds soiling.
All of these factors point to the same conclusion: the solar design software does its job, but the inputs and the operating environment have drifted from the assumptions that older models were calibrated against.
How Solar Simulation Software Actually Works
Every modern simulation tool, regardless of vendor, runs the same fundamental calculation chain. Understanding this chain is the foundation of judging accuracy.
The Calculation Stack
-
Meteorological input layer. The simulator pulls a typical meteorological year (TMY) or time-series irradiance dataset from a provider such as Meteonorm, SolarAnywhere, PVGIS, NASA POWER, or Solargis. The dataset provides hourly or sub-hourly global horizontal irradiance (GHI), direct normal irradiance (DNI), diffuse horizontal irradiance (DHI), ambient temperature, wind speed, and humidity. For Global-specific compliance details, see Global net-metering-by-country.
-
Transposition to plane of array. Algorithms such as Hay-Davies, Perez, or Reindl convert GHI to plane-of-array irradiance based on module tilt, azimuth, and surrounding geometry. Transposition error alone can introduce 1 to 3 percent annual deviation.
-
3D shading model. A 3D scene with trees, buildings, terrain, and adjacent module rows calculates near and far shading at sub-hourly intervals. PVsyst uses raycasting on simplified geometry; HelioScope models individual bypass diodes; Aurora uses LIDAR-grade imagery for residential.
-
Module electrical model. A single-diode equivalent circuit converts cell-level POA irradiance and temperature into DC power. Datasheet specifications (Voc, Isc, Vmp, Imp, temperature coefficients) drive the curve.
-
DC system losses. Soiling, mismatch, ohmic wiring, module quality, IAM (incidence angle modifier), and shading aggregate before inverter input.
-
Inverter model. Efficiency curves from California Energy Commission test data or manufacturer specifications convert DC to AC at each timestep. Maximum power point tracking (MPPT) behavior, clipping at the AC nameplate, and standby losses are modeled.
-
AC system losses. Transformer, line, and parasitic losses reduce the energy reaching the meter.
-
Statistical output layer. Annual energy yield in kWh/year, specific yield in kWh/kWp, performance ratio, and optionally P50/P90/P99 confidence intervals based on uncertainty propagation.
Where Real Tools Diverge
The biggest divergences between tools are not in step 1 or step 8 but in steps 3 and 5. Different shading engines and different default loss values can shift the same nominal project by 2 to 4 percent of annual yield. This is why same-input cross-validation between PVsyst and HelioScope produces tight 1 percent agreement, but real-world surveys of multi-tool comparisons show wider 3 to 7 percent spreads driven by user input variation. For the latest details on France, see Agricultural Solar Case Study.
Validation Statistics: How Accuracy Is Measured
Before comparing tool A against tool B, the industry uses a standard vocabulary for validation error. These are the metrics that show up in DNV GL reports, NREL studies, and lender-grade independent engineer reviews.
The Five Core Validation Statistics
| Metric | What It Measures | Why It Matters |
|---|---|---|
| Mean Bias Deviation (MBD / Bias) | Systematic over- or underestimation | Tells you if a tool consistently predicts high or low |
| Mean Absolute Deviation (MAD) | Average absolute error, ignoring sign | Prevents positive and negative errors from canceling |
| Root Mean Square Deviation (RMSD) | Squared error, weights large misses more | Penalizes outliers more than MAD |
| Correlation (R or R²) | Linear fit quality between modeled and measured | Shows whether the tool tracks production patterns |
| Kolmogorov-Smirnov Index (KSI) | Distributional similarity | Tests whether modeled and measured distributions match |
In a typical validation paper, a yield estimation tool that produces an annual MBD of negative 0.74 percent and a monthly RMSD of 4.2 percent would be characterized as “highly accurate on annual aggregates but moderately accurate on monthly resolution.” That distinction matters because debt service is monthly, while yield warranties are usually annual.
Why Monthly Accuracy Is Worse Than Annual
A consistent finding across PVsyst validation studies, including those summarized by PVsyst’s own documentation, is that monthly errors average two to three times worse than annual errors. The reason is statistical: positive and negative monthly deviations partially cancel when aggregated to a year. A site that overpredicts by 6 percent in February and underpredicts by 5 percent in August can still land within 0.5 percent on the annual.
This has practical implications. A 12-month operational data sample is the minimum needed to test a model’s bias. Anything shorter is noise.
PVsyst Accuracy: The Bankability Gold Standard
PVsyst remains the reference tool for utility-scale finance and the most heavily validated simulation engine in the market. It has been the bankability standard for roughly 30 years, and lender independent engineers default to PVsyst output for P50/P90 yield reports.
Independent Accuracy Validation
PVsyst’s own published validation work, dating to the 1996 version 2 release across seven Swiss sites, showed annual accuracy within plus or minus 5 percent. That bound has tightened with each version. Recent independent studies report:
- Australia (six sub-7 kW residential systems): PVsyst slightly underestimated production, confirming a 2010 SolarPro Magazine finding that PVsyst is the most conservative of the major modeling tools.
- Chile (utility-scale tracking system with high-resolution measured data): Total relative error between modeled and measured energy yield was negative 0.74 percent. Very strong agreement.
- Westbrock and Collins (602 kWp single-axis tracker, 2013): Annual MBE ranged from negative 1.4 percent to positive 5.4 percent depending on which meteo dataset fed the model.
- Morocco (Assa site): Strong agreement on annual energy and irradiation, with weaker accuracy on ambient temperature modeling.
- Greece (19.8 kWp small commercial): PVsyst overestimated POA irradiance but underestimated electrical output, suggesting the single-diode model carried more error than the irradiance model.
Where PVsyst Tends to Miss
PVsyst’s documentation puts its theoretical annual MBD at 1 to 2 percent. In practice, that bound is achievable only with high-quality meteorological data (Meteonorm Pro, Solargis ground-calibrated, or on-site irradiance instruments) and well-tuned loss assumptions. Two recurring sources of PVsyst error:
-
Meteorological data uncertainty. Off-the-shelf meteo carries 5 to 10 percent annual uncertainty. PVsyst can be no more accurate than its weather input.
-
Default loss assumptions. PVsyst defaults to 2 percent soiling, 2 percent mismatch, and 0 percent unavailability. Real-world soiling in dusty climates can reach 5 to 8 percent, and unavailability often runs 1 to 3 percent annually.
When engineers calibrate these inputs against measured site data, PVsyst typically lands within 1 to 3 percent of actual annual production.
The Bankability Argument
The reason lenders still demand PVsyst over alternatives is institutional, not technical. PVsyst has 30 years of independent engineer review behind it, a documented validation history, and a stable methodology that has not pivoted aggressively across versions. For a 25-year asset that will be refinanced multiple times, that stability matters.
This is why most major EPCs run PVsyst vs HelioScope in a complementary workflow: HelioScope for fast layout and design iteration, PVsyst for the final investment-grade yield report.
HelioScope Accuracy: Validated Within 1% of PVsyst
HelioScope, owned by Aurora Solar since 2019, is the most heavily benchmarked web-native simulation platform in the market. The DNV GL validation from 2014, combined with NREL shading work, made it the first web-based tool with formal lender-grade validation.
DNV GL Independent Validation
In 2014, DNV GL ran HelioScope against PVsyst across multiple project archetypes and confirmed that energy yield estimates fall within 1 percent when project assumptions align. That study has been the industry benchmark for cross-tool comparison ever since.
A 2018 PsomasFMG case study took it further. Across a portfolio of operating commercial systems, the variance between HelioScope predicted yield and measured production averaged 0.26 percent. That is tighter than the best PVsyst validations on equivalent fleets.
NREL Shading Validation
Independent shading validation work at NREL tested HelioScope’s 3D shading engine against LiDAR-derived obstruction models at sites in Los Angeles, Denver, and Camden. Error range: negative 7.0 percent to positive 4.3 percent. NREL concluded HelioScope is “as accurate as LiDAR sources” for shading analysis, which is the highest endorsement available for a non-LiDAR tool.
What Makes HelioScope Different
HelioScope models each module as a separate electrical element, including individual bypass diodes. This means partial shading and mismatch losses are simulated more granularly than in PVsyst’s default string-level model. For complex commercial roofs with HVAC obstructions or near-shading trees, HelioScope often produces more realistic yield estimates than PVsyst with default settings.
The trade-off is project scale. HelioScope has a hard 15 MW project ceiling and performance degrades above 5 MW. For utility-scale work above 5 MW, RatedPower and PVsyst remain the standards.
October 2025 Bankability Milestone
In October 2025, Sunstone Credit formally recognized HelioScope as the first bankable web-native commercial solar design platform. That recognition matters because it gives commercial developers a single tool path from design to financing without needing a final PVsyst rerun. See Design Commercial Solar System 1MW for detailed guidance.
For deeper detail on HelioScope’s strengths and constraints, see our full HelioScope review.
Aurora Solar, SAM, and PV*SOL: How the Rest Compare
Beyond the PVsyst-HelioScope axis, three other simulators see significant deployment. Each has a distinct accuracy profile and use case.
Aurora Solar (Residential Strength, Less Benchmarked at C&I)
Aurora is the dominant residential design tool in North America. Its strength is high-resolution LIDAR-grade rooftop imagery, automated 3D shading from cloud-fetched aerial data, and direct integration with proposal generation. Aurora is widely used but is not independently benchmarked against PVsyst at C&I scale, primarily because Aurora’s product focus is residential. For more on this topic, see How to Design Residential Solar System.
For residential applications, Aurora’s accuracy is generally considered strong, with shading and tilt modeling well tuned to single-family rooftops. For commercial and industrial work, the Aurora Solar vs HelioScope comparison generally favors HelioScope because of its C&I optimization and bankable yield methodology.
SAM (System Advisor Model, NREL)
NREL’s System Advisor Model is open source and free. It is heavily used in research, government project evaluations, and academic publishing. SAM uses the same single-diode module model as PVsyst but exposes more tunable parameters in its user interface. Findings from independent benchmark studies indicate SAM delivers strong accuracy when calibrated, often matching PVsyst within 2 to 3 percent on annual yield.
SAM’s main limitation for commercial use is workflow. The interface is engineer-friendly but not designer-friendly, and there is no integrated proposal output. SAM is the gold standard for research-grade studies, but it is rarely the production tool for an installer pipeline.
PV*SOL (Valentin Software)
PVSOL is widely deployed in Europe, especially in the German and Italian markets where it is well-supported by local distributor channels. PVSOL Premium includes 3D shading modeling, animated sun-path visualization, and detailed battery storage simulation. Reported accuracy is broadly comparable to PVsyst, with most validation studies showing annual MBE within plus or minus 3 percent. Read more about Commercial Rooftop Solar Case Study Italy. For the latest details on Germany, see Community Solar Projects Germany.
The 2025 Bulgarian study mentioned earlier found PVSOL Expert systematically overestimated output in autumn and winter, with the gap reaching 8 to 12 percent in some months. The pattern suggests PVSOL’s default temperature and irradiance models may be over-tuned for summer conditions in mid-latitude climates. As with all simulators, calibrating loss inputs against site data narrows the gap considerably.
Side-by-Side Comparison
| Tool | Best Use Case | Reported Annual Accuracy | Independent Validation | Bankability |
|---|---|---|---|---|
| PVsyst | Utility-scale, lender reports | 1-5% MBD | Multiple peer-reviewed studies | Gold standard |
| HelioScope | C&I (100 kW - 5 MW) | 0.26-1% vs PVsyst | DNV GL 2014, NREL shading | Bankable (Oct 2025) |
| Aurora Solar | Residential design & sales | Not formally benchmarked at C&I | None at C&I scale | No |
| SAM | Research, government, RFP analysis | 2-3% vs PVsyst | NREL internal | Indirect (academic) |
| PV*SOL | European residential & C&I | ±3% typical | Limited public data | Regionally accepted |
Compare Your Project Forecasts in 20 Minutes
See how SurgePV combines PVsyst-grade accuracy with HelioScope-level workflow speed on your own active project.
Book a DemoNo commitment required · 20 minutes · Live project walkthrough
P50, P90, P99: How Software Quantifies Uncertainty
Predicting a single annual yield number is only half of what simulation software should do. The other half is quantifying how confident the forecast is. That is where P-values come in.
Definitions
- P50: Median forecast. The plant has a 50 percent probability of producing more than this value in any given year. This is the central estimate.
- P75: Conservative central case. Exceeded in 75 percent of years.
- P90: Downside stress test. Exceeded in 90 percent of years. Lenders size debt against P90.
- P95: Deep stress case. Exceeded in 95 percent of years.
- P99: Worst-case bound. Exceeded in 99 percent of years.
The mathematical relationship is straightforward when uncertainty is approximately normal: P90 equals P50 times (1 minus 1.282 times sigma_total), where sigma_total is the combined uncertainty as a fraction of P50.
Sources of Uncertainty
Combined uncertainty comes from multiple independent contributors:
| Uncertainty Source | Typical Range | Notes |
|---|---|---|
| Satellite irradiance model error | 2-4% (annual GHI) | Lower with on-site calibration |
| Interannual weather variability | 3-5% | Year-to-year solar resource variation |
| PV simulation model error | 2-3% | Single-diode model, loss assumptions |
| Module performance vs nameplate | 1-3% | Quality binning, datasheet tolerance |
| Soiling and snow variability | 1-3% | Site-specific |
| Inverter availability | 0.5-2% | Downtime modeling |
Combined via root-sum-square (assuming independence): sigma_total commonly lands at 6 to 8 percent for a typical commercial project. That produces a P90 roughly 7 to 10 percent below P50.
Why Uncertainty Is Often Underestimated
A 2024 ARENA study examined 20 operating Australian PV sites and compared forecast P50 to P90 spreads against actual performance distributions. The forecast P90 was typically only 6 percent below P50, but the measured distribution showed P90 was actually 11.3 percent below P50. In other words, the industry consistently underestimates the width of the uncertainty distribution. The June 2025 PV Magazine analysis of P50, P90, and P99 reinforces this finding with additional examples from European utility-scale projects.
This matters because P90 is the number lenders use to size debt. Underestimating P90 means projects are over-leveraged relative to their true downside risk.
For a deeper treatment of the math, the P50 P90 energy yield explained guide breaks down the calculation step by step. The P50/P90 glossary entry provides a one-page reference.
The Two-Stage Uncertainty Decomposition
NREL recommends decomposing total uncertainty into two stages:
- Interannual weather variability. Cannot be reduced by better modeling, only by longer site data records.
- Model and parameter uncertainty. Can be reduced by better meteorological inputs, better shading scenes, and tighter loss assumptions.
If model uncertainty dominates weather variability for a given project, investment in better tooling pays off. If weather variability dominates, the project needs more data history, not better software.
The 8 Most Common Sources of Prediction Error
When a project underperforms, the source is rarely the simulation tool itself. It is almost always one of these inputs.
1. Meteorological Data Quality
The meteo dataset is the foundation. A TMY file is a synthetic year that aims to represent average long-term conditions. Most TMY files carry 5 to 10 percent annual GHI uncertainty. Switching from a free PVGIS TMY to a ground-calibrated Solargis P50 dataset can shift modeled yield by 2 to 4 percent.
2. Shading Scene Fidelity
Missing trees, water towers, parapets, and HVAC equipment is the single most common error in C&I models. A model with default flat-terrain assumptions on a site with a five-meter parapet on the south edge can overstate first-row yield by 8 to 15 percent.
For complex sites, professional solar shadow analysis software with LiDAR-grade imagery removes most of the input error. SurgePV’s shadow analysis module integrates directly with the design canvas, so layout changes update shading losses in real time.
3. Default Soiling and Snow Losses
PVsyst defaults to 2 percent soiling, PV*SOL defaults to 1 to 3 percent, HelioScope to 2 percent. Real-world soiling varies from less than 1 percent in clean coastal climates to 8 percent or more in dusty desert and agricultural sites. Snow losses in northern latitudes can add 3 to 5 percent. Calibrating these against measured field data is essential. The soiling loss glossary covers the math and field measurement methods.
4. Module Quality and Mismatch
Default module mismatch losses sit at 1 to 2 percent. For Tier 1 modules with tight binning, that is realistic. For Tier 2 or Tier 3 modules from a single shipping batch with wide bin tolerance, real mismatch can reach 3 to 5 percent. The 2025 kWh Analytics findings on module quality drift are partly explained by this.
5. Inverter Availability
Default inverter availability in most tools is 100 percent (zero downtime). Real-world availability runs 96 to 99 percent depending on inverter generation, climate, and maintenance regime. The 2025 kWh Analytics data tying 40 percent of system downtime to inverters suggests defaults should be loosened by 1 to 2 percent for forecast purposes.
6. Degradation Modeling
Default degradation rates of 0.5 percent per year underestimate real-world performance loss for some Tier 2 module shipments where measured degradation can run 0.8 to 1.2 percent annually. Over a 25-year asset life, that compounds into a 5 to 10 percent gap by year 20. The solar panel degradation rates guide breaks this down by technology and manufacturer tier.
7. AC Side Losses
Transformer losses, line losses, and parasitic losses commonly default to 1 to 2 percent in total. For long DC runs, undersized cables, and oversized transformers, real AC losses can reach 3 to 4 percent. The solar system losses guide covers the full loss chain, from STC nameplate to AC meter.
8. Operational Reality vs Simulation Assumptions
Curtailment, reactive power requirements, frequency response obligations, and grid feeder voltage variation are rarely modeled in default simulations. For projects on constrained feeders, curtailment alone can account for 2 to 5 percent annual yield loss. This is one of the largest contributors to the 8.6 percent kWh Analytics gap.
Performance Ratio: The Field Metric Behind Validation (IEC 61724)
Once a project is operating, the question shifts from forecast accuracy to verification. The performance ratio (PR) defined in IEC 61724-1 is the industry-standard metric for comparing actual production against expected output.
The IEC 61724-1 Performance Ratio Formula
In its simplest form:
PR = (E_AC / P_nameplate) / (H_POA / G_STC)
Where:
- E_AC is the measured AC energy output in kWh over the analysis period
- P_nameplate is the DC nameplate rating in kW at STC
- H_POA is the measured plane-of-array irradiation in kWh/m² over the period
- G_STC is the standard test condition irradiance, 1 kW/m²
The PR is dimensionless and typically expressed as a percentage. A PR of 85 percent means the system delivered 85 percent of the energy it would have produced if every module operated at its STC nameplate rating across the measured irradiance.
Typical PR Benchmarks
| System Type | Typical PR Range | Notes |
|---|---|---|
| Residential rooftop | 75-82% | Higher shading, lower availability |
| Commercial rooftop | 78-85% | Better optimization, lower shading variability |
| Utility-scale ground mount | 80-88% | Best PR achievable with active maintenance |
| Floating PV | 78-85% | Lower module temperature but soiling complications |
| Bifacial trackers (utility) | 82-90% | Highest reported PR for new builds in 2025 |
Weather-Corrected PR
The base PR formula bakes weather variability into the ratio. To compare a single plant across seasons or against another plant in a different climate, the weather-corrected PR adjusts the denominator for actual module temperature, using the module Pmax temperature coefficient (typically negative 0.0035 to negative 0.0045 per degree Celsius for crystalline silicon).
This is the form recommended by NREL and now part of IEC 61724-1 Edition 2 (2021). For detailed methodology, the solar performance ratio guide walks through both the standard and weather-corrected forms with worked examples. The how to calculate solar performance ratio post covers data collection requirements and common measurement pitfalls.
Why PR Matters for Closing the Forecast Loop
The simulated PR appears in every PVsyst, HelioScope, and SAM yield report as a single headline number. After 12 months of operation, the measured PR can be calculated using IEC 61724-1 methodology and compared directly to the simulated value. The gap is the model error.
For a 100 kWp commercial system simulated at PR 84 percent that delivers measured PR 78 percent across the first operating year, the 6-percentage-point gap is the calibration error that should flow back into the next project’s loss assumptions. This is how disciplined EPC organizations close the loop between forecast and reality.
Data collection requirements for IEC 61724-1 Class A monitoring are demanding. The standard calls for ISO 9060 Class A pyranometers with dew and frost mitigation, module temperature sensors accurate to within 2 degrees Celsius, and revenue-grade meters at the AC output. For commercial installations, IEC 61724-1 Class B monitoring is generally sufficient and uses less expensive instrumentation while still producing PR values usable for warranty verification. The choice of monitoring class is set in the engineering procurement contract and flows directly into the asset valuation. Underestimating monitoring requirements early in design often shows up later as inability to validate warranty claims. Also see: Us Residential Solar Market Trends 2026.
Improving Your Own Forecasts: A Practical Workflow
For installers and developers building their own simulation discipline, five practices have outsized impact on prediction quality.
1. Upgrade Meteorological Inputs
Move from free PVGIS TMY to a paid Meteonorm, SolarAnywhere, or Solargis dataset for any project above 500 kW. For utility-scale work, invest in on-site irradiance instrumentation during the development phase. The 2 to 4 percent annual yield accuracy gain typically pays for the data subscription within the first project.
2. Build Full 3D Shading Scenes
Model trees, terrain, adjacent buildings, parapets, and HVAC obstructions. For complex roofs, integrate LiDAR or drone-captured 3D scans. Default flat-terrain assumptions are the single largest source of optimistic yield error in C&I models. SurgePV’s integrated solar design software handles 3D shading natively in the design canvas, so layout iterations update yield instantly.
3. Calibrate Loss Assumptions Against Measured Data
Maintain a library of measured PR data from your operating portfolio. After each project’s first 12 operating months, compare measured PR to simulated PR and update the soiling, snow, availability, and degradation defaults for the next project in the pipeline. This single practice closes more of the forecast gap than any software upgrade.
4. Cross-Validate Across Two Independent Tools
For high-stakes projects, run the design in both HelioScope and PVsyst. If the two agree within 2 percent on annual yield, the model is internally consistent. If they disagree by more than 4 percent, the cause is almost always an input difference: meteo, shading, or loss assumptions.
A worked example from a 2.1 MWp commercial rooftop in southern Spain: HelioScope projected 3,432 MWh/year annual yield. PVsyst projected 3,397 MWh/year using the same Meteonorm Pro dataset, identical module and inverter selections, and matching loss parameters. The 1.0 percent gap was traced to a transposition-model difference (Hay-Davies vs Perez) and was within the expected cross-tool noise floor. When the meteo source was switched to PVGIS TMY in PVsyst alone, the gap widened to 4.7 percent, confirming that the input layer drove the divergence rather than the underlying physics. Also see: Spain net metering.
5. Publish P50 and P90 Together, Not Just P50
For any project headed to financing, present P50 and P90 yield estimates together in the proposal. Lenders will calculate P90 themselves if the developer does not, and the lender’s P90 will be more conservative than the developer’s. Presenting both upfront builds credibility and accelerates the financing decision.
Workflow Checklist
| Step | What to Do | Why |
|---|---|---|
| Pre-design | Pull paid meteo data | 2-4% annual yield accuracy gain |
| Design | Build 3D shading scene | Single largest input error source |
| Modeling | Calibrate losses vs portfolio data | Closes 60-80% of the forecast gap |
| Pre-financing | Cross-check with second tool | Validates internal consistency |
| Proposal | Present P50 and P90 together | Builds lender credibility |
| Year 1 operating | Calculate IEC 61724-1 PR | Feeds back into the next project |
This workflow integrates well with SurgePV’s design and proposal pipeline. The full solar proposal software stack auto-generates P50 and P90 outputs alongside the layout, and the generation and financial tool carries those forecasts into IRR, NPV, and payback modeling.
Closing the Forecast Gap: Action Items
Solar simulation in 2026 is more accurate than it has ever been, yet the field gap between forecast and reality is widening because input discipline has not kept pace with software capability. The tools are not the problem. The inputs are.
- Audit your meteo data sources. If you are still defaulting to PVGIS TMY for projects above 500 kW, upgrade to ground-calibrated data within the next quarter. The accuracy payback is immediate.
- Build a measured PR feedback loop. After every project completes its first operating year, calculate IEC 61724-1 PR and update your loss-assumption library. This is the single highest-impact practice for closing the forecast-to-reality gap.
- Stop quoting P50 alone. Always present P50 and P90 together. If your software does not output P90 natively, the team should be running uncertainty math by hand or upgrading to a tool that does.
For installers benchmarking their own toolchain, the best solar software for simulation roundup compares PVsyst, HelioScope, SAM, and SurgePV across the validation, workflow, and price axes that matter most for production design pipelines. Choosing the right solar software is less about feature lists and more about how well the toolchain handles the input discipline that determines whether forecasts hold up in operation.
Frequently Asked Questions
How accurate are solar simulation software predictions compared to actual production?
Modern tools such as PVsyst, HelioScope, SAM, and PV*SOL typically predict annual energy yield within 1 to 5 percent of measured output when meteorological inputs and loss assumptions are well calibrated. However, the 2025 kWh Analytics Solar Risk Assessment found that US solar systems averaged 8.6 percent below their industry-wide P50 forecasts across 34,000 system-months, a gap driven by optimistic assumptions about soiling, degradation, inverter availability, and curtailment.
Is PVsyst more accurate than HelioScope?
When PVsyst and HelioScope are configured with the same meteorological data and loss assumptions, their annual energy yield outputs agree to within 1 percent, a result independently validated by DNV GL in 2014. The practical difference is workflow rather than raw accuracy. PVsyst remains the bankability gold standard demanded for utility-scale lender reports, while HelioScope is faster for the 100 kW to 5 MW commercial sweet spot.
Why does HelioScope match PVsyst within 1 percent?
HelioScope uses the same single-diode PV cell model and component-level loss math as PVsyst, simulating each module individually so that mismatch and partial shading are modeled accurately. DNV GL ran a side-by-side benchmark in 2014 across multiple project archetypes and confirmed energy estimates fall within 1 percent when project assumptions align. NREL separately validated HelioScope’s 3D shading engine against LiDAR sources, with error ranges between negative 7.0 percent and positive 4.3 percent.
What is the average gap between simulated and real solar output?
The 2025 kWh Analytics Solar Risk Assessment, based on 34,000 system-months between 2015 and 2023, found US PV assets underperform the industry-wide P50 forecast by 8.6 percent on average. The gap has widened from 6.3 percent in the 2016-2019 period, driven by module quality concerns, inverter availability issues, and what kWh Analytics calls a “systemic overestimation bias” from financial incentives that reward optimistic forecasts.
How do P50 and P90 affect solar project financing?
P50 is the median energy yield forecast, the value a project has a 50 percent chance of exceeding in any given year. P90 is the conservative downside estimate, exceeded in 90 percent of years. Lenders size debt against P90 because it represents the financial stress case. Research by kWh Analytics found that roughly 1 in 7 solar projects underperform their P99 value, indicating that uncertainty is often systematically underestimated in commercial yield assessments.
How can installers improve solar simulation accuracy?
Five practices have the largest impact on prediction quality. First, use site-specific meteorological data from Meteonorm, SolarAnywhere, or Solargis rather than nearest-station defaults. Second, build a full 3D shading scene that includes trees, terrain, and nearby buildings. Third, calibrate soiling, snow, and degradation losses against measured field data from comparable installations. Fourth, compare results across two independent tools, for example HelioScope plus PVsyst. Fifth, post-commission, run measured production through IEC 61724-1 performance ratio analysis and update the model assumptions for the next project.


