Quick Answer
A 6 kWp system in Germany might generate 6,500 kWh per year. If the household consumes only 2,000 kWh of that on-site, the other 4,500 kWh exports to the grid at €0.08/kWh. The self-consumed 2,000 kWh displaces grid electricity at €0.35/kWh. The difference — €0.27 per kWh — is what self-consumption rate determines.
Most solar owners track how much their panels produce. The smarter question is how much of that production they actually use.
A 6 kWp system in Germany might generate 6,500 kWh per year. If the household consumes only 2,000 kWh of that on-site, the other 4,500 kWh exports to the grid at €0.08/kWh. The self-consumed 2,000 kWh displaces grid electricity at €0.35/kWh. Also see: Germany solar subsidies. Read more about Community Solar Projects Germany.
A 6 kWp system in Germany might generate 6,500 kWh per year. If the household consumes only 2,000 kWh of that on-site, the other 4,500 kWh exports to the grid at €0.08/kWh. The self-consumed 2,000 kWh displaces grid electricity at €0.35/kWh. The difference — €0.27 per kWh — is what self-consumption rate determines. Every percentage point matters.
This guide explains how to calculate your solar self-consumption rate, what drives it, and how to raise it. You will find the formula, a worked example, country benchmarks, battery impact, load-shifting tactics, and the contrarian case for when high self-consumption is not the goal.
TL;DR — Solar Self-Consumption Rate Calculator
Solar self-consumption rate is the share of your solar production you use directly on-site. Calculate it by dividing self-consumed solar energy by total solar production, then multiply by 100. A typical home without batteries achieves 30–50%. With a battery and smart load shifting, 70–85% is realistic. In markets where retail electricity costs 3–4 times the export price, every 10% increase in self-consumption shortens payback by 1–2 years.
In this guide:
- What solar self-consumption rate is and why it matters
- How to calculate self-consumption rate — formula and worked example
- Load profile matching: when you use versus when panels produce
- Appliances and timing: matching consumption to production
- Battery storage impact on self-consumption
- Smart load management and EV charging timing
- Self-consumption rate by country: Germany, Australia, Italy, US
- Grid export tariff versus self-consumption economics
- How to increase self-consumption: 10 practical strategies
- Commercial versus residential self-consumption differences
- When high self-consumption is not the goal Also see: solar panel ROI in Italy.
What Is Solar Self-Consumption Rate and Why It Matters
Solar self-consumption rate is the percentage of your solar panel production that you use directly on your property. The rest exports to the grid.
The concept is simple. The economics are not.
In most markets, the price you pay for grid electricity is 2–4 times what you earn for exported solar. In Germany, retail rates run €0.32–€0.38/kWh while export tariffs pay €0.08–€0.09/kWh. In Australia, retail rates are A$0.28–$0.38/kWh while feed-in tariffs pay A$0.05–$0.12/kWh. In Italy, the gap is €0.27–€0.35/kWh retail against €0.08–€0.13/kWh export. For the latest details on Italy, see Commercial Rooftop Solar Case Study Italy. For Australia-specific compliance details, see Australia comparisons/lgc-vs-stc.
This gap makes self-consumption the single most powerful lever in solar ROI.
| Market | Retail Rate | Export Tariff | Value Gap per kWh |
|---|---|---|---|
| Germany | €0.32–€0.38/kWh | €0.08–€0.09/kWh | €0.24–€0.30/kWh |
| Australia | A$0.28–$0.38/kWh | A$0.05–$0.12/kWh | A$0.16–$0.33/kWh |
| Italy | €0.27–€0.35/kWh | €0.08–€0.13/kWh | €0.16–€0.27/kWh |
| United States | $0.12–$0.28/kWh | Varies by state | $0.00–$0.20/kWh |
| UK | £0.30–£0.36/kWh | £0.03–£0.15/kWh | £0.15–£0.33/kWh |
Retail rates are blended residential averages. Export tariffs reflect 2026 typical values. US varies widely by state and utility — California NEM 3.0 export rates are roughly $0.05–$0.08/kWh, while Texas variable rates can exceed $0.20/kWh during peak events.
A kWh consumed on-site replaces grid electricity at the full retail rate. A kWh exported earns only the export tariff. The difference is what self-consumption captures.
The Financial Impact of Self-Consumption
Consider a 6 kWp system in Germany producing 6,500 kWh per year:
| Self-Consumption Rate | On-Site Use | Export | Annual Value (Retail + Export) | 25-Year NPV @ 4% |
|---|---|---|---|---|
| 30% | 1,950 kWh | 4,550 kWh | €1,030 | €13,200 |
| 50% | 3,250 kWh | 3,250 kWh | €1,300 | €16,700 |
| 70% | 4,550 kWh | 1,950 kWh | €1,570 | €20,200 |
| 85% (with battery) | 5,525 kWh | 975 kWh | €1,770 | €22,800 |
Assumptions: retail €0.35/kWh, export €0.085/kWh, 0.6% annual panel degradation, 2% annual electricity price escalation. NPV calculated over 25 years at 4% discount rate.
The difference between 30% and 70% self-consumption is €540 per year. Over 25 years, that gap compounds to roughly €7,000 in present value. This is why solar design software that models hourly self-consumption — not just annual production — produces more accurate ROI projections.
What Most People Get Wrong
Most homeowners size their system based on annual production matching annual consumption. This is a mistake. A 6 kWp system producing 6,500 kWh and a household consuming 6,500 kWh does not mean 100% self-consumption. Solar peaks at midday. Household consumption peaks in morning and evening. The overlap — the self-consumption rate — is what determines value, not the annual totals.
How to Calculate Self-Consumption Rate
The formula for solar self-consumption rate is straightforward. Getting accurate inputs requires more care.
The Formula
Self-Consumption Rate (%) = (Solar Energy Used On-Site / Total Solar Production) x 100Where:
- Solar Energy Used On-Site = Total solar production minus exported solar energy
- Total Solar Production = All energy generated by the solar panels (measured at the inverter output)
An alternative formulation using consumption data:
Self-Consumption Rate (%) = (Total Solar Production - Exported Energy) / Total Solar Production x 100Worked Example: The Mueller Household
The Mueller family in Munich installed a 6.5 kWp system in 2024. Here is their 2025 data:
| Metric | Value |
|---|---|
| Total solar production | 6,760 kWh |
| Energy exported to grid | 3,650 kWh |
| Energy imported from grid | 2,840 kWh |
| Total household consumption | 5,950 kWh |
Step 1: Calculate self-consumed solar energy
Self-consumed solar = Total production - Exported energy Self-consumed solar = 6,760 kWh - 3,650 kWh = 3,110 kWh
Step 2: Calculate self-consumption rate
Self-consumption rate = (3,110 / 6,760) x 100 = 46.0%
Step 3: Calculate self-sufficiency rate (for context)
Self-sufficiency = Self-consumed solar / Total household consumption Self-sufficiency = 3,110 / 5,950 = 52.3%
The Mueller household uses 46% of its solar production directly. It meets 52% of its total electricity needs from solar. The remaining 48% comes from grid imports.
Hourly Calculation for Accuracy
Annual totals hide important patterns. A more accurate method uses hourly or 15-minute interval data:
For each time interval:
  Self-consumed = MIN(Solar Production, On-Site Consumption)
  Exported = Solar Production - Self-consumed
  Imported = On-Site Consumption - Self-consumed

Annual Self-Consumption Rate = SUM(Self-consumed) / SUM(Solar Production) x 100
This interval-based method matters because solar production and consumption rarely align. At 12:00 on a sunny June day, the Mueller system might produce 5.2 kW while the house consumes only 0.8 kW. The 4.4 kW surplus exports. At 19:00, consumption rises to 2.1 kW while solar output has dropped to 0.3 kW. The 1.8 kW deficit imports from the grid.
Professional solar design software runs this hourly simulation using typical meteorological year data and standard load profiles. The result is a far more accurate self-consumption estimate than annual averaging.
Load Profile Matching: When You Use vs. When Panels Produce
Solar production follows a predictable curve. It starts near zero at sunrise, peaks around solar noon, and falls to zero at sunset. The shape is roughly a bell curve.
Household consumption follows a different pattern. Most homes have two peaks: a morning peak as residents wake up, and an evening peak as they return from work. The midday period — when solar production is highest — is often the lowest consumption period.
The Mismatch Problem
| Time | Typical Solar Output (6 kWp, June) | Typical Household Load | Result |
|---|---|---|---|
| 06:00 | 0.3 kW | 1.2 kW | Import 0.9 kW |
| 08:00 | 1.8 kW | 2.5 kW | Import 0.7 kW |
| 10:00 | 4.2 kW | 0.6 kW | Export 3.6 kW |
| 12:00 | 5.5 kW | 0.8 kW | Export 4.7 kW |
| 14:00 | 4.8 kW | 0.7 kW | Export 4.1 kW |
| 16:00 | 2.5 kW | 1.5 kW | Export 1.0 kW |
| 18:00 | 0.9 kW | 2.8 kW | Import 1.9 kW |
| 20:00 | 0.1 kW | 2.2 kW | Import 2.1 kW |
| 22:00 | 0 kW | 1.0 kW | Import 1.0 kW |
June weekday profile for a working household in central Europe. Solar output assumes south-facing 30° tilt, clear day. Household load assumes two working adults, no home office, no EV charging. Also see: European Solar Incentives. For Europe-specific compliance details, see Europe solar compliance.
On this typical day, the household exports solar for six hours and imports grid electricity for the other eighteen. The midday export window is where self-consumption is lost.
Seasonal Variation
The mismatch is worse in summer and better in winter — but for different reasons.
Summer: Long sunny days produce abundant solar, but households with air conditioning may see higher midday consumption. The net effect varies by climate. In Mediterranean climates, summer self-consumption can be higher than winter because air conditioning demand overlaps with peak solar hours.
Winter: Shorter days reduce total production, but heating demand — particularly from heat pumps — can increase daytime consumption. In northern Europe, winter self-consumption rates sometimes exceed summer rates because the absolute production is lower and heating load is higher during daylight hours.
| Season | Daily Production (6 kWp, Munich) | Typical Self-Consumption Rate |
|---|---|---|
| January | 6–10 kWh | 55–70% |
| April | 22–30 kWh | 35–50% |
| July | 28–36 kWh | 30–45% |
| October | 12–18 kWh | 45–60% |
Without battery storage. With battery, seasonal variation flattens significantly. For more on this topic, see Adding Battery Storage Services.
Appliances and Timing: Matching Consumption to Production
The simplest way to raise self-consumption without buying a battery is to run high-consumption appliances when solar output is highest.
Best Appliances to Shift to Solar Hours
| Appliance | Typical Consumption | Best Solar Window | Self-Consumption Impact |
|---|---|---|---|
| Electric vehicle charger | 7–22 kWh per session | 10:00–14:00 | +15–30% rate increase |
| Heat pump water heater | 2–4 kWh per cycle | 11:00–14:00 | +8–15% rate increase |
| Washing machine | 0.5–2.0 kWh per cycle | 10:00–13:00 | +3–8% rate increase |
| Dishwasher | 1.0–2.0 kWh per cycle | 11:00–14:00 | +3–7% rate increase |
| Pool pump | 1.0–3.0 kWh per day | 09:00–15:00 | +5–12% rate increase |
| Air conditioning (pre-cool) | 3–8 kWh per day | 10:00–14:00 | +5–15% rate increase |
| Tumble dryer | 2.0–4.0 kWh per cycle | 11:00–14:00 | +4–10% rate increase |
| Underfloor heating (electric) | 5–15 kWh per day | 09:00–15:00 | +10–20% rate increase |
Impact estimates assume a 5–8 kWp residential system with typical working-household load profile. Actual impact varies by household size, appliance efficiency, and climate.
Smart Scheduling Strategies
Delay-start timers. Most modern washing machines, dishwashers, and dryers have delay-start functions. Set them to run at 11:00 instead of 07:00. The appliance consumes solar energy instead of grid energy. No cost. No battery.
EV charging timers. Program your EV charger to start at 10:00 and stop at 14:00 on weekdays. A 7 kW charger running for four hours consumes 28 kWh — potentially your entire daily solar production. This single change can raise household self-consumption by 15–30 percentage points.
Heat pump water heater scheduling. Most heat pump water heaters have programmable timers. Set them to heat water between 11:00 and 14:00. The stored hot water lasts through evening demand. This shifts 2–4 kWh into solar hours daily.
Air conditioning pre-cooling. In summer, cool your home to 22°C by 14:00 while solar output is high. Let the temperature drift to 25°C by evening. The thermal mass of your building stores the cooling. This shifts 3–8 kWh of cooling load into solar hours.
Pro Tip — The 10-to-3 Rule
Run your biggest flexible loads between 10:00 and 15:00. This is when solar output is highest in most latitudes. A household that shifts just three loads — EV charging, washing machine, and dishwasher — into this window can raise self-consumption from 35% to 55% without spending money on batteries or smart home systems.
Battery Storage Impact on Self-Consumption
Battery storage is the most effective tool for increasing solar self-consumption. It stores midday surplus for use in the evening when solar production has stopped.
How Batteries Raise Self-Consumption
Without a battery, solar surplus exports to the grid immediately. With a battery, that surplus charges the battery first. The battery then discharges in the evening to power the home.
| Scenario | Self-Consumption Rate | Annual Grid Import | Annual Export |
|---|---|---|---|
| No battery, no load shifting | 35% | 4,200 kWh | 4,400 kWh |
| Load shifting only | 50% | 3,200 kWh | 3,250 kWh |
| 5 kWh battery | 65% | 2,400 kWh | 2,100 kWh |
| 10 kWh battery | 78% | 1,600 kWh | 1,200 kWh |
| 10 kWh battery + load shifting | 85% | 1,200 kWh | 800 kWh |
Based on a 6 kWp system producing 6,500 kWh/year and a household consuming 5,800 kWh/year in Germany. Assumes south-facing system, 30° tilt, LFP battery with 90% round-trip efficiency.
Battery Sizing for Self-Consumption
The right battery size depends on your surplus, not your total consumption.
Step 1: Estimate daily solar surplus. A 6 kWp system in Germany produces 6,500 kWh/year — roughly 18 kWh/day averaged. With 40% self-consumption without a battery, daily surplus is 18 x 0.60 = 10.8 kWh.
Step 2: Estimate evening consumption. The typical household consumes 60–70% of its daily electricity outside solar hours. For a 5,800 kWh/year household, that is 9.5–11.2 kWh per evening.
Step 3: Size the battery to the smaller of surplus or evening need. In this case, the 10.8 kWh surplus and 10.5 kWh evening need are well matched. A 10 kWh battery (usable capacity ~9 kWh after depth-of-discharge limits) captures most of the available self-consumption gain. Also see: Us Residential Solar Market Trends 2026.
Oversizing the battery beyond this match yields diminishing returns. A 15 kWh battery in this scenario might raise self-consumption from 78% to 82% — a marginal 4% gain for 50% more battery cost.
Battery Economics by Market
| Market | Battery Cost (10 kWh LFP) | Retail-Export Gap | Battery Payback | Self-Consumption Gain |
|---|---|---|---|---|
| Germany | €4,500–€6,500 | €0.27/kWh | 8–12 years | +30–40% |
| Australia | A$8,000–$12,000 | A$0.20/kWh | 10–14 years | +25–35% |
| Italy | €5,000–€7,500 | €0.22/kWh | 9–13 years | +30–40% |
| UK | £5,000–£7,000 | £0.22/kWh | 10–14 years | +30–40% |
| US (California NEM 3.0) | $10,000–$15,000 | $0.25/kWh | 7–10 years | +30–40% |
Battery payback calculated on incremental cost and incremental savings only. In many markets, batteries also qualify for tax incentives or rebates that improve payback. US federal ITC (30% through 2032) significantly improves US battery economics.
 For a direct comparison, see Arka 360 vs SurgePV.
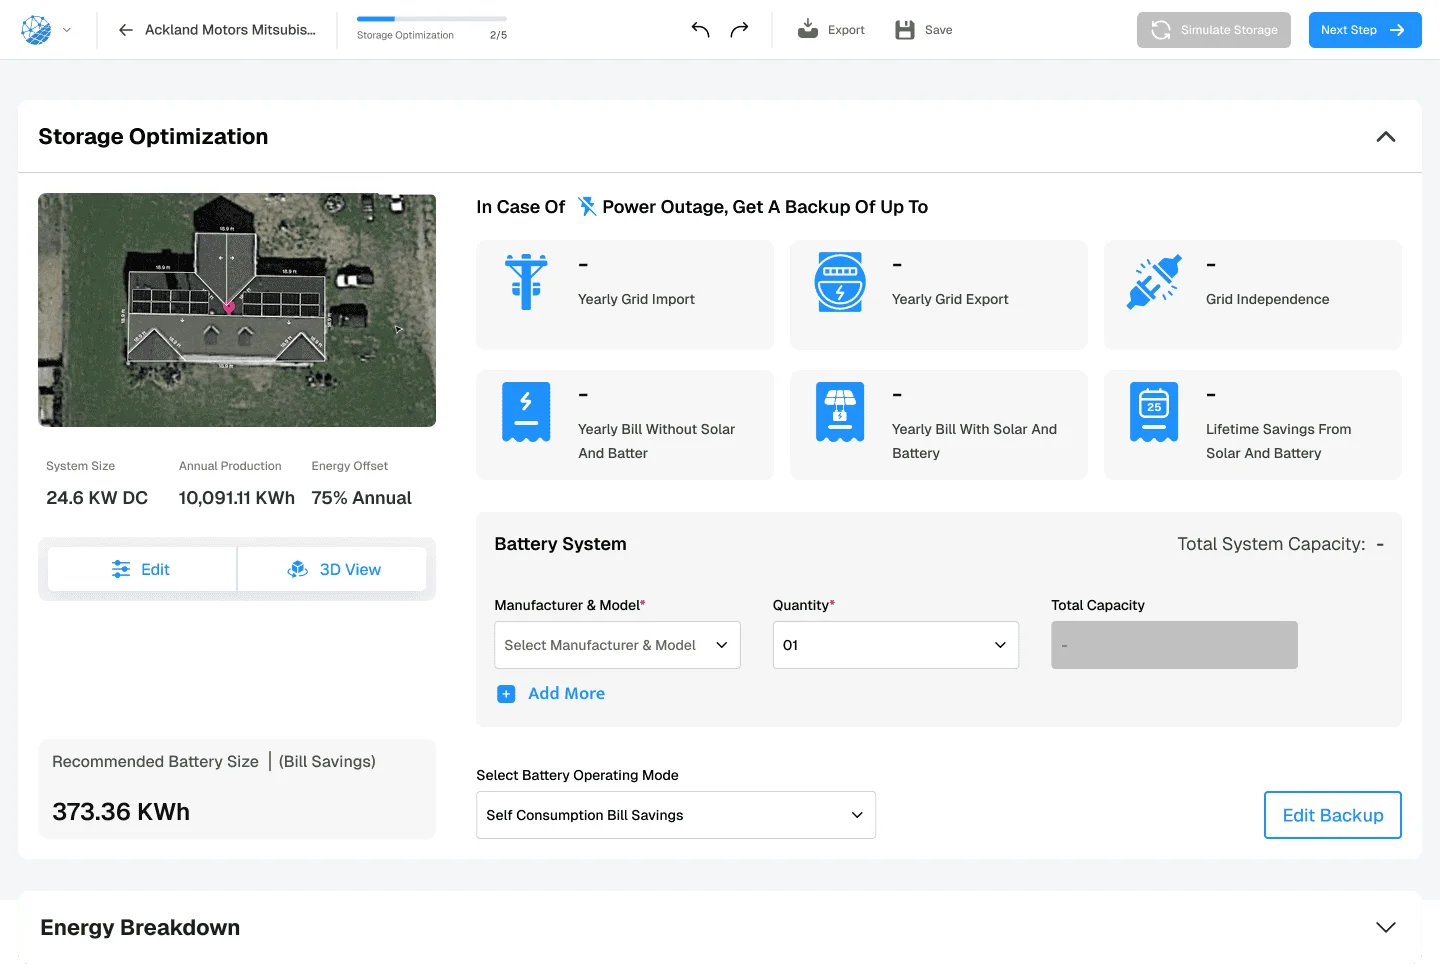
SurgePV’s storage optimization module models self-consumption scenarios with and without battery storage. The interface shows bill savings breakdown by self-consumed solar, exported energy, and grid imports.
Smart Load Management and EV Charging Timing
Beyond simple timer delays, smart load management systems automate the matching of consumption to solar production. These systems monitor real-time solar output and trigger connected appliances when surplus is available.
Types of Smart Load Management
Solar diverters. Devices like the myenergi eddi or SolarEdge Smart Energy Relay monitor solar production and home consumption. When surplus exceeds a threshold, they redirect power to a designated load — typically an immersion heater for hot water. This is a cost-effective way to absorb 2–4 kWh of daily surplus without a battery.
Smart EV chargers. Chargers like the Zappi, Wallbox Pulsar Plus, or Tesla Wall Connector can modulate charging power based on real-time solar surplus. Instead of charging at a fixed 7 kW, they scale down to match available solar — or charge at full power from grid and solar combined, prioritizing solar when available.
Home energy management systems (HEMS). Systems like the SMA Sunny Home Manager, Fronius Solar.web, or third-party platforms like Solar Analytics aggregate data from the inverter, smart meter, and connected appliances. They optimize multiple loads simultaneously — EV, heat pump, dishwasher — against real-time solar production and time-of-use tariffs.
EV Charging: The Biggest Self-Consumption Lever
Electric vehicles represent the largest flexible load in most homes. A typical EV consumes 15–25 kWh per 100 km. A commuter driving 50 km daily uses 7.5–12.5 kWh per day.
If that charging happens at night, it is 100% grid electricity. If it happens during solar hours, it can be 80–100% solar.
| EV Charging Strategy | Daily Consumption | Solar Share | Grid Share |
|---|---|---|---|
| Overnight charging (22:00–06:00) | 10 kWh | 0% | 100% |
| Dumb daytime charging (plug in at 08:00) | 10 kWh | 30–50% | 50–70% |
| Smart solar charging (10:00–15:00) | 10 kWh | 70–90% | 10–30% |
| Workplace solar charging | 10 kWh | 80–100% | 0–20% |
Smart solar charging assumes a 6–8 kWp system with surplus monitoring. Actual solar share depends on driving pattern, system size, and weather.
Workplace charging is often overlooked. An employee who charges at a solar-powered workplace during the day achieves near-100% solar mobility without any home system. For employers, offering solar EV charging is a tangible sustainability benefit with measurable carbon impact.
Opinion: Smart Load Management Beats Oversized Batteries
Most homeowners buy a battery before optimizing their loads. This is backwards. A €300 smart plug and timer setup that shifts your washing machine, dishwasher, and pool pump into solar hours can raise self-consumption by 15–20 percentage points. A €5,000 battery raises it by 30–40 points. The smart load approach delivers 40–50% of the battery’s benefit at 6% of the cost. Do the cheap stuff first.
Self-Consumption Rate by Country
Self-consumption rates vary by country due to differences in solar resource, household consumption patterns, electricity prices, and policy frameworks.
Germany
Germany has some of Europe’s highest electricity prices and lowest solar irradiance. The retail-export gap is large, making self-consumption critical.
| System Type | Typical Self-Consumption | With Battery |
|---|---|---|
| Residential (3–4 people, working) | 30–40% | 60–75% |
| Residential (family, one parent home) | 40–55% | 70–80% |
| Home office / remote worker | 45–60% | 75–85% |
| Small commercial (daytime ops) | 60–80% | 80–90% |
Source: Bundesverband Solarwirtschaft (BSW) market data, Fraunhofer ISE monitoring studies.
Germany’s EEG feed-in tariff for new systems is approximately €0.082/kWh. Retail rates average €0.35/kWh. The €0.27/kWh gap is among the widest in Europe. German households have strong incentive to maximize self-consumption.
Australia
Australia has high solar irradiance and a complex tariff landscape. Feed-in tariffs vary by state and retailer, ranging from A$0.05 to $0.12/kWh. Retail rates range from A$0.28 to $0.38/kWh.
| State | Typical FiT | Retail Rate | Typical Self-Consumption (No Battery) |
|---|---|---|---|
| Queensland | A$0.06–$0.12/kWh | A$0.28–$0.32/kWh | 35–45% |
| New South Wales | A$0.05–$0.12/kWh | A$0.30–$0.36/kWh | 30–40% |
| Victoria | A$0.05–$0.10/kWh | A$0.28–$0.34/kWh | 35–45% |
| South Australia | A$0.05–$0.15/kWh | A$0.35–$0.42/kWh | 30–40% |
| Western Australia | A$0.02–$0.10/kWh | A$0.28–$0.32/kWh | 35–50% |
Source: Australian Energy Regulator (AER), Solar Analytics national data.
Australian households have higher self-consumption potential than German households because solar production is higher relative to consumption. A 6.6 kW system in Brisbane produces 9,500–10,500 kWh/year — 40–50% more than an equivalent German system. However, Australian households also use more air conditioning, which can increase midday consumption.
Italy
Italy combines high retail electricity prices with strong southern solar resource. The self-consumption economics are favorable.
| Region | Solar Yield (6 kWp) | Typical Self-Consumption (No Battery) | With Battery |
|---|---|---|---|
| Northern Italy (Milan) | 6,500–7,200 kWh | 35–45% | 65–75% |
| Central Italy (Rome) | 8,000–8,800 kWh | 30–40% | 60–70% |
| Southern Italy (Bari) | 9,000–10,000 kWh | 25–35% | 55–70% |
Source: GSE operator data, Terna grid statistics.
Southern Italian systems produce more but self-consume less because the surplus is larger relative to household consumption. This makes batteries particularly valuable in the south — there is more surplus to store.
Italy’s Scambio sul Posto net metering system caps compensation at the amount of energy imported. A household that exports 4,000 kWh but imports only 2,500 kWh receives SSP credit on only 2,500 kWh. This structure makes high self-consumption essential for good returns.
United States
US self-consumption economics vary dramatically by state due to different net metering policies.
| State / Policy | Net Metering | Export Credit | Self-Consumption Priority |
|---|---|---|---|
| California (NEM 3.0) | Reduced | ~$0.05–$0.08/kWh | Very high |
| New York | Full | 1:1 retail credit | Low |
| Texas (variable) | None | Wholesale market rate | Very high |
| Florida | Full | 1:1 retail credit | Low |
| Hawaii (NEM closed) | None | ~$0.10–$0.15/kWh | Very high |
| Massachusetts | Full | 1:1 retail credit | Low |
Source: DSIRE database, state PUC filings. “Full” net metering means 1:1 credit at retail rate. “Reduced” means lower export compensation.
In states with full net metering, self-consumption rate matters less because exported energy earns a full retail credit. In California under NEM 3.0, export rates are slashed to roughly $0.05–$0.08/kWh while retail rates exceed $0.30/kWh. This has made self-consumption and battery storage critical to California solar economics.
Key Takeaway — Policy Drives Self-Consumption Priority
In markets with full net metering, the financial difference between self-consumption and export is small. In markets with reduced or eliminated net metering, self-consumption becomes the dominant factor in solar ROI. California’s NEM 3.0 transition in 2023 transformed self-consumption from a nice-to-have into a must-have for residential solar economics.
Grid Export Tariff vs. Self-Consumption Economics
The decision between maximizing self-consumption and accepting grid export depends on the gap between what you pay for grid electricity and what you earn for exports.
When Export Is Almost as Good as Self-Consumption
In markets with full net metering, the economics of self-consumption versus export are nearly identical:
| Scenario | Export Value | Self-Consumption Value | Difference |
|---|---|---|---|
| Full net metering (1:1 credit) | $0.28/kWh credit | $0.28/kWh avoided | $0.00/kWh |
| Reduced net metering (75% credit) | $0.21/kWh credit | $0.28/kWh avoided | $0.07/kWh |
| No net metering, low FiT | $0.05/kWh cash | $0.28/kWh avoided | $0.23/kWh |
Where the difference is zero, self-consumption rate has no financial impact. Where the difference is $0.23/kWh, every percentage point of self-consumption matters.
The Self-Consumption Investment Threshold
At what point does investing in batteries or smart load systems to raise self-consumption make financial sense?
A simple rule: divide the battery or smart system cost by the annual value of the self-consumption gain. If the result is under 12–15 years, the investment is generally worthwhile.
Example: A €5,000 battery raises self-consumption from 40% to 75% on a 6 kWp German system. The gain is 35% of 6,500 kWh = 2,275 kWh/year. At €0.27/kWh value gap, annual savings are €614. Payback = €5,000 / €614 = 8.1 years. This is a sound investment.
Counter-example: The same battery in a market with full net metering and a €0.05/kWh value gap produces only €114/year in incremental value. Payback = 44 years. Not worthwhile.
How to Increase Solar Self-Consumption: 10 Practical Strategies
Here are ten strategies to raise your solar self-consumption rate, ordered from lowest to highest cost.
1. Shift Appliance Use to Solar Hours (Free)
Run your washing machine, dishwasher, dryer, and pool pump between 10:00 and 15:00. Use delay-start timers. Potential gain: +10–20 percentage points.
2. Pre-Heat and Pre-Cool Your Home (Free)
Set your thermostat to heat or cool the building during solar peak hours. Let the thermal mass carry the temperature through evening. Potential gain: +5–15 points.
3. Install a Solar Diverter for Water Heating (€200–€500)
A solar diverter sends surplus solar to an immersion heater instead of the grid. Stores energy as hot water — cheaper than a battery. Potential gain: +8–15 points.
4. Charge Your EV During Solar Hours (Free with smart charger)
Program your EV charger for 10:00–14:00 on weekdays. If you work from home, this is the single biggest lever. Potential gain: +15–30 points.
5. Add a Smart Home Energy Monitor (€100–€300)
Devices like Solar Analytics, Sense, or manufacturer-specific monitors show real-time solar surplus. Visibility alone often changes behavior. Potential gain: +5–10 points.
6. Install a Small Battery (5–7 kWh) (€3,000–€5,000)
A 5–7 kWh battery captures midday surplus for evening use. Good entry point for battery economics. Potential gain: +20–30 points.
7. Install a Larger Battery (10–15 kWh) (€5,000–€9,000)
A 10 kWh battery captures most daily surplus for typical households. The sweet spot for many homes. Potential gain: +30–45 points.
8. Add a Heat Pump Water Heater with Timer (€1,500–€3,000)
Replace a resistive electric or gas water heater with a heat pump unit. Program it to run during solar hours. Potential gain: +10–20 points.
9. Install a Smart Home Energy Management System (€500–€2,000)
A HEMS automates load shifting across multiple appliances. It monitors solar output and triggers loads when surplus is available. Potential gain: +10–20 points (on top of other measures).
10. Right-Size Your Solar System (Design-stage decision)
An oversized system produces more surplus than you can use or store. A system sized to your consumption profile — not your roof area — achieves higher self-consumption. Solar design software that models hourly self-consumption prevents over-sizing.
| Strategy | Cost | Effort | Typical Gain |
|---|---|---|---|
| Shift appliance timing | Free | Low | +10–20% |
| Pre-heat/pre-cool | Free | Low | +5–15% |
| Solar diverter | €200–€500 | Medium | +8–15% |
| EV solar charging | Free–€500 | Low | +15–30% |
| Energy monitor | €100–€300 | Low | +5–10% |
| 5–7 kWh battery | €3,000–€5,000 | High | +20–30% |
| 10–15 kWh battery | €5,000–€9,000 | High | +30–45% |
| Heat pump water heater | €1,500–€3,000 | High | +10–20% |
| Smart HEMS | €500–€2,000 | Medium | +10–20% |
| Right-size system | Design-stage | Medium | +5–15% |
Commercial vs. Residential Self-Consumption
Commercial buildings typically achieve higher self-consumption rates than residential buildings. The reason is simple: commercial load profiles align better with solar production curves.
Why Commercial Self-Consumption Is Higher
| Factor | Residential | Commercial |
|---|---|---|
| Peak consumption time | Morning and evening | Daytime (09:00–17:00) |
| Overlap with solar peak | Poor | Good |
| Typical self-consumption (no battery) | 30–50% | 60–90% |
| Battery economics | Often marginal | Usually favorable |
| Load flexibility | Limited | Higher |
A factory, warehouse, or office building consumes electricity during the same hours that solar panels produce it. Air conditioning, machinery, lighting, and server loads run during business hours. This natural alignment means many commercial systems achieve 70–90% self-consumption without any battery storage.
Commercial Battery Sizing
Commercial batteries are sized differently than residential batteries. The goal is often peak shaving — reducing maximum demand charges — rather than self-consumption alone.
| Commercial Scenario | Battery Size | Primary Benefit | Self-Consumption Gain |
|---|---|---|---|
| Small office (50 kWp) | 20–30 kWh | Self-consumption + peak shave | +15–25% |
| Retail store (100 kWp) | 50–100 kWh | Peak demand reduction | +10–20% |
| Factory (500 kWp) | 200–500 kWh | Peak shaving + backup | +10–15% |
| Warehouse with EV fleet | 100–300 kWh | EV charging + self-consumption | +20–30% |
For commercial solar projects, the generation and financial tool models both self-consumption and demand charge savings to find the optimal battery size.
When High Self-Consumption Is Not the Goal
Here is the contrarian take: maximizing self-consumption is not always optimal.
Scenario 1: Generous Feed-In Tariffs
Some markets offer feed-in tariffs that approach or exceed retail rates. In these markets, exporting surplus is nearly as valuable as self-consuming it. Portugal’s historic feed-in tariffs, some UK legacy tariffs, and certain Australian premium feed-in schemes made export economically attractive. For UK-specific information, see Battery Solar System Design UK.
Scenario 2: Oversized Systems for Export Revenue
In markets with favorable export terms, some investors deliberately oversize systems to maximize export revenue. A 20 kWp system on a household that only consumes 5,000 kWh/year might export 75% of production — but if the feed-in tariff is high enough, the total return can exceed a smaller, high-self-consumption system.
Scenario 3: The Last 10% Problem
Chasing self-consumption from 80% to 90% often requires disproportionate investment. The final 10% of self-consumption might require:
- A second battery (€5,000+) to cover winter shortfalls
- A smart HEMS (€1,500+) to capture marginal surplus
- Major appliance upgrades (heat pumps, induction cooking)
The cost per percentage point rises sharply at high self-consumption rates. A household at 75% self-consumption with a 10 kWh battery might spend €6,000 more to reach 85% — a gain worth €150/year at current German rates. That is a 40-year payback.
Scenario 4: Grid Services and Virtual Power Plants
Some battery systems participate in virtual power plants (VPPs) or grid services programs. In these programs, the battery discharges to the grid during peak demand events — earning payments that can exceed the value of self-consumption. Tesla’s VPP in Australia, Sonnen’s community in Germany, and various US utility programs pay households for grid-supporting battery dispatch. In these cases, holding battery capacity for grid events rather than self-consumption can be more profitable. For more on this topic, see Solar Battery Sizing Guide.
Opinion: Self-Consumption Is a Means, Not an End
The solar industry has fetishized self-consumption rate as a score to maximize. It is not. Self-consumption is a tool for maximizing total system value. In some markets and configurations, a lower self-consumption rate with higher total production delivers better returns. Size the system to the economics, not to the metric.
Real-World Case: The Chen Family Optimizes Self-Consumption
The Chen family in Sydney, Australia, installed a 6.6 kW system in 2023. Their first-year self-consumption rate was 32%. Here is how they raised it to 78% over 18 months.
Starting point (Year 1):
| Metric | Value |
|---|---|
| System size | 6.6 kW |
| Annual production | 9,800 kWh |
| Annual consumption | 7,200 kWh |
| Self-consumption rate | 32% (3,136 kWh) |
| Export | 6,664 kWh |
| Grid import | 4,064 kWh |
| Annual solar value | A$2,180 |
Problem: Both parents worked in an office. The house sat empty from 08:00 to 18:00 on weekdays. Solar production peaked during empty hours.
Month 1–3: Free load shifting.
- Programmed washing machine and dishwasher delay-start for 11:00
- Set pool pump timer for 10:00–14:00
- Pre-cooled house with air conditioning on summer weekdays
Result: Self-consumption rose from 32% to 44%.
Month 4–6: Smart EV charging.
- Installed a smart EV charger with solar surplus monitoring
- Programmed charging for 10:00–15:00 on weekdays
- The EV used 10 kWh/day on average
Result: Self-consumption rose from 44% to 61%.
Month 7–12: Solar diverter.
- Installed a solar diverter for the electric water heater
- Cost: A$450 installed
- Captured 3.2 kWh/day of surplus as hot water
Result: Self-consumption rose from 61% to 68%.
Month 13–18: 10 kWh battery.
- Added a 10 kWh LFP battery
- Cost: A$8,500 after rebate
- Stored midday surplus for evening use
Result: Self-consumption rose from 68% to 78%.
Final result:
| Metric | Before | After | Change |
|---|---|---|---|
| Self-consumption rate | 32% | 78% | +46 points |
| Annual solar value | A$2,180 | A$3,420 | +A$1,240 |
| Grid import | 4,064 kWh | 1,200 kWh | -70% |
| Annual electricity bill | A$1,680 | A$420 | -75% |
Total investment: A$8,950 (smart charger A$800 + diverter A$450 + battery A$8,500 - sold old charger A$800). Annual savings increase: A$1,240 + A$1,260 bill reduction = A$2,500/year total value. Simple payback: 3.6 years.
The Chen family did not do everything at once. They started with free load shifting, then added low-cost measures, then invested in the battery once the economics were clear. This staged approach is the most practical path for most households.
Model Self-Consumption Scenarios in Your Solar Designs
SurgePV’s generation and financial tool calculates self-consumption rates for any system size, load profile, and battery configuration. Model hourly production against consumption, test battery sizing options, and show clients accurate bill savings — not just production estimates.
Book a DemoNo commitment required · 20 minutes · Live project walkthrough
Conclusion
Solar self-consumption rate is the gap between how much your panels produce and how much of that production you actually use. In markets where retail electricity costs 2–4 times the export tariff, this gap determines whether your solar investment pays back in 5 years or 10.
The formula is simple: divide self-consumed solar by total production, multiply by 100. The practice is more nuanced. It requires understanding your load profile, shifting flexible consumption into solar hours, and — in most cases — adding battery storage to capture midday surplus for evening use.
A typical household can raise self-consumption from 35% to 55% through free load shifting alone. Adding a solar diverter and smart EV charging pushes it to 65%. A 10 kWh battery takes it to 75–85%. The staged approach — cheap measures first, then batteries — delivers the best return on investment.
But self-consumption is not the only metric that matters. In markets with generous net metering or favorable feed-in tariffs, a lower self-consumption rate with higher total production can deliver better economics. The goal is maximizing total system value, not self-consumption for its own sake.
For solar professionals designing systems for clients, modeling hourly self-consumption — not just annual production — is essential for accurate ROI projections. Solar design software that integrates load profiles, battery sizing, and tariff structures produces proposals clients can trust.
Three actions to take now:
- Calculate your current self-consumption rate using your inverter data and smart meter exports. Know your baseline before making changes.
- Shift three flexible loads — washing machine, dishwasher, and one other — to run between 10:00 and 15:00. This costs nothing and can raise self-consumption by 10–20 points.
- Model battery economics for your specific system size and tariff structure. Battery payback varies dramatically by market. Do not assume they are — or are not — worthwhile without running the numbers.
Frequently Asked Questions
What is a solar self-consumption rate calculator?
A solar self-consumption rate calculator is a tool that measures the percentage of solar energy a household or business uses directly on-site instead of exporting to the grid. It compares your solar production profile against your electricity consumption profile, typically in hourly or 15-minute intervals, to find the overlap. Most residential systems without batteries achieve 30–50% self-consumption. With batteries and smart load management, this can rise to 70–85%.
How do you calculate solar self-consumption rate?
Solar self-consumption rate equals self-consumed solar energy divided by total solar production, multiplied by 100. The formula is: Self-Consumption Rate (%) = (Solar Energy Used On-Site / Total Solar Production) x 100. For example, if your 6 kWp system produces 8,000 kWh in a year and you use 4,000 kWh of that directly, your self-consumption rate is 50%. The remaining 4,000 kWh exports to the grid.
What is a good solar self-consumption rate?
A good solar self-consumption rate depends on your local electricity price and export tariff. Without a battery, 40–60% is typical for residential systems. With a battery and smart load shifting, 70–85% is achievable. In markets where retail electricity costs 3–4 times the export price — such as Germany, Italy, and Australia — every 10% increase in self-consumption can shorten payback by 1–2 years. Commercial buildings with daytime operations often reach 70–90% without batteries.
Does battery storage increase solar self-consumption?
Yes. Battery storage is the single most effective way to increase solar self-consumption. A typical 7–10 kWh lithium battery can raise self-consumption from 35–45% to 65–80% for a residential system. The battery stores midday solar surplus that would otherwise export to the grid, then discharges that stored energy during evening peak hours when solar production has stopped. The economics depend on the gap between your retail electricity price and your export tariff. Where that gap exceeds €0.15/kWh, battery payback typically runs 7–12 years.
How can I increase my solar self-consumption without a battery?
You can increase solar self-consumption without a battery by shifting appliance use to solar production hours. Run your washing machine, dishwasher, and pool pump between 10:00 and 15:00. Pre-cool or pre-heat your home during midday. Charge electric vehicles at work or home during solar peak. Use smart plugs and timers to automate this shifting. A typical household can raise self-consumption from 35% to 55% through load shifting alone.
What is the difference between self-consumption and self-sufficiency?
Self-consumption measures what share of your solar production you use directly. Self-sufficiency measures what share of your total electricity needs are met by solar. A household that produces 8,000 kWh and consumes 8,000 kWh with 50% self-consumption is 50% self-sufficient — half its total energy comes from solar, half from the grid. Self-consumption can be high while self-sufficiency is low if the household uses far more grid energy than solar production. These two metrics answer different questions and should not be confused.
How does net metering affect self-consumption economics?
Net metering treats exported solar energy as a 1:1 credit against grid imports, which reduces the financial incentive to maximize self-consumption. In markets with full net metering — such as some US states — exporting 1 kWh earns a credit that buys back 1 kWh later, making self-consumption rate less critical to ROI. In markets without net metering or with reduced export tariffs — such as Germany, Italy, and post-2016 Australia — exported energy earns only a fraction of the retail price. In these markets, high self-consumption is essential for good returns.
What appliances use the most electricity during solar hours?
The best appliances to run during solar production hours are those with high consumption and flexible timing. Electric vehicle chargers (7–22 kW) are the largest flexible load in most homes. Heat pump water heaters (2–4 kWh per cycle), washing machines (0.5–2 kWh), dishwashers (1–2 kWh), and pool pumps (1–3 kWh) are also strong candidates. Air conditioning pre-cooling and electric heating pre-heating can shift 3–8 kWh into solar hours. The key is scheduling these loads between 10:00 and 15:00 when solar output peaks.
Is high solar self-consumption always the goal?
No. High self-consumption is not always optimal. In markets with generous net metering or high export tariffs, exporting surplus solar can be more valuable than storing or shifting it. Some commercial systems are deliberately oversized to maximize export revenue under favorable feed-in tariffs. Additionally, over-investing in batteries or smart load systems to chase the last 10% of self-consumption can cost more than the savings justify. The goal is maximizing total system value — not self-consumption for its own sake.
What self-consumption rate can I expect by country?
Typical residential self-consumption rates without batteries: Germany 30–45%, Australia 25–40%, Italy 35–55%, United States 30–50%, UK 30–45%. With a 7–10 kWh battery: Germany 65–80%, Australia 60–75%, Italy 65–80%, United States 60–75%, UK 60–75%. Commercial buildings with daytime operations typically achieve 60–90% without batteries. These ranges assume standard residential consumption of 3,000–6,000 kWh per year and a south-facing rooftop system sized at 4–8 kWp. Solar proposal software generates professional quotes in minutes.


