Quick Answer
Net metering lets solar owners bank excess generation as credit against future grid imports — effectively storing solar value without batteries. A net-metered residential system typically captures 70–90% of solar value vs only 30–50% under feed-in tariff buyback. Net metering is available in most US states, parts of Australia, Italy (Scambio sul Posto), and many emerging markets.
Net metering determines whether your solar panels pay for themselves in six years or twelve. It is the single most important policy variable in residential solar economics — more than panel efficiency, more than installer price, more than local sunshine hours. Yet most homeowners do not understand how their state’s net metering rules actually work, and many installers present savings projections that assume a policy environment that no longer exists.
Net metering lets solar owners bank excess generation as credit against future grid imports — effectively storing solar value without batteries. A net-metered residential system typically captures 70–90% of solar value vs only 30–50% under feed-in tariff buyback.
This guide is a working net metering savings calculator. It covers every US state’s current policy status, the three compensation models in use, how to calculate actual savings with real numbers, and what the national trend means for anyone considering solar in 2026.
TL;DR — Net Metering Savings Calculator
Net metering savings range from $800/year in states with weak net billing to $2,400/year in states with full retail-rate credits. California NEM 3.0 cut export values by 75%. The best states: Massachusetts, New Jersey, New York, Colorado. The weakest: California, Nevada, Arizona, Hawaii. Battery storage is now essential in net billing states. Self-consumption, not exports, drives most savings everywhere.
Read Adding Battery Storage Services for a complete walkthrough.
In this guide:
- How net metering works and how savings are calculated
- Three compensation models: 1:1 credit, avoided cost, net billing
- Net metering savings formula with a worked example
- State-by-state net metering status table (all 50 states)
- California NEM 2.0 vs NEM 3.0: real impact on savings
- States with the best net metering policies
- States where net metering is weak or ending
- Export rate vs retail rate gap and its impact
- Self-consumption rate: the hidden driver of savings
- Battery storage and net metering interaction
- Why net metering is not the savings driver most think it is
- Future of net metering: trends and predictions
Quick Answer: How Much Does Net Metering Save?
A typical 6 kW residential solar system producing 8,000-9,500 kWh annually saves $1,000-2,400 per year depending on the state’s net metering policy. The savings split into two parts: self-consumption (solar used directly in the home) and export credits (surplus sent to the grid).
| Net Metering Type | Annual Savings (6 kW) | Payback Period | Battery Needed? |
|---|---|---|---|
| Full retail-rate (1:1) | $1,800-2,400 | 6-8 years | Optional |
| Partial credit (TOU-based) | $1,400-1,900 | 7-9 years | Recommended |
| Net billing (avoided cost) | $1,000-1,500 | 8-12 years | Essential |
| No net metering | $600-900 | 10-15 years | Essential |
These figures assume $0.13-0.22/kWh retail electricity, a $15,000-20,000 system cost after the 30% federal tax credit, and 55-65% self-consumption. Your actual savings depend on your utility rate, consumption pattern, and system design.
What Is Net Metering and How Are Savings Calculated?
Net metering is a billing arrangement between a solar owner and their utility. When panels produce more electricity than the home consumes, the surplus flows to the grid. The utility records this export and credits the owner’s bill. When the home draws more than the panels produce, the owner buys electricity from the grid. At the end of the billing period, the owner pays only for the net difference.
How the Math Works
Consider a home with a 6 kW solar system in a state with full retail-rate net metering:
- Monthly solar production: 750 kWh
- Monthly home consumption: 900 kWh
- Self-consumed solar: 450 kWh (60% of production)
- Exported to grid: 300 kWh
- Imported from grid: 450 kWh
Bill without solar: 900 kWh x $0.16/kWh = $144
Bill with solar:
- Self-consumed: 450 kWh x $0.16 = $72 saved
- Exported credits: 300 kWh x $0.16 = $48 credit
- Grid import: 450 kWh x $0.16 = $72 charge
- Net bill: $72 - $48 = $24
Monthly savings: $144 - $24 = $120
Under full 1:1 net metering, the math is simple: every kWh exported offsets one kWh imported at the same rate. The grid acts as a free battery.
The Two Components of Savings
Most homeowners assume net metering credits are the main source of savings. They are not. Self-consumption — using solar power directly as it is produced — typically accounts for 60-75% of total savings in most US markets.
| Savings Component | Typical Share | Why It Matters |
|---|---|---|
| Self-consumption | 60-75% | Avoids buying grid electricity at full retail rate |
| Export credits | 25-40% | Offsets future grid purchases at credit rate |
This split is critical. In states that have weakened net metering, export credits shrink but self-consumption savings remain unchanged. A homeowner who uses 70% of their solar production on-site loses only 30% of their potential savings when export credits are cut in half.
Three Net Metering Models Explained
Not all net metering is equal. US states use three distinct compensation models, and the difference between them can alter payback by 3-5 years.
Model 1: Full Retail-Rate Net Metering (1:1)
Under full net metering, each kWh exported earns a credit equal to one kWh imported at the full retail rate. The utility effectively values exported solar at the same price it charges for grid electricity.
How it works:
- Export 1 kWh at midday = 1 kWh credit
- Use 1 kWh at night = 1 kWh charged, offset by credit
- Dollar value: export credit equals retail rate
States with full or near-full retail net metering: Massachusetts, New Jersey, New York, Colorado, Maryland, Minnesota, Oregon, Vermont, Connecticut, Rhode Island, New Mexico, Illinois, Delaware, Washington DC.
Advantage: Simple, transparent, maximizes solar owner savings.
Disadvantage: Utilities argue that solar owners do not pay for grid infrastructure costs they still use, creating a cost shift to non-solar customers.
Model 2: Time-of-Use (TOU) Net Metering
TOU net metering assigns different credit values depending on when energy is exported. Exports during peak demand hours (typically late afternoon and evening) earn higher credits than exports during off-peak hours.
How it works:
- Export 1 kWh at 3 PM (peak) = 1.2-1.5 kWh credit
- Export 1 kWh at 10 AM (off-peak) = 0.7-0.9 kWh credit
- Credit value tracks the time-varying retail rate
States with TOU net metering: California (NEM 2.0 legacy), parts of Texas, Arizona (some utilities), Hawaii (legacy systems).
Advantage: Aligns solar value with grid demand, incentivizes west-facing arrays and battery storage.
Disadvantage: More complex to model; midday exports (when solar peaks) often receive lower credits.
Model 3: Net Billing (Avoided-Cost Rate)
Net billing credits exports at a rate below retail — typically the wholesale or avoided-cost rate. This rate reflects what the utility would pay to generate or buy electricity itself, not what it charges customers.
How it works:
- Export 1 kWh at midday = $0.04-0.10 credit
- Import 1 kWh at night = $0.14-0.25 charge
- Credit value is 25-60% of retail rate
States with net billing: California (NEM 3.0), Nevada, Arizona (new systems), Hawaii (new systems), Louisiana, Idaho (some utilities), Utah (some utilities), Indiana (new systems). Also see: Best Solar Design Software India. For the latest details on India, see 5kW Solar Panel Price in India. For India-specific compliance details, see India andhra-pradesh.
Advantage: Addresses utility cost-shift concerns; encourages self-consumption and battery adoption.
Disadvantage: Reduces solar savings significantly; extends payback periods.
Key Takeaway — Model Comparison
For a 6 kW system exporting 3,000 kWh/year at $0.16/kWh retail: full net metering earns $480 in credits; net billing at $0.06/kWh earns $180. That $300 annual difference adds $7,500 in lost savings over 25 years.
For France-specific information, see Agricultural Solar Case Study. For the latest details on France, see Floating Solar Farms France.
Net Metering Savings Formula: Worked Example
Here is the exact formula professionals use to calculate net metering savings, applied to a real scenario.
The Formula
Annual Savings = (Self-Consumed kWh x Retail Rate) + (Exported kWh x Export Credit Rate)System assumptions:
- 6 kW system, 8,500 kWh annual production
- Retail electricity rate: $0.16/kWh
- Self-consumption rate: 60%
- Export credit rate: varies by state model
Scenario A: Full Retail-Rate Net Metering
| Parameter | Value |
|---|---|
| Annual production | 8,500 kWh |
| Self-consumed (60%) | 5,100 kWh |
| Exported (40%) | 3,400 kWh |
| Self-consumption savings | 5,100 x $0.16 = $816 |
| Export credit value | 3,400 x $0.16 = $544 |
| Total annual savings | $1,360 |
| System cost (after 30% ITC) | $16,800 |
| Simple payback | 12.4 years |
Note: The 30% federal residential ITC expired December 31, 2025. Systems placed in service after that date may be eligible for a reduced credit or other incentives depending on current legislation. Consult a tax professional for your specific situation.
Scenario B: Net Billing at $0.06/kWh Export
| Parameter | Value |
|---|---|
| Annual production | 8,500 kWh |
| Self-consumed (60%) | 5,100 kWh |
| Exported (40%) | 3,400 kWh |
| Self-consumption savings | 5,100 x $0.16 = $816 |
| Export credit value | 3,400 x $0.06 = $204 |
| Total annual savings | $1,020 |
| System cost (after 30% ITC) | $16,800 |
| Simple payback | 16.5 years |
The same system, same production, same consumption — but net billing reduces annual savings by 25% and extends payback by over 4 years.
Scenario C: High Self-Consumption (80%) with Net Billing
| Parameter | Value |
|---|---|
| Annual production | 8,500 kWh |
| Self-consumed (80%) | 6,800 kWh |
| Exported (20%) | 1,700 kWh |
| Self-consumption savings | 6,800 x $0.16 = $1,088 |
| Export credit value | 1,700 x $0.06 = $102 |
| Total annual savings | $1,190 |
| Simple payback | 14.1 years |
By increasing self-consumption from 60% to 80% — achievable with battery storage and load-shifting — the homeowner recovers most of the lost savings from net billing. This is why battery economics improve as net metering weakens.
State-by-State Net Metering Status: Complete 2026 Table
The following table summarizes net metering policies for all 50 US states as of May 2026. Policies change frequently — always verify current rules with your utility before making financial decisions.
| State | Policy Type | Export Credit Rate | Credit Rollover | Key Notes |
|---|---|---|---|---|
| Alabama | No statewide NEM | Varies by co-op | None | Utilities set individual policies; most co-ops offer minimal compensation |
| Alaska | Full retail | Retail rate | Annual | Limited solar market; high electricity rates improve economics |
| Arizona | Net billing | $0.07-0.10/kWh | Monthly | APS and SRP moved to net billing; legacy systems grandfathered |
| Arkansas | Full retail | Retail rate | Monthly | Act 464 (2023) preserved full NEM; strong policy |
| California | Net billing (NEM 3.0) | $0.04-0.08/kWh | Monthly | NEM 3.0 active since April 2023; 75% credit reduction vs NEM 2.0 |
| Colorado | Full retail | Retail rate | Annual | Xcel and co-ops offer strong NEM; no major changes expected |
| Connecticut | Full retail | Retail rate | Annual | Netting at retail; excess credits paid at avoided cost at year-end |
| Delaware | Full retail | Retail rate | Indefinite | Strong NEM policy; SREC market adds additional revenue |
| Florida | Full retail | Retail rate | Monthly | Utilities attempted to end NEM in 2022; failed; policy stable for now |
| Georgia | No statewide NEM | Varies by utility | None | Georgia Power offers limited buyback at avoided cost |
| Hawaii | Net billing | $0.10-0.15/kWh | Monthly | All islands moved to net billing; battery storage standard |
| Idaho | Mixed | Varies by utility | Monthly | Idaho Power offers net billing; some co-ops retain NEM |
| Illinois | Full retail | Retail rate | Annual | Adjustable Block Program adds incentive on top of NEM |
| Indiana | Net billing | Avoided cost | Monthly | SEA 309 (2017) phased out NEM; net billing for new systems |
| Iowa | Full retail | Retail rate | Monthly | Strong policy; no major reform attempts |
| Kansas | Full retail | Retail rate | Monthly | Stable; no recent legislative threats |
| Kentucky | No statewide NEM | Varies | None | Limited solar adoption; utility-specific policies |
| Louisiana | Net billing | Avoided cost | None | NEM ended 2019; minimal export compensation |
| Maine | Full retail | Retail rate | Annual | Net Energy Billing retained full retail credits |
| Maryland | Full retail | Retail rate | Indefinite | Strong NEM plus SREC market; 2-3 year payback advantage |
| Massachusetts | Full retail | Retail rate | Indefinite | SMART program plus NEM; among best US solar economics |
| Michigan | Full retail | Retail rate | Monthly | Stable; utilities periodically challenge but policy holds |
| Minnesota | Full retail | Retail rate | Annual | Strong co-op and municipal utility NEM policies |
| Mississippi | Net billing | Avoided cost | Monthly | Minimal compensation; weak solar market |
| Missouri | Full retail | Retail rate | Monthly | Stable; no major reform activity |
| Montana | Full retail | Retail rate | Annual | Northwestern Energy offers NEM; stable policy |
| Nebraska | No statewide NEM | Varies | None | Public power state; limited solar policies |
| Nevada | Net billing | 75% retail | Monthly | NEM 2.0 (2017) reduced credits; better than CA but weakened |
| New Hampshire | Full retail | Retail rate | Annual | Stable; net metering cap raised periodically |
| New Jersey | Full retail | Retail rate | Indefinite | Strong NEM plus SREC-II; excellent solar economics |
| New Mexico | Full retail | Retail rate | Indefinite | Strong policy; no major reform threats |
| New York | Full retail | Retail rate | Annual | VDER adds complexity but NEM core remains strong |
| North Carolina | Full retail | Retail rate | Monthly | Duke Energy offers NEM; stable policy environment |
| North Dakota | No statewide NEM | Varies | None | Limited market; utility-specific |
| Ohio | Full retail | Retail rate | Monthly | Stable; no recent legislative challenges |
| Oklahoma | No statewide NEM | Varies | None | Limited policies; co-op dependent |
| Oregon | Full retail | Retail rate | Annual | Strong policy; no major reform activity |
| Pennsylvania | Full retail | Retail rate | Indefinite | Stable; AEPS SREC market adds value |
| Rhode Island | Full retail | Retail rate | Annual | Strong NEM; small but favorable market |
| South Carolina | Full retail | Retail rate | Monthly | Stable; Duke and Santee Cooper offer NEM |
| South Dakota | No statewide NEM | Varies | None | Very limited solar market |
| Tennessee | No statewide NEM | Varies | None | TVA offers limited Green Power Providers program |
| Texas | Varies by utility | Retail or wholesale | Varies | No statewide mandate; retail choice creates wide variation |
| Utah | Net billing | Avoided cost | Monthly | Rocky Mountain Power moved to net billing in 2017 |
| Vermont | Full retail | Retail rate | Annual | Strong policy; no major reform threats |
| Virginia | Full retail | Retail rate | Monthly | Stable; Dominion and APCo offer NEM |
| Washington | Full retail | Retail rate | Annual | Strong policy; no major reform activity |
| Washington DC | Full retail | Retail rate | Indefinite | Strong NEM plus SREC market |
| West Virginia | Full retail | Retail rate | Monthly | Stable; limited solar market |
| Wisconsin | Full retail | Retail rate | Monthly | We Energies and MGE offer NEM; stable |
| Wyoming | No statewide NEM | Varies | None | Limited market; utility-specific |
Sources: DSIRE database (NREL), state PUC filings, utility tariff sheets. Rates and policies change frequently. Verify with your specific utility before making investment decisions.
California NEM 2.0 vs NEM 3.0: The Real Impact on Savings
California’s transition from NEM 2.0 to NEM 3.0 is the most significant net metering policy change in US history. Understanding the numbers helps explain why solar economics shifted so dramatically.
What Changed
| Feature | NEM 2.0 (Legacy) | NEM 3.0 (Current) |
|---|---|---|
| Export credit rate | Retail TOU rate ($0.25-0.35/kWh) | Avoided cost ($0.04-0.08/kWh) |
| Credit value reduction | — | ~75% lower |
| Grandfathering | 20 years from interconnection | 9 years for NEM 2.0 systems |
| Battery incentive | None | $0.50-2.00/Watt equity budget |
| Grid participation charge | None | ~$8-16/month for solar owners |
| Payback period (6 kW) | 5-7 years | 7-10 years |
A Real California Homeowner Comparison
Profile: 6 kW system, 9,500 kWh/year production, 55% self-consumption, $0.28/kWh average retail rate, $20,000 system cost after incentives.
Under NEM 2.0:
- Self-consumption: 5,225 kWh x $0.28 = $1,463/year
- Exports: 4,275 kWh x $0.28 = $1,197/year
- Total savings: $2,660/year
- Payback: 7.5 years
Under NEM 3.0:
- Self-consumption: 5,225 kWh x $0.28 = $1,463/year
- Exports: 4,275 kWh x $0.06 = $257/year
- Grid participation charge: -$120/year
- Total savings: $1,600/year
- Payback: 12.5 years
The difference: $1,060 less in annual savings. Over 25 years, NEM 3.0 costs this homeowner approximately $26,500 in lost export credits compared to NEM 2.0.
Why NEM 3.0 Still Works with Batteries
Add a 10 kWh battery to the NEM 3.0 scenario:
- Self-consumption rises from 55% to 80%
- Exports drop from 4,275 kWh to 1,900 kWh
- Self-consumption savings: 7,600 kWh x $0.28 = $2,128/year
- Export credits: 1,900 kWh x $0.06 = $114/year
- Grid participation charge: -$120/year
- Total savings: $2,122/year
- Battery cost adder: $8,000
- Total system cost: $28,000
- Payback: 13.2 years
The battery extends payback slightly but dramatically improves total savings. More importantly, the battery enables time-of-use arbitrage — charging during cheap midday solar hours and discharging during expensive evening peak hours — adding another $200-400/year in value.
Key Takeaway — California Solar Is Not Dead
California solar under NEM 3.0 still pays back in 7-10 years with batteries and 10-14 years without. The economics are worse than NEM 2.0 but still positive. The real issue is customer perception: homeowners who heard “solar pays for itself in 5 years” now face a 12-year reality. Installers must reset expectations and lead with self-consumption, not export credits.
States with the Best Net Metering Policies
These states offer full retail-rate credits with favorable rollover terms, making them the strongest markets for residential solar savings.
Massachusetts
Massachusetts combines full retail net metering with the SMART program, creating layered incentives. Export credits roll over indefinitely. The SMART program pays an additional $0.02-0.04/kWh on top of NEM for 10-20 years depending on system size and block.
Typical 6 kW savings: $2,200-2,800/year Payback: 5-7 years
New Jersey
New Jersey offers full retail net metering with indefinite rollover plus the SREC-II market. SRECs trade at $80-120 each, and a 6 kW system generates 6-8 SRECs annually. This adds $480-960/year on top of NEM savings.
Typical 6 kW savings: $2,000-2,600/year (including SRECs) Payback: 5-7 years
New York
New York’s Value of Distributed Energy Resources (VDER) mechanism is complex but generally preserves strong export values. The Megawatt Block incentive adds upfront capacity-based payments. Con Edison territory offers particularly strong economics.
Typical 6 kW savings: $1,600-2,200/year Payback: 6-8 years
Colorado
Colorado has stable full retail net metering with annual true-up. Xcel Energy’s Solar*Rewards program adds performance-based incentives. The state’s 300+ sunny days and high electricity rates improve economics further.
Typical 6 kW savings: $1,500-2,000/year Payback: 6-8 years
Maryland
Maryland offers full retail net metering with indefinite rollover plus SRECs. The state’s renewable portfolio standard creates consistent SREC demand. Electricity rates above the national average improve savings.
Typical 6 kW savings: $1,600-2,100/year (including SRECs) Payback: 6-8 years
States Where Net Metering Is Weak or Ending
These states have moved to net billing, ended net metering entirely, or have minimal export compensation. Solar economics here depend heavily on self-consumption and battery storage.
California (NEM 3.0)
The poster child for net metering reduction. Export credits dropped 75%. Battery storage is now effectively required for acceptable payback periods.
Typical 6 kW savings (no battery): $1,200-1,600/year Payback: 10-14 years
Nevada
Nevada’s NEM 2.0 (2017) reduced export credits to 75% of retail for non-peak hours and 95% for peak hours. The state’s abundant sunshine partially offsets weaker policy, but economics are worse than neighboring states.
Typical 6 kW savings: $1,100-1,500/year Payback: 9-12 years
Arizona
Arizona Public Service (APS) and Salt River Project (SRP) both moved to net billing. APS pays $0.0738-0.1045/kWh depending on system size. SRP’s export rate is similarly reduced. The state’s intense sunshine helps, but payback periods have extended 2-3 years.
Typical 6 kW savings: $1,000-1,400/year Payback: 9-13 years
Hawaii
Hawaii ended net metering in 2015. All new systems use Customer Grid-Supply Plus (CGS+) or Smart Export, with export rates of $0.10-0.15/kWh — well below the state’s $0.30-0.40/kWh retail rates. Battery storage is standard in Hawaii; most systems are designed for near-total self-consumption.
Typical 6 kW savings: $1,200-1,800/year (with battery) Payback: 7-10 years
Louisiana
Louisiana ended net metering in 2019. Utilities now pay avoided-cost rates of approximately $0.03-0.05/kWh. The state’s low electricity rates ($0.09-0.11/kWh) make solar economics challenging regardless of policy.
Typical 6 kW savings: $700-1,000/year Payback: 12-18 years
Export Rate vs Retail Rate Gap: Why It Matters
The gap between what utilities charge for electricity and what they pay for solar exports is the defining economic variable in modern solar markets.
The Gap by State
| State | Retail Rate | Export Credit Rate | Gap | Gap Impact on Savings |
|---|---|---|---|---|
| Massachusetts | $0.28/kWh | $0.28/kWh | $0.00 | None — full 1:1 |
| Colorado | $0.14/kWh | $0.14/kWh | $0.00 | None — full 1:1 |
| California (NEM 3.0) | $0.30/kWh | $0.06/kWh | $0.24 | High — 75% credit loss |
| Arizona (APS) | $0.13/kWh | $0.09/kWh | $0.04 | Moderate — 30% credit loss |
| Nevada | $0.14/kWh | $0.11/kWh | $0.03 | Low-Moderate — 20% credit loss |
| Hawaii | $0.38/kWh | $0.13/kWh | $0.25 | High — 65% credit loss |
| Louisiana | $0.10/kWh | $0.04/kWh | $0.06 | Moderate — 60% credit loss |
What the Gap Means for System Sizing
In states with a large gap, oversizing your solar system creates diminishing returns. Every additional panel produces energy that earns a low export credit rather than offsetting high retail purchases.
Rule of thumb:
- Full NEM states: size to 100-120% of annual consumption
- Net billing states: size to 80-100% of consumption
- Large gap states: size to match daytime load, not annual consumption
This is where solar design software that models hourly consumption against hourly production becomes essential. A system sized for annual kWh without regard to when those kWh are consumed will underperform financially in net billing markets.
Self-Consumption Rate: The Hidden Driver of Savings
Self-consumption — the percentage of solar production used directly in the home — is the most underappreciated variable in solar economics. It matters more than net metering policy in most cases.
How Self-Consumption Varies
| Household Profile | Typical Self-Consumption | Why |
|---|---|---|
| Retired couple, home all day | 70-80% | High daytime occupancy matches solar peak |
| Family with kids, work from home | 60-70% | Moderate daytime use, evening peak |
| Working couple, no kids | 40-50% | Minimal daytime use, high evening demand |
| Working couple with EV charging at home | 55-65% | EV adds daytime load if charged during sun hours |
| Same couple with battery storage | 75-85% | Battery shifts solar to evening use |
Self-Consumption Impact on Annual Savings
Using a 6 kW system in a state with $0.16/kWh retail and $0.06/kWh export credit:
| Self-Consumption | Self-Use Savings | Export Credits | Total Savings |
|---|---|---|---|
| 40% | $544 | $306 | $850 |
| 55% | $748 | $204 | $952 |
| 70% | $952 | $102 | $1,054 |
| 85% (with battery) | $1,156 | $51 | $1,207 |
Every 10% increase in self-consumption adds $100-150 in annual savings. In net billing states, the effect is even stronger because low-export-credit kWh are replaced with high-retail-rate self-consumed kWh.
How to Increase Self-Consumption
- Time-shift major loads. Run dishwasher, washing machine, and pool pumps during 10 AM-3 PM solar peak hours.
- Charge EV during the day. A Level 2 charger drawing 7 kW during solar peak can consume most of a residential system’s output.
- Pre-cool or pre-heat. Set thermostats to cool or heat the house during solar hours, reducing evening HVAC demand.
- Add battery storage. A 10-15 kWh battery stores midday surplus for evening use, typically raising self-consumption from 55% to 80%.
Pro Tip
Before sizing a battery, model your actual load profile against your solar production curve. A battery that is too small leaves evening demand uncovered; one that is too large wastes capacity. Use a generation and financial tool that models hourly data, not just monthly averages.
Battery Storage and Net Metering: The New Standard
Battery storage and net metering are no longer separate decisions. In states with weakened export credits, batteries are the primary tool for preserving solar savings.
How Batteries Change the Economics
| Scenario | Without Battery | With 10 kWh Battery |
|---|---|---|
| Self-consumption rate | 55% | 80% |
| Annual savings (net billing, $0.06 export) | $1,020 | $1,360 |
| Additional savings from battery | — | $340/year |
| Battery cost | — | $8,000 |
| Battery-only payback | — | 23.5 years |
| Total system payback | 16.5 years | 14.8 years |
The battery alone does not pay for itself quickly. But it improves total system economics by shifting low-value exported energy into high-value self-consumed energy. In states with time-of-use rates, the value improves further: batteries discharge during peak-rate evening hours when electricity costs $0.25-0.35/kWh.
Battery Economics by State Type
| State Type | Battery Value | Recommended Size |
|---|---|---|
| Full NEM states | Low — grid is already a free battery | Optional; 5-10 kWh for backup only |
| TOU net metering | Moderate — shift to peak rates | 10-15 kWh |
| Net billing states | High — maximize self-consumption | 10-20 kWh |
| No net metering | Very high — self-consumption is everything | 15-25 kWh |
The Federal Tax Credit and Batteries
The federal Investment Tax Credit (ITC) applies to battery storage when installed with solar. For systems placed in service before the end of 2025, the ITC was 30%. Current legislation may offer different rates for systems installed after that date. Consult a tax professional for current rates and eligibility.
Why Net Metering Is Not the Savings Driver Most Think It Is
Here is a contrarian take that most solar sales pitches get wrong: net metering policy is less important than self-consumption for the majority of US solar owners.
The Math Behind the Claim
Even in full net metering states, self-consumption accounts for 60-75% of total savings. Export credits are the smaller portion. This means:
- A homeowner who increases self-consumption from 55% to 75% gains more savings than a policy change from net billing to full NEM.
- Load-shifting behavior (running appliances during sun hours) is free and adds $100-300/year in savings.
- Battery storage in a net billing state often produces better economics than no battery in a full NEM state.
What Most Homeowners Get Wrong
The common misconception is that bigger systems always save more money. In net billing states, the opposite is often true. A system sized at 120% of consumption exports 50% of its production at low credit rates. A right-sized system at 90% of consumption exports only 20% and achieves better financial returns.
Example:
- 8 kW oversized system: 11,000 kWh production, 5,500 kWh self-consumed, 5,500 kWh exported at $0.06 = $330 credits
- 6 kW right-sized system: 8,500 kWh production, 5,500 kWh self-consumed, 3,000 kWh exported at $0.06 = $180 credits
The oversized system costs $5,000 more and generates only $150 more in annual savings. The extra $5,000 would be better spent on a battery.
The Real Driver of Solar ROI
Solar ROI depends on three variables in this order:
- Self-consumption rate (most important — homeowner behavior and battery)
- Retail electricity rate (determines value of every self-consumed kWh)
- Net metering policy (determines value of exports — the smaller portion)
Installers who focus sales conversations on system size and panel efficiency miss the bigger picture. The conversation should start with load profiling, time-of-use analysis, and battery pairing.
Future of Net Metering: Trends and Predictions
The national direction is clear: full retail-rate net metering is being phased out. Understanding the trajectory helps homeowners and installers plan for the next decade.
Trend 1: Net Billing Becomes the Default
By 2030, most states will likely operate some form of net billing rather than full retail net metering. The utility industry’s argument — that solar owners do not pay for grid infrastructure they use — has won regulatory support in most jurisdictions.
Predicted timeline:
- 2025-2027: 5-8 additional states transition to net billing
- 2028-2030: Only 10-15 states retain full retail NEM
- Post-2030: Net billing or real-time pricing becomes universal
Trend 2: Time-of-Use Export Rates Spread
Rather than flat avoided-cost rates, more utilities will adopt time-varying export credits. Exports during evening peak hours (4-9 PM) will earn higher credits than midday exports. This rewards west-facing arrays and battery discharge timing.
Trend 3: Grid Participation Charges Expand
California’s NEM 3.0 grid participation charge ($8-16/month) will be copied by other states. These fixed monthly fees for solar owners reduce savings regardless of production or consumption.
Trend 4: Grandfathering Periods Shorten
Legacy systems installed under full NEM historically received 20-year grandfathering. New programs are shortening this to 10 years or less. This reduces the long-term value of installing under favorable rules.
Trend 5: Virtual Power Plant Programs Emerge
Some utilities are testing programs that pay solar + battery owners for grid services — frequency regulation, peak shaving, demand response. These programs could replace or supplement traditional net metering, paying owners for active grid support rather than passive export.
| Trend | Impact on Solar Owners | Response Strategy |
|---|---|---|
| Net billing default | Lower export credit value | Maximize self-consumption; add battery |
| TOU export rates | Midday exports worth less | West-facing arrays; battery timing |
| Grid participation charges | Fixed monthly cost | Factor into payback calculations |
| Shorter grandfathering | Less long-term certainty | Size systems for shorter payback |
| VPP programs | New revenue stream | Participate if available in your area |
Narrative: Two Homeowners, Two States, Very Different Savings
Consider two identical homes with identical 6 kW solar systems. The only difference is location.
Sarah in Massachusetts has full retail net metering. Her system produces 8,500 kWh/year. She works from home and self-consumes 65% of production. Her retail rate is $0.28/kWh.
- Self-consumption: 5,525 kWh x $0.28 = $1,547/year
- Export credits: 2,975 kWh x $0.28 = $833/year
- SREC revenue: 7 credits x $100 = $700/year
- Total savings: $3,080/year
- Payback: 5.8 years
Mike in California has NEM 3.0 net billing. His system also produces 8,500 kWh/year. He also works from home and self-consumes 65%. His retail rate is $0.30/kWh, but his export credit is $0.06/kWh.
- Self-consumption: 5,525 kWh x $0.30 = $1,658/year
- Export credits: 2,975 kWh x $0.06 = $179/year
- Grid participation charge: -$144/year
- Total savings: $1,693/year
Mike earns 45% less than Sarah despite having a higher retail rate and identical consumption. The difference is entirely policy. If Mike adds a 10 kWh battery and raises self-consumption to 82%:
- Self-consumption: 6,970 kWh x $0.30 = $2,091/year
- Export credits: 1,530 kWh x $0.06 = $92/year
- Grid participation charge: -$144/year
- Battery cost: $8,000
- Total savings: $2,039/year
- Payback (with battery): 13.7 years
The battery closes half the gap but cannot fully overcome California’s policy headwind. Sarah’s Massachusetts system, with no battery, outperforms Mike’s California system with a battery.
This is why the net metering savings calculator matters. The same hardware, the same household, the same sunshine — but policy creates a 45% difference in returns.
How to Use This Calculator for Your Home
Follow these steps to estimate your actual net metering savings:
Step 1: Gather Your Data
- Last 12 months of electricity bills (total kWh and total cost)
- Your utility’s current net metering or net billing policy
- Your utility’s export credit rate (if net billing)
- Estimated system size from a solar quote or online calculator
Step 2: Estimate Production
Use PVWatts (NREL’s free tool) or ask your installer for a production estimate. A 6 kW system in the US typically produces 7,500-10,500 kWh/year depending on location.
Step 3: Estimate Self-Consumption
Be honest about your daytime electricity use:
- Home all day: 70-80%
- Work from home: 60-70%
- Away during day, no EV: 40-50%
- Away during day, EV charging at home: 55-65%
Step 4: Apply the Formula
Annual Savings = (Production x Self-Consumption % x Retail Rate) + (Production x Export % x Credit Rate)Step 5: Factor in Costs
- System cost (get 3 quotes)
- Federal tax credit (consult current rates with a tax professional)
- State or utility incentives
- Financing costs if applicable
Step 6: Calculate Payback
Simple Payback (years) = Net System Cost / Annual SavingsFor a more accurate picture, use a generation and financial tool that models hourly production against hourly consumption, accounts for degradation, and includes all incentives.
Net Metering Policy Resources
| Resource | What It Provides | Link |
|---|---|---|
| DSIRE (NREL) | Database of all state incentives and policies | dsireusa.org |
| NREL PVWatts | Free solar production estimator | pvwatts.nrel.gov |
| SEIA State Policy | Solar industry policy tracker by state | seia.org/state-solar-policy |
| CPUC (California) | NEM 3.0 rules and rate schedules | cpuc.ca.gov |
| EIA Electricity Data | State-by-state retail electricity rates | eia.gov/electricity |
In-Content Illustration
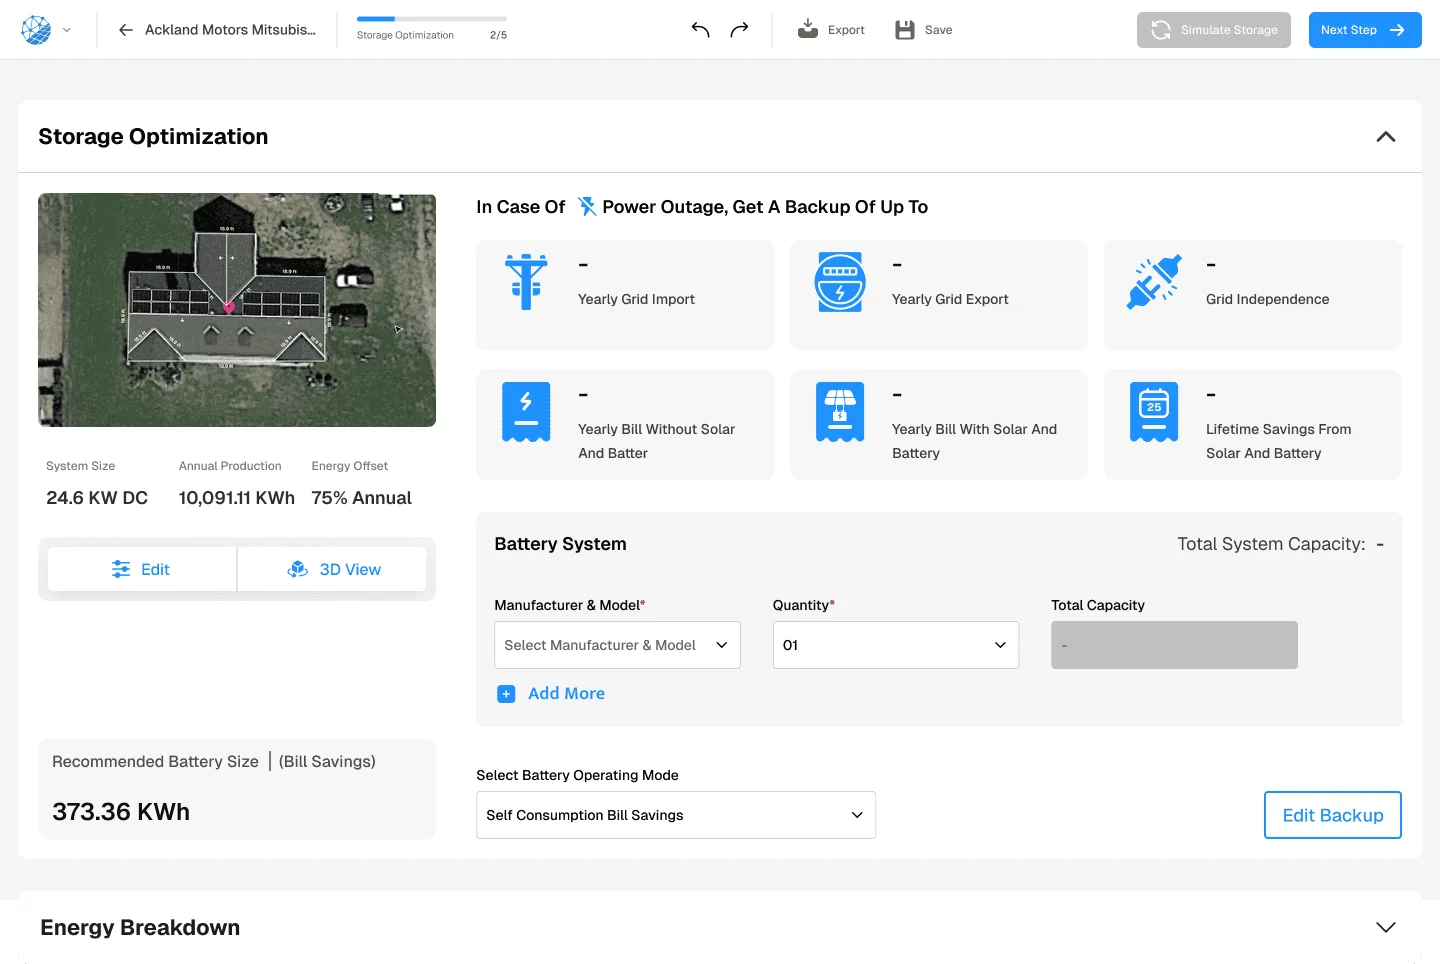 For a direct comparison, see Arka 360 vs SurgePV.
SurgePV’s storage optimization tool models self-consumption bill savings, showing how battery storage shifts solar production to evening use and maximizes the value of every kWh generated. In net billing states, this capability is essential for accurate payback projections.
Model Net Metering Savings for Any State
SurgePV’s generation and financial tool calculates accurate net metering savings using your actual utility rate schedule, state policy rules, and hourly consumption data. Stop guessing and start modeling.
Book a DemoNo commitment required · 20 minutes · Live project walkthrough
Conclusion
Net metering policy is the most consequential variable in residential solar economics, but it is not the only one. Self-consumption rate, retail electricity prices, and battery storage all play major roles. A homeowner who maximizes self-consumption in a net billing state can outperform a homeowner who wastes exports in a full NEM state.
The national trend toward weaker export compensation is clear. California, Nevada, Arizona, and Hawaii have already made the shift. More states will follow. The homeowners who adapt — by right-sizing systems, adding batteries, and shifting loads to solar hours — will continue to see strong returns. Those who install oversized systems and assume the grid will buy their surplus at full retail rates will be disappointed.
Three actions for 2026:
- Check your state’s current net metering policy before getting quotes. The DSIRE database and your utility’s website are the authoritative sources.
- Size your system to match your daytime consumption, not your annual total. In net billing states, every exported kWh is a wasted opportunity.
- Model battery storage if you are in a net billing or TOU state. The economics have improved significantly as battery costs fell 40% between 2022 and 2025.
For solar installers, the shift from NEM to net billing requires a fundamental change in how systems are designed and sold. Lead with self-consumption modeling, not system size. Show hourly production against hourly load. Present battery pairing as standard, not optional, in net billing markets. The installers who adapt their sales process to the new policy reality will win market share from those still selling 2019-era NEM economics.
For more on solar policy and savings, see our guides to net metering, residential solar, and solar design software that models state-specific policies accurately.
Frequently Asked Questions
What is a net metering savings calculator?
A net metering savings calculator estimates how much money a solar system owner saves by exporting excess electricity to the grid and receiving bill credits. It factors in system size, local electricity rates, export credit rates, self-consumption rates, and state-specific net metering rules to project monthly and annual savings.
Which states have the best net metering policies?
As of 2026, states with the most favorable net metering include Massachusetts, New Jersey, New York, Colorado, and Maryland. These states offer full retail-rate credits or near-retail compensation with annual rollover. California, Nevada, and Arizona have significantly weakened their programs, moving to net billing with reduced export rates.
How much can I save with net metering?
Annual net metering savings for a typical 6 kW residential system range from $800 in states with weak net billing to $2,400 in states with full retail-rate net metering. The exact amount depends on your electricity rate, how much you export, and your state’s credit rate. Self-consumption typically accounts for 60-70% of total savings; export credits make up the remainder.
What is the difference between net metering and net billing?
Net metering credits exported solar energy at the full retail electricity rate — typically 1 kWh exported offsets 1 kWh imported dollar-for-dollar. Net billing credits exports at a lower rate, often the wholesale or avoided-cost rate, which is 50-75% below retail. Net billing reduces annual savings by $400-800 for a typical residential system compared to full net metering.
Is California net metering still worth it after NEM 3.0?
California NEM 3.0 reduced export credit values by approximately 75% compared to NEM 2.0. A typical California homeowner now receives $0.04-0.08/kWh for exports instead of $0.25-0.35/kWh. Solar still pays back in 7-10 years under NEM 3.0, but battery storage is now essential to maximize self-consumption and protect savings. Systems without batteries see significantly weaker economics.
Does net metering work with battery storage?
Yes. Battery storage pairs with net metering by storing excess daytime production for evening use, increasing self-consumption and reducing grid imports. In states with net billing or time-of-use rates, batteries can shift energy use to peak-rate periods, maximizing the value of every kWh generated. Battery economics improve as export credit rates fall.
Can I lose my net metering credits?
Most states allow net metering credits to roll over month to month. Some reset unused credits annually — either paying them out at a reduced rate or forfeiting them. Check your state’s reconciliation rules: true-up monthly, annually, or at other intervals. Annual reconciliation is most favorable because summer overproduction offsets winter shortfalls.
What happens to net metering when I sell my house?
Net metering agreements typically transfer to the new homeowner along with the solar system. The new owner assumes the remaining interconnection agreement and continues receiving credits. Some utilities require a simple transfer notification. The solar system’s presence often increases home resale value by $15,000-25,000 according to NREL research.
Are net metering policies changing?
Yes. The national trend is toward weaker export compensation. Since 2020, California, Nevada, Arizona, Hawaii, and Louisiana have reduced or ended traditional net metering. More states are expected to transition to net billing or time-of-use export rates. Homeowners who install before policy changes are often grandfathered under the older, more favorable rules.
How do I calculate my actual net metering savings?
Use this formula: Monthly Savings = (Self-Consumed kWh x Retail Rate) + (Exported kWh x Export Credit Rate) - (Grid Import kWh x Retail Rate). For a quick estimate, a 6 kW system producing 8,000 kWh/year with 60% self-consumption at $0.15/kWh retail and $0.08/kWh export credit saves approximately $1,360/year. Use a generation and financial tool for precise modeling with your actual utility rate schedule. Solar proposal software generates professional quotes in minutes.