Quick Answer
Solar LCOE ($0.03–$0.06/kWh) is now competitive with onshore wind ($0.02–$0.05/kWh). Solar wins on modularity, faster permitting, and distributed deployment. Wind has higher capacity factor (25–45% vs 15–25%) and requires less land per MWh. Hybrid wind-solar projects maximize grid value.
In this guide, you’ll learn how solar energy and wind energy stack up on efficiency, cost, output, and real-world suitability.
Solar LCOE ($0.03–$0.06/kWh) is now competitive with onshore wind ($0.02–$0.05/kWh). Solar wins on modularity, faster permitting, and distributed deployment. Wind has higher capacity factor (25–45% vs 15–25%) and requires less land per MWh. Hybrid wind-solar projects maximize grid value.
We analyzed 2025 data from the U.S. Energy Information Administration, IRENA, and the IEA. Wind and solar together now generate 17% of U.S. electricity, up from less than 1% in 2005. Globally, renewables added 692 GW of capacity in 2025, and solar alone accounted for nearly three-quarters of that growth.
You’ll also get a clear decision framework: when solar wins, when wind wins, and when combining both makes sense.
Let’s break it down.
Featured Snippet Answer
What is the difference between solar energy and wind energy?
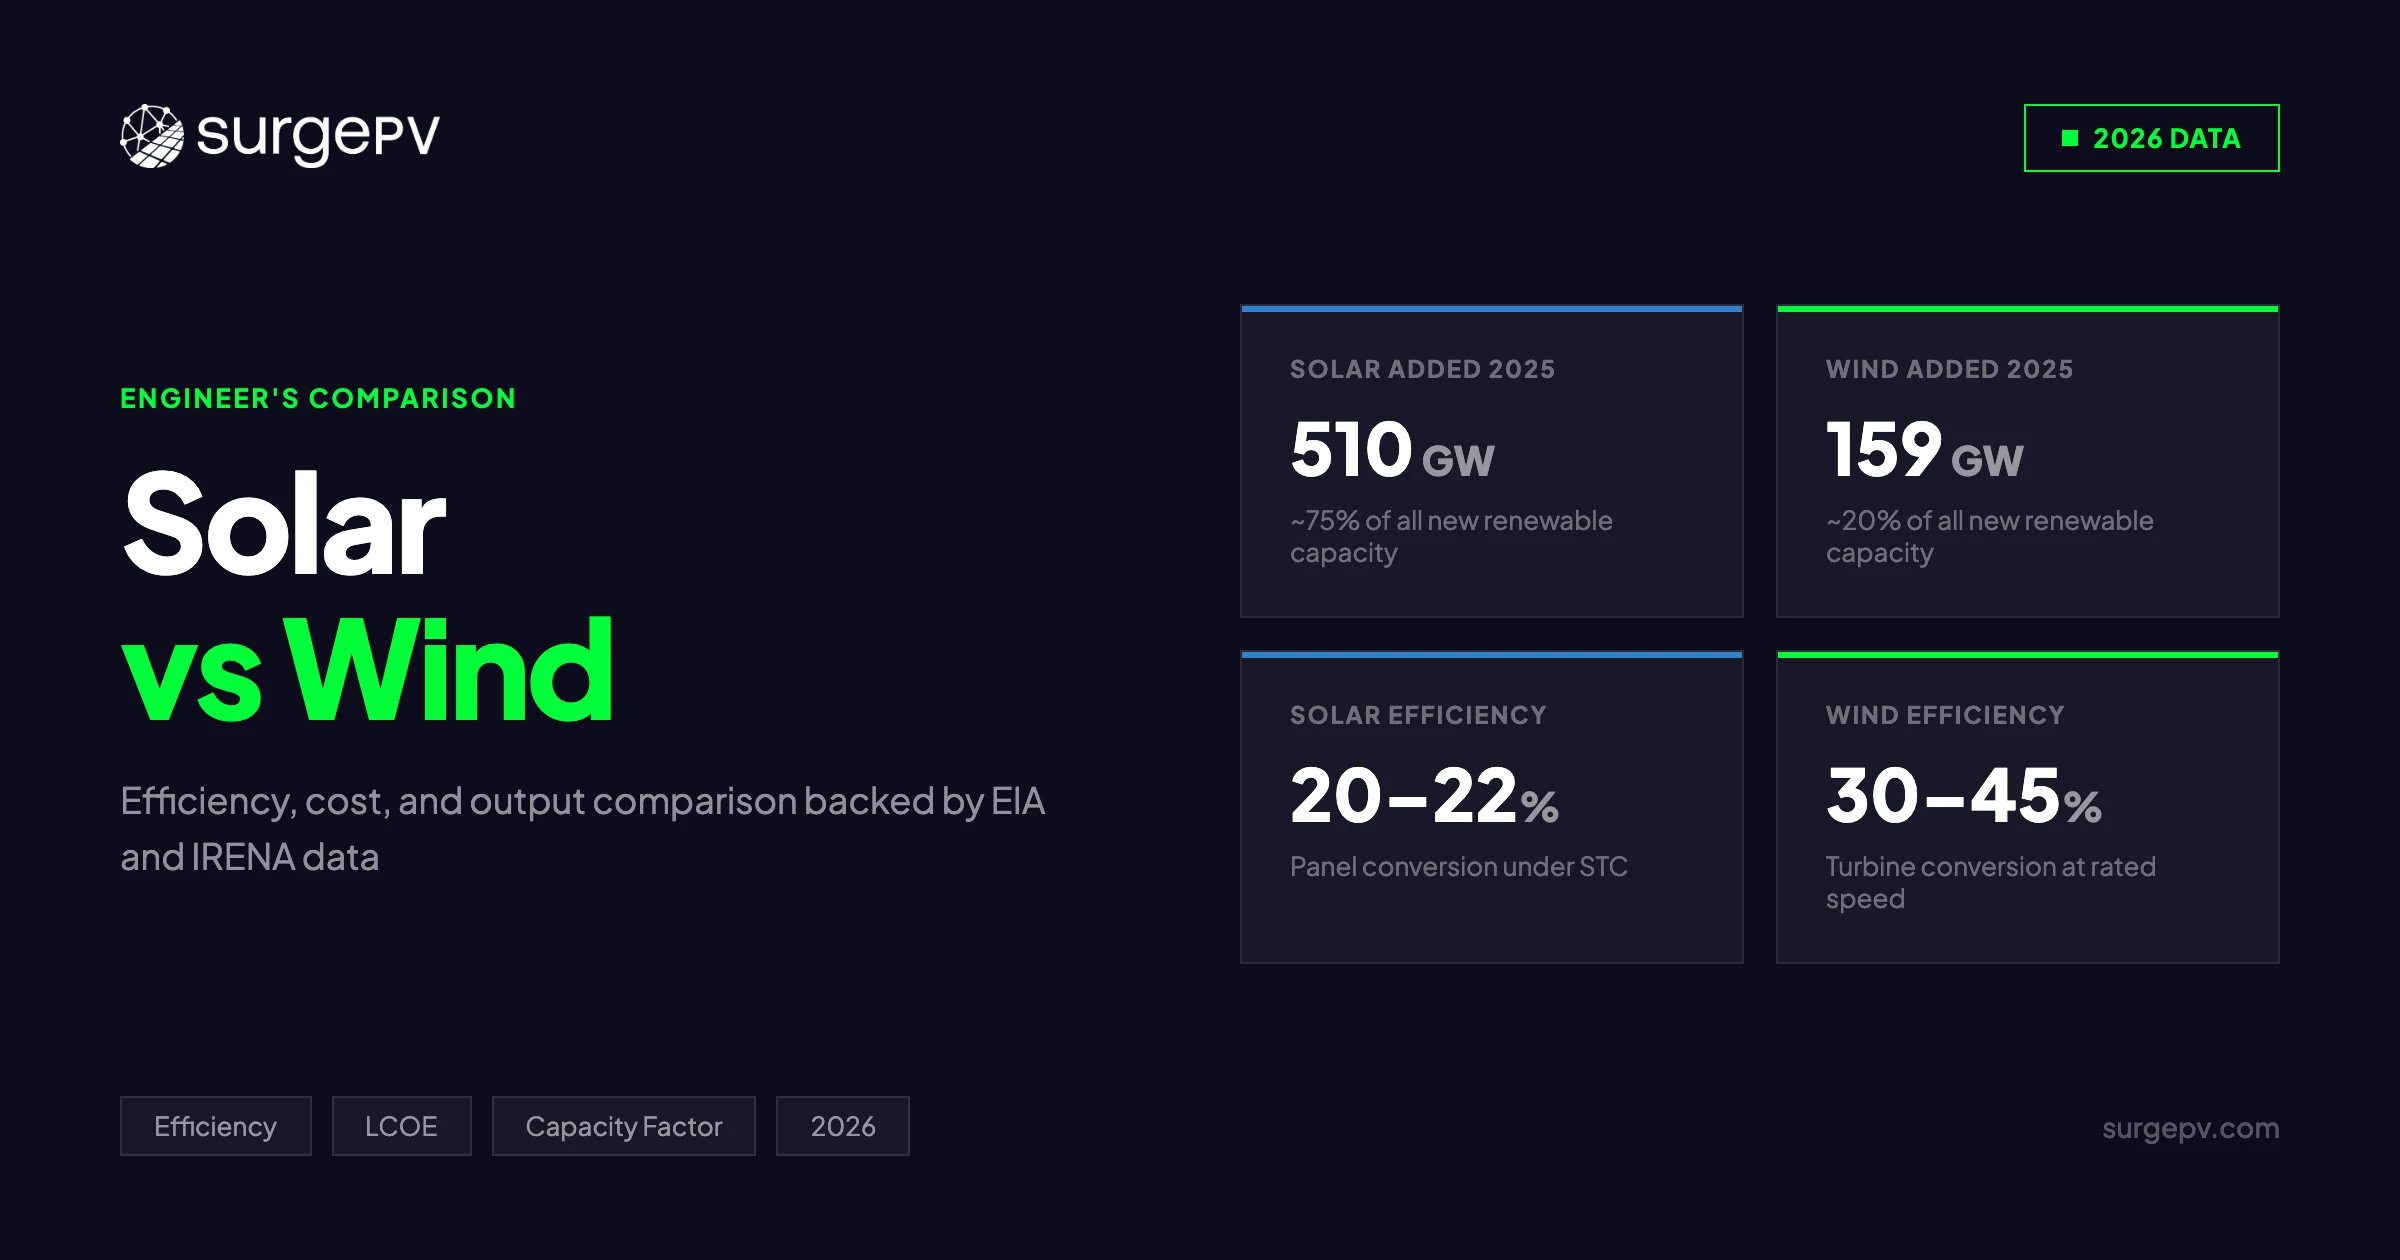
Solar energy converts sunlight into electricity using photovoltaic cells. Wind energy converts the kinetic energy of moving air into electricity using turbines. Solar works best in sunny, distributed applications like rooftops. Wind works best at utility scale in open, windy areas. Solar added 510 GW of global capacity in 2025; wind added 159 GW. For Global-specific compliance details, see Global net-metering-by-country. For Global-specific compliance details, see Global solar-permitting-speed-by-country.
TL;DR: Wind turbines convert 30–45% of wind into electricity, beating solar panels at 20–22% efficiency. But solar is cheaper to install, easier to maintain, and growing 3x faster. Choose solar for homes and distributed generation. Choose wind for utility-scale power in windy regions. For grid operators, the future is both.
What you’ll learn:
- How solar panels and wind turbines convert energy into electricity
- Exact efficiency numbers and capacity factors for both technologies
- Cost comparisons using 2025 LCOE data
- Land use, maintenance, and environmental trade-offs
- Which technology fits residential, commercial, and utility-scale needs
- Why hybrid solar-plus-wind systems are gaining traction
- A practical checklist for choosing between the two
How Solar Energy Works
Solar photovoltaic (PV) systems use semiconductor cells to convert sunlight directly into direct current (DC) electricity. When photons strike the silicon cell, they knock electrons loose. An electric field pushes those electrons into a current. An inverter then converts DC to alternating current (AC) for use in buildings or export to the grid.
The key components are simple:
- PV modules — the panels that capture sunlight
- Inverter — converts DC to AC
- Mounting structure — fixes panels at the optimal tilt and orientation
- Balance of system — wiring, switches, and protection devices
Modern solar panels achieve 20–22% conversion efficiency under standard test conditions. Lab prototypes have exceeded 26%, but commercial modules cluster in the 19–22% range. Solar output is predictable: panels produce power when the sun shines, peak at midday, and drop to zero at night.
Solar systems scale from a single 400 W rooftop panel to multi-gigawatt desert farms. That modularity is solar’s superpower. You can add panels incrementally, install them on existing structures, and place them close to demand centers.
How Wind Energy Works
Wind turbines capture kinetic energy from moving air. Wind pushes against the turbine blades, causing them to rotate. A shaft connected to the blades spins a generator, which produces electricity. The process is mechanical, not chemical or photovoltaic.
The key components include:
- Rotor blades — capture wind energy
- Nacelle — houses the gearbox, generator, and control systems
- Tower — elevates the rotor to capture stronger, steadier winds
- Transformer and substation — step up voltage for grid transmission
Modern onshore wind turbines range from 2.5 MW to 3.5 MW of rated capacity. Offshore turbines now exceed 15 MW. Wind turbines achieve 30–45% efficiency in converting wind energy to electricity, with peak performance hitting 50% during optimal wind conditions.
Unlike solar, wind can generate 24 hours a day. But wind is less predictable. Output depends on wind speed, which varies by hour, season, and year. Turbines also have a narrow operational window: they start generating at roughly 3–4 m/s, reach rated output at 12–15 m/s, and shut down to protect machinery above 25 m/s.
Solar vs Wind: Efficiency Comparison
Efficiency means different things for solar and wind. For solar, it is the share of sunlight converted to electricity. For wind, it is the share of wind kinetic energy converted to electricity. You cannot compare them directly without context.
| Metric | Solar PV | Wind (Onshore) |
|---|---|---|
| Conversion efficiency | 20–22% | 30–45% (up to 50% peak) |
| Capacity factor | 20–25% | 35–45% |
| Peak output period | Midday | Variable; often night/early morning |
| Annual output predictability | High (based on irradiance maps) | Moderate (based on wind resource assessments) |
| Degradation over time | 0.5–0.8% per year | None for structure; blades degrade slowly |
Capacity factor matters more than conversion efficiency for project economics. A technology with lower efficiency but higher capacity factor can produce more annual energy per installed watt. Onshore wind often wins here, with capacity factors of 35–45% versus 20–25% for solar in most locations.
However, solar has a hidden advantage: predictable daily patterns. You know with near certainty how much a solar array will produce on a clear summer day. Wind output is harder to forecast hour by hour. For grid operators, solar’s predictability reduces balancing costs.
Pro Tip
Capacity factor varies massively by location. A solar farm in Arizona achieves 28–30%; the same panels in Seattle hit 14–16%. A wind farm in the Great Plains reaches 45%; one in low-wind regions may hit only 25%. Always model with local resource data before choosing.
Cost Comparison: Which Is Cheaper?
Both solar and wind have become the cheapest sources of new electricity in most of the world. But their cost profiles differ.
Upfront costs
- Residential solar: $2.50–$4.00 per watt installed in the U.S. A typical 8 kW system costs $20,000–$32,000 before incentives.
- Residential wind: Small turbines (1–10 kW) cost $3,000–$70,000 installed. They rarely compete with solar on cost per kWh for homes.
- Utility-scale solar: $0.80–$1.20 per watt.
- Utility-scale wind: $1.20–$1.80 per watt.
Levelized cost of energy (LCOE)
LCOE measures lifetime cost divided by lifetime energy production. Lower is better.
| Technology | LCOE Range (2025) | Trend |
|---|---|---|
| Utility-scale solar PV | $0.025–$0.048/kWh | Falling 5–10% per year |
| Onshore wind | $0.026–$0.054/kWh | Stable, slight decline |
| Offshore wind | $0.075–$0.150/kWh | Falling but still premium |
| Residential solar | $0.06–$0.12/kWh | Varies by region and incentives |
At utility scale, onshore wind and solar are neck and neck. Solar is 41% cheaper than the lowest-cost fossil fuels; wind is 53% cheaper than coal or gas (IEA, 2024). The winner in any region depends on local resource quality, land costs, and grid connection distance.
For residential use, solar wins decisively. Small wind turbines suffer from low hub heights, turbulent airflow near buildings, and high maintenance. Most homeowners find that rooftop solar delivers 3–5x better value than a backyard turbine.
Note
These LCOE figures exclude subsidies. The U.S. Inflation Reduction Act, EU Green Deal, and similar programs can reduce upfront costs by 30% or more. Always factor local incentives into project economics.
Output and Scale: What Each Technology Delivers
Solar and wind serve different scales and use cases. Understanding where each technology excels helps you choose the right tool.
Residential and commercial
Solar dominates. Rooftop panels fit on existing structures, require no moving parts, and integrate with battery storage. An average U.S. home needs 20–25 panels (8–10 kW) to offset annual usage. Also see: Us Residential Solar Market Trends 2026. Read Adding Battery Storage Services for a complete walkthrough.
Wind rarely works at this scale. A small turbine needs a tower tall enough to clear nearby trees and buildings, typically 30 meters or higher. Zoning restrictions, noise concerns, and turbulent wind near structures make residential wind impractical in most areas.
Utility scale
Both technologies compete fiercely. In 2025, solar added roughly 510 GW globally; wind added 159 GW. Solar leads in total capacity additions, but wind often delivers more energy per installed megawatt due to higher capacity factors.
| Scale | Solar | Wind |
|---|---|---|
| Residential | Excellent (rooftop) | Poor (turbulence, zoning) |
| Commercial | Excellent (carports, rooftops) | Fair (rural sites only) |
| Utility | Excellent (fast deployment) | Excellent (high capacity factor) |
| Off-grid | Excellent (with battery) | Fair (needs battery or hybrid) |
Capacity milestones
Global installed capacity tells the story of solar’s rapid scaling:
- Solar: ~2,800 GW cumulative by end of 2025
- Wind: ~1,450 GW cumulative by end of 2025
- Hydropower: ~1,280 GW cumulative
Solar overtook hydropower in 2023 to become the largest renewable source by capacity. Wind remains the second-largest renewable source after solar.
Land Use and Siting Requirements
Land use is a common point of confusion. Wind turbines have a tiny physical footprint, but they need wide spacing. Solar panels cover ground continuously.
Solar land use
Utility-scale solar requires 3.5–10 acres per MW depending on technology and spacing. A 100 MW solar farm covers roughly 350–1,000 acres. However, solar can share land with agriculture (agrivoltaics), float on water, or mount on rooftops.
Wind land use
A single turbine occupies 1–2 acres of direct footprint. But turbines need spacing of 5–10 rotor diameters to avoid wake effects. A 100 MW wind farm may span 5,000–15,000 acres, though the land between turbines remains usable for farming or grazing.
The practical difference: Solar converts land directly into energy collection area. Wind uses land for spacing but leaves most of it available for other uses. For farmers, wind offers energy revenue without losing much productive land.
Key Takeaway
If land is scarce and expensive, rooftop or floating solar is the better choice. If you have large, open rural land with good wind resources, wind can deliver more energy per dollar invested.
Maintenance and Reliability
Maintenance costs favor solar. With no moving parts, solar panels need little more than occasional cleaning and inverter replacement every 10–15 years.
Solar maintenance:
- Panel cleaning: 1–4 times per year in dusty regions
- Inverter replacement: once per system lifetime
- Annual inspection: recommended
Wind maintenance:
- Gearbox service: every 6–12 months
- Blade inspection and repair: ongoing
- Nacelle systems: regular lubrication and parts replacement
- Major overhauls: every 7–10 years
Wind turbines have 600+ moving parts in the drivetrain. Gearboxes, bearings, and generators wear out. Offshore turbines face salt corrosion and harsh weather, driving maintenance costs higher.
Solar panels degrade slowly at 0.5–0.8% per year. After 25 years, a panel still produces 80–85% of its original output. Wind turbines do not degrade in the same way, but mechanical fatigue eventually requires blade replacement or full repowering.
Environmental Impact
Both solar and wind are vastly cleaner than fossil fuels. Lifecycle emissions for solar are 40–50 g CO₂/kWh; for wind, 10–15 g CO₂/kWh. Coal produces 820–1,050 g CO₂/kWh. But neither renewable source is entirely impact-free.
Solar environmental considerations
- Manufacturing: Silicon purification is energy-intensive. Most panels are manufactured in China, where grid carbon intensity affects embodied emissions.
- Land use: Large solar farms can displace habitat if sited poorly.
- End-of-life: Panel recycling infrastructure is still scaling. Europe leads with mandatory recycling programs. Also see: European Solar Incentives.
Wind environmental considerations
- Wildlife: Turbines kill an estimated 140,000–500,000 birds annually in the U.S. This is far fewer than collisions with buildings or cats, but it remains a concern for conservation groups.
- Bats: Wind turbines kill more bats than birds. Curtailment during low-wind nights reduces bat mortality.
- Noise and visual impact: Turbines produce audible noise and shadow flicker. Siting rules typically require setbacks from homes.
- Materials: Turbine blades are hard to recycle. New blade designs and recycling technologies are emerging. Shadow analysis software identifies shading issues before installation.
Warning
Lifecycle analyses show that both technologies “pay back” their manufacturing emissions within 1–4 years of operation. Over a 30-year lifespan, the emissions savings are enormous. Do not let manufacturing concerns distract from the net climate benefit.
Solar vs Wind by Region
Your location largely determines which technology makes sense.
Best regions for solar
- Southwestern U.S.: Arizona, Nevada, Southern California (2,000+ sun hours/year)
- Middle East and North Africa: Saudi Arabia, UAE, Morocco (some of the highest irradiance on Earth)
- Australia: Nationwide high irradiance, strong rooftop adoption
- Southern Europe: Spain, Italy, Greece
- India: Rajasthan, Gujarat (massive utility-scale deployment) Also see: solar panel ROI in Italy. Also see: Spain net metering. Also see: Best Solar Design Software India.
Best regions for wind
- U.S. Great Plains: Texas, Oklahoma, Kansas, Iowa (capacity factors up to 45%)
- Northern Europe: North Sea offshore (strong, consistent winds)
- China: Northern and western provinces
- Brazil: Northeastern wind corridors
- Patagonia: Some of the strongest onshore winds globally
Many regions suit both. Texas leads the U.S. in both wind and solar capacity. The ideal strategy often combines both: solar peaks in summer and midday; wind often peaks in winter and at night. Together, they smooth seasonal and daily variations.
Hybrid Systems: Using Solar and Wind Together
Grid operators and off-grid developers increasingly pair solar and wind with batteries. The reason is simple: complementary generation profiles. For more on this topic, see Off Grid Solar System Sizing.
- Solar peaks at midday, especially in summer.
- Wind often peaks at night and in winter.
- Together, they reduce the size of battery storage needed to maintain 24/7 power.
A hybrid plant might combine 100 MW solar, 50 MW wind, and 50 MWh battery storage. The solar covers daytime demand, wind covers nighttime and winter shortfalls, and the battery bridges gaps. The result is higher capacity utilization and lower LCOE than either technology alone.
For homeowners, hybrid systems are rare. Adding a small wind turbine to a solar array rarely beats the economics of simply adding more panels and a battery. The exception is remote off-grid properties in very windy locations.
Common Mistakes When Choosing Between Solar and Wind
Mistake 1: Ignoring local resource data
A homeowner in a low-wind suburb who installs a small turbine because they “like the idea of wind” will be disappointed. Always start with solar irradiance maps and wind resource assessments.
Mistake 2: Comparing nameplate capacity directly
A 10 kW solar array and a 10 kW wind turbine do not produce the same annual energy. Because wind has a higher capacity factor, the turbine likely produces more. But the turbine also costs more, requires maintenance, and may face zoning hurdles.
Mistake 3: Underestimating maintenance
Wind turbines need regular service. If you are a homeowner who does not maintain your gutters, you will not enjoy owning a wind turbine.
Mistake 4: Forgetting about storage
Both solar and wind are intermittent. Without storage or grid connection, neither provides reliable 24/7 power. Factor battery or backup costs into off-grid comparisons. For the latest details on France, see Agricultural Solar Case Study. For France-specific information, see Floating Solar Farms France.
Mistake 5: Choosing based on aesthetics alone
Some homeowners prefer the look of turbines. Some hate them. Some love uniform solar arrays; others find them industrial. Make the decision on economics and resource quality first, then consider aesthetics.
Decision Checklist: Solar or Wind?
Use this checklist to choose the right technology for your project.
Choose solar if:
- You need power for a home, office, or building with a suitable roof or open land
- You want minimal maintenance
- Your location receives 1,400+ peak sun hours per year
- You prefer modular, scalable expansion
- You need to install quickly
Choose wind if:
- You have large, open land with average wind speeds above 5.5 m/s at hub height
- You need utility-scale power (10 MW+)
- Your project is in a region with strong, consistent wind resources
- You can handle ongoing maintenance and operational complexity
- You want 24/7 generation potential (though not guaranteed)
Choose both if:
- You are designing a utility-scale or microgrid project
- You have strong solar and wind resources
- You want to minimize battery storage costs through complementary generation
- You are building in a remote location where grid access is limited
Conclusion
Solar energy and wind energy are not competitors. They are partners in the transition away from fossil fuels. Solar wins on modularity, maintenance simplicity, and distributed deployment. Wind wins on capacity factor, utility-scale output, and land-sharing potential.
The data is clear: in 2025, solar added 510 GW globally. Wind added 159 GW. Both are growing. Both are cheap. Both cut carbon emissions by 95%+ compared to coal.
Your next steps:
- Check solar irradiance and wind speed data for your specific location
- Run LCOE calculations with local incentives and electricity rates
- Model both technologies in your solar design software before committing capital
- If you are a homeowner, start with solar. It is almost always the better choice
Want to see how solar would perform on your property? Explore our solar designing tools to model arrays, estimate output, and optimize layouts before you spend a dollar.
Frequently Asked Questions
Which is more efficient: solar panels or wind turbines?
Wind turbines are more efficient at converting raw resource into electricity. Modern wind turbines achieve 30–45% efficiency, with peak performance reaching 50%. The best solar panels convert 20–22% of sunlight into electricity. However, solar panels require less maintenance and have more predictable daily output patterns.
Is solar or wind cheaper per kWh in 2026?
Both are among the cheapest power sources available. Solar is 41% cheaper than the lowest-cost fossil fuels, and wind is 53% cheaper than coal or gas. At utility scale, onshore wind often has a slight LCOE edge over solar in windy regions. For residential use, solar is almost always cheaper because small wind turbines are expensive and inefficient.
Can I use both solar and wind at home?
Yes, but it is rare. Hybrid renewable systems pair rooftop solar with a small wind turbine to extend generation hours. Solar produces during the day; wind can generate at night. In practice, most homeowners find that adding more solar panels and a battery is more cost-effective than installing a wind turbine.
Which produces more electricity per unit of land?
Wind turbines produce far more electricity per unit of land when you measure only the turbine footprint. A single 3 MW turbine can power roughly 1,500 homes. However, wind farms need large spacing between turbines. Solar farms use land more continuously, with panels covering most of the available area. On a total-land-area basis, dense solar can match or exceed wind output in sunny regions.
Do wind turbines last longer than solar panels?
Their lifespans are nearly identical. Solar panels last 30–35 years with minimal degradation. Wind turbines last about 30 years, though gearboxes and blades may need major maintenance or replacement after 15–20 years. Solar has lower ongoing maintenance costs because it has no moving parts.
Why is solar growing faster than wind?
Solar is easier to deploy at any scale, from residential rooftops to utility farms. It also benefits from modularity: you can install 5 panels or 50,000. Wind requires large turbines, specialized installation equipment, and consistent wind resources. In 2025, solar added roughly 510 GW of new capacity globally, compared to 159 GW for wind.
Which is better for the environment: solar or wind?
Both are dramatically cleaner than fossil fuels. Wind has a slightly lower lifecycle carbon footprint per kWh because panel manufacturing is energy-intensive. However, wind turbines can affect bird and bat populations, while solar panel recycling at end-of-life is an emerging challenge. Neither source is perfect, but both reduce emissions by 95%+ compared to coal. Solar proposal software generates professional quotes in minutes.