Quick Answer
The world added 511 gigawatts of solar capacity in 2025 alone. According to IRENA's Renewable Capacity Statistics 2026 , solar now accounts for 47% of all renewable power worldwide, with total installed capacity reaching approximately 2.4 terawatts. Cons Upfront Cost. 90% cheaper than 2010; strong financing options.
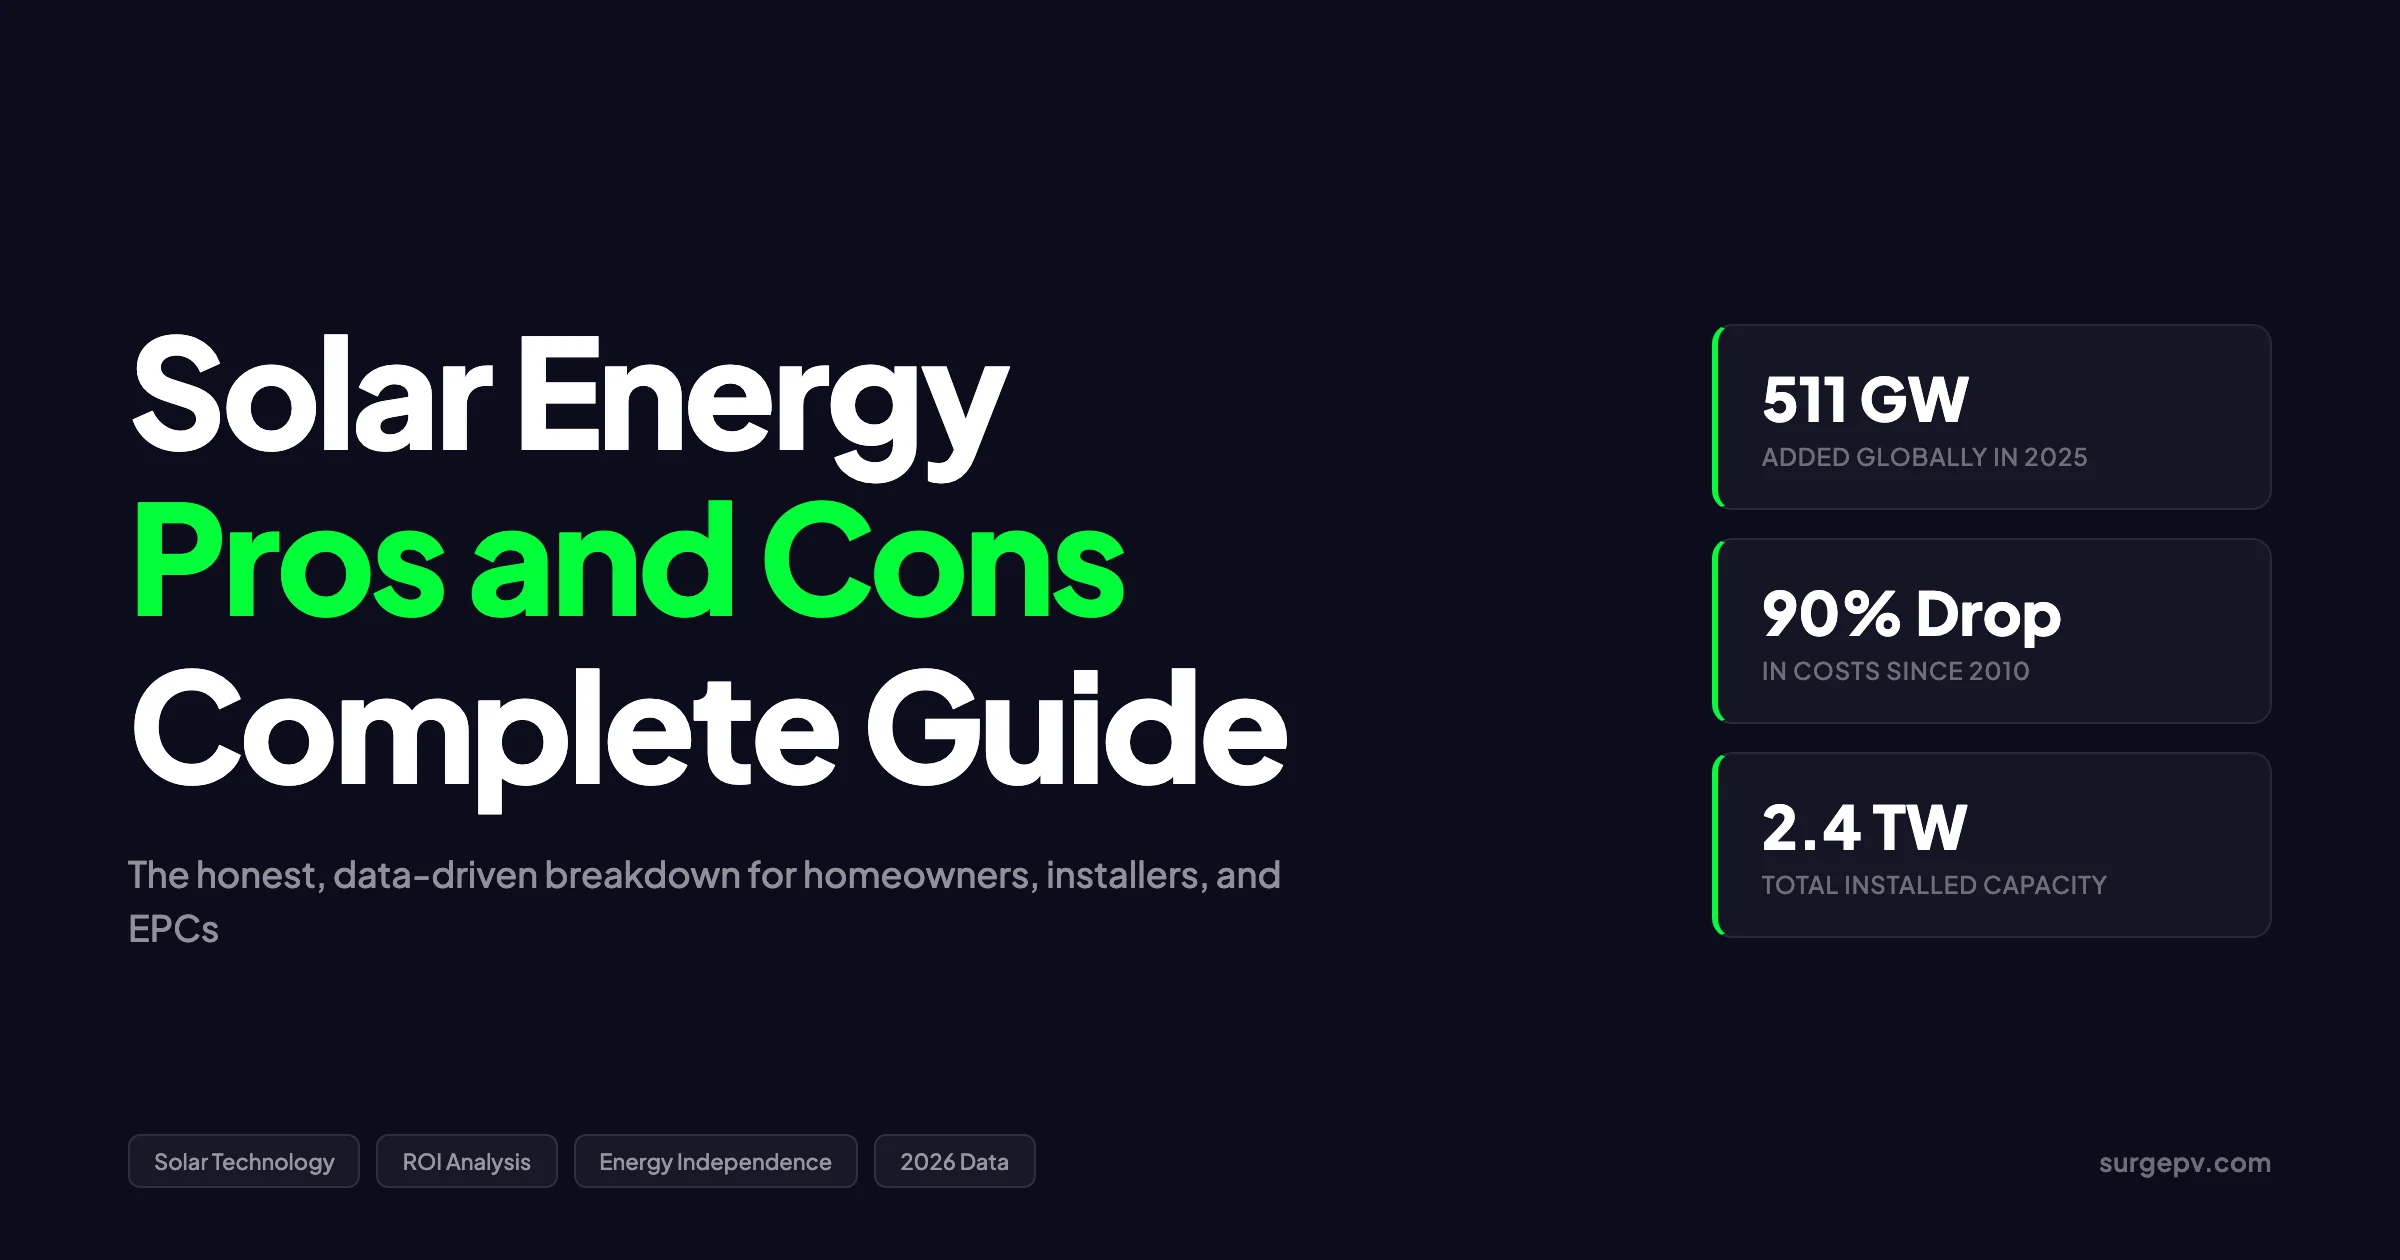
The world added 511 gigawatts of solar capacity in 2025 alone. That is more than the total installed capacity of every power plant in the United States combined. According to IRENA’s Renewable Capacity Statistics 2026, solar now accounts for 47% of all renewable power worldwide, with total installed capacity reaching approximately 2.4 terawatts. The technology is not emerging anymore. It is dominant.
The world added 511 gigawatts of solar capacity in 2025 alone. According to IRENA’s Renewable Capacity Statistics 2026 , solar now accounts for 47% of all renewable power worldwide, with total installed capacity reaching approximately 2.4 terawatts. Cons Upfront Cost.
But dominance does not mean universal suitability. A homeowner in Seattle faces a different calculation than one in Phoenix. A factory in Germany weighs different factors than a data center in India. Solar energy has real advantages that grow stronger every year. It also has real disadvantages that no amount of marketing can erase. Also see: Germany solar subsidies. Also see: Best Solar Design Software India.
This article gives the honest breakdown. Every claim includes a source. Every disadvantage gets equal weight with every advantage. Whether you are a homeowner evaluating rooftop panels, an installer advising a client, or an EPC sizing a commercial array, this guide gives you the data to make a sound decision.
TL;DR — Solar Energy Pros and Cons
Solar energy cuts electricity bills by $1,000-1,500 per year on average, pays for itself in 6-10 years, and increases home value by 4-6%. The main drawbacks are the $15,000-25,000 upfront cost, zero production at night, and the fact that not every property can support a productive array. For most homeowners with adequate sun exposure who plan to stay 7+ years, the advantages significantly outweigh the disadvantages in 2026.
In this guide:
- A side-by-side comparison of all major pros and cons
- Eight advantages with 2026 data and real-world savings figures
- Seven disadvantages that installers and buyers often underestimate
- How solar stacks up against wind, natural gas, and nuclear on cost and reliability
- Emerging solutions to solar’s biggest problems: agrivoltaics, floating solar, and advanced recycling
- A decision framework for whether solar makes sense for your specific situation Read more about Agricultural Solar Case Study. Read Agrivoltaics Design for a complete walkthrough.
For more details, see our guide on agrivoltaics systems guide.
Solar Energy Pros and Cons at a Glance
| Factor | Pros | Cons |
|---|---|---|
| Upfront Cost | 90% cheaper than 2010; strong financing options | Still $15,000-25,000 for residential systems |
| Operating Cost | Near-zero after installation | Inverter replacement every 10-15 years |
| Energy Bills | Cuts bills 50-100% depending on system size | Savings depend on local electricity rates |
| Payback Period | 6-10 years in most markets | 12-15+ years in low-insolation, low-rate markets |
| Lifespan | 25-30 years for panels | Performance degrades 0.5-0.8% per year |
| Maintenance | Minimal; no moving parts | Occasional cleaning; monitoring for faults |
| Environmental Impact | Zero operational emissions | Manufacturing carbon debt; end-of-life waste |
| Reliability | Predictable daytime generation | Zero output at night; 60-90% drop on cloudy days |
| Grid Impact | Reduces peak demand | Duck curve stress; requires grid upgrades |
| Property Value | Increases 4.1-6.9% on average | May increase property taxes in some jurisdictions |
| Space Needs | Rooftop uses existing surface | 20-40 sq meters needed for typical residential system |
| Aesthetics | Modern look; BIPV options available | Panels visible from street; some HOA restrictions |
| Energy Independence | Off-grid possible with batteries | True independence requires expensive battery storage |
| Jobs & Economy | ~4.5 million jobs globally | Supply chain concentrated in China |
The 8 Biggest Advantages of Solar Energy in 2026
1. Solar Slashes Electricity Bills
The most immediate benefit solar owners experience is a lower electricity bill. In the United States, the average residential solar system offsets 50-100% of household electricity consumption, saving $1,000-1,500 per year. In high-rate markets like California, Hawaii, and Germany, annual savings can exceed $2,000-3,000.
The economics improve every year because retail electricity rates keep rising. U.S. electricity prices increased at an average annual rate of 3-5% over the past decade. A homeowner who installs solar locks in their energy cost at today’s rate, insulating themselves from decades of price hikes. Over a 25-year panel lifespan, cumulative savings typically range from $30,000-60,000 in the U.S. and £15,000-30,000 in the UK. For the latest details on UK, see Battery Solar System Design UK.
The math is straightforward but often misunderstood. A 6 kW system in a region with 5.2 peak sun hours produces approximately 9,100 kWh per year. At $0.16 per kWh, that generation is worth $1,456 annually. At $0.30 per kWh — common in California, Germany, and Denmark — the same system saves $2,730 per year. Location and local rates matter more than system size in determining savings.
Grid-tied systems with net metering provide the simplest savings model. Excess production during sunny hours feeds into the grid and spins the meter backward. The homeowner draws from the grid at night and pays only the net difference. In markets with time-of-use rates, solar production aligns well with peak pricing periods (midday to early afternoon), maximizing the value of every kilowatt-hour generated.
Pro Tip
Run a 25-year cash flow projection for every client, not just a simple payback calculation. Show the cumulative savings at 3%, 4%, and 5% annual electricity rate escalation. The difference between a static rate assumption and a realistic escalation model can be $10,000-20,000 in projected savings.
2. Solar Pays for Itself Faster Than Ever
The payback period for residential solar has fallen from 15-20 years in 2010 to 6-10 years in 2026. This improvement comes from two directions: system costs dropped 90% since 2010, while electricity rates rose steadily. The intersection of falling costs and rising rates is what makes solar compelling today.
| Market | Typical System Size | Installed Cost (Pre-Incentive) | Installed Cost (Post-Incentive) | Annual Savings | Payback Period |
|---|---|---|---|---|---|
| U.S. (national avg) | 8 kW | $20,000-24,000 | $14,000-17,000 | $1,200-1,800 | 7-10 years |
| U.S. (California) | 8 kW | $22,000-26,000 | $15,000-18,000 | $2,500-3,500 | 5-7 years |
| UK | 4 kW | £8,000-12,000 | £8,000-12,000 | £600-1,000 | 8-12 years |
| Germany | 8 kW | €16,000-20,000 | €16,000-20,000 | €1,500-2,500 | 7-10 years |
| Australia | 6.6 kW | AUD 8,000-12,000 | AUD 8,000-12,000 | AUD 1,200-1,800 | 5-8 years |
| India | 5 kW | INR 250,000-350,000 | INR 175,000-245,000 | INR 40,000-60,000 | 5-7 years |
After payback, the system generates essentially free electricity for the remaining 15-20 years of its life. A system with a 7-year payback and 25-year lifespan delivers 18 years of positive cash flow. At $1,500 per year in savings, that is $27,000 in post-payback value on a $17,000 investment.
The generation and financial tool in professional solar design software calculates these projections automatically, factoring in local incentives, degradation rates, and electricity price escalation. Manual spreadsheet calculations often miss compounding effects that significantly alter the financial picture. Most professional solar software includes these financial models as standard.
3. Solar Increases Property Value
Homes with solar installations sell for more and sell faster. A 2025 study by Zillow found that homes with solar sell for an average of 4.1% more than comparable non-solar homes. In premium markets, the premium reaches 6.9%. Solar homes also spend 20% less time on the market. EnergySage data confirms this premium across multiple markets and housing types.
The value proposition is simple: buyers recognize that a solar-equipped home comes with a pre-paid energy infrastructure. A $17,000 solar system on a home that saves $1,500 per year represents an asset with an 8.8% annual return. Buyers will pay a premium for that cash flow, just as they pay a premium for a renovated kitchen or new roof.
The premium varies by market. In California, where electricity rates exceed $0.30 per kWh and solar penetration is high, buyers expect solar and discount homes without it. In Texas, where rates are lower and solar is less common, the premium is smaller but still positive. The direction is consistent: solar adds value in every market where it has been studied.
One caveat: leased solar panels do not add the same value as owned systems. A lease creates a monthly obligation that buyers may not want. A power purchase agreement (PPA) similarly complicates the transaction. For maximum property value impact, own the system outright or finance it with a loan that can be paid off before sale.
4. Solar Provides Energy Independence
Grid-tied solar reduces dependence on utility companies and volatile energy markets. For homeowners, that means protection from the 3-5% annual electricity rate increases that have been standard for decades. For businesses, it means predictable energy costs that improve financial forecasting.
With battery storage, energy independence extends to nighttime and grid outages. A typical Tesla Powerwall 3 stores 13.5 kWh of energy, enough to power essential loads — refrigerator, lights, internet, and a few outlets — for 12-24 hours during an outage. Multiple batteries can extend this to multi-day autonomy. Read Adding Battery Storage Services for a complete walkthrough.
The value of independence is not just financial. During extreme weather events, solar-plus-storage systems keep critical systems running when the grid fails. In California, where Public Safety Power Shutoffs (PSPS) have left millions without electricity during wildfire season, solar-plus-battery installations surged. In Texas, after the 2021 winter storm caused widespread blackouts, residential battery sales increased sharply.
True off-grid independence requires larger battery banks and typically a backup generator for extended cloudy periods. The cost for a fully off-grid residential system runs $50,000-100,000+, depending on energy needs and climate. For most homeowners, grid-tied solar with battery backup offers the best balance of independence and cost.
5. Solar Creates Zero Operational Emissions
Solar panels produce no greenhouse gases, air pollutants, water pollutants, or noise during operation. A typical 6 kW residential system offsets approximately 100 tonnes of CO2 over 25 years. That is equivalent to planting 2,500 trees or not driving a car for 250,000 miles.
The environmental benefit scales with system size. A 500 kW commercial rooftop system offsets approximately 8,300 tonnes of CO2 over its lifetime. A 100 MW utility-scale solar farm offsets approximately 1.7 million tonnes. These are not theoretical numbers — they represent actual fossil fuel generation displaced by clean solar output.
Lifecycle analysis shows that the energy payback time for solar panels — the time required to generate the energy that went into manufacturing them — is 1-4 years depending on technology and manufacturing location. With a 25-30 year operational life, panels produce 6-25 times more energy than was consumed in their creation.
The environmental case for solar is strongest when compared to the alternatives. Coal-fired power plants emit approximately 820 grams of CO2 per kWh. Natural gas combined-cycle plants emit approximately 490 grams per kWh. Solar emits zero grams per kWh during operation. Even accounting for manufacturing emissions, solar’s lifecycle emissions are 40-50 grams of CO2 per kWh — 10-20 times lower than natural gas.
Key Takeaway
A 6 kW residential solar system offsets the same CO2 as not driving a car for 250,000 miles. The manufacturing carbon debt is paid back in 1-4 years. Over a 25-year lifespan, the net environmental benefit is enormous.
6. Solar Technology Keeps Improving
Commercial solar panel efficiency has climbed from approximately 15% in 2010 to 22-24% in 2026. The best laboratory cells — tandem silicon-perovskite designs — have reached 34.85% efficiency. These gains mean more power from the same roof area, which matters on space-constrained residential installations.
For more details, see our guide on solar panel efficiency ranking.
The cost decline is even more dramatic. Residential solar in the U.S. cost approximately $8.66 per watt in 2010. In 2026, it costs $2.00-3.03 per watt installed — a 65-77% reduction. Utility-scale solar is even cheaper at approximately 4.3 cents per kWh globally, making it the lowest-cost source of new electricity generation in most markets. For Global-specific compliance details, see Global net-metering-by-country.
Beyond efficiency and cost, reliability has improved. Panel degradation rates have fallen from 0.8-1.0% per year in early generations to 0.5-0.6% per year for modern monocrystalline PERC and TOPCon cells. Inverter reliability has improved with the shift from string inverters to microinverters and power optimizers that isolate fault conditions. Standard product warranties have extended from 10-12 years to 25-30 years.
Emerging technologies promise further gains. Bifacial panels capture reflected light from the ground and can increase yield 5-20% depending on surface albedo. Tandem cells combining silicon and perovskite layers are entering commercial production and promise 25-30% efficiency at mainstream prices. Agrivoltaic systems that elevate panels above crops create dual land use. These innovations mean the solar of 2030 will be significantly better than the solar of 2026, which is already a mature, reliable technology.
7. Solar Requires Minimal Maintenance
Solar panels have no moving parts. There are no bearings to grease, no belts to replace, no fluids to top up. This simplicity translates to minimal maintenance requirements and high reliability.
Standard maintenance includes:
- Visual inspection for physical damage or debris accumulation (annually)
- Cleaning to remove dust, pollen, bird droppings, and pollution (1-4 times per year depending on climate)
- Monitoring system performance via software to detect underperformance (continuous)
- Inverter replacement after 10-15 years (one-time cost of $1,000-3,000)
Rain cleans panels adequately in most climates. In arid regions or areas with heavy pollen, occasional washing with a garden hose or professional cleaning service improves output 5-15%. The cleaning cost is typically $100-300 per service for a residential system — a small fraction of annual savings.
Performance monitoring has become standard. Modern solar software tracks every panel’s output in real time and flags underperformance. A shaded panel, a failed optimizer, or a soiling issue triggers an alert before the homeowner notices it on their bill. This visibility was unavailable a decade ago and has transformed maintenance from reactive to predictive.
8. Solar Creates Jobs and Drives Economic Growth
The solar industry employed approximately 4.5 million people worldwide in 2025, according to IRENA. That makes solar one of the largest employers in the energy sector, ahead of coal and competitive with oil and gas in total workforce size.
Job categories span the full value chain:
- Manufacturing: cell and module production, inverter assembly, racking systems
- Engineering: system design, electrical design, structural analysis
- Installation: roofers, electricians, project managers
- Sales and marketing: customer acquisition, proposal development
- Operations and maintenance: monitoring, cleaning, repair services
- Financing: loan origination, tax equity structuring, insurance
In the United States, solar installation is one of the fastest-growing occupations, with median pay exceeding the national average. The Inflation Reduction Act’s domestic content bonuses and manufacturing credits have spurred a wave of new factory announcements, with over 100 GW of announced domestic module manufacturing capacity.
The economic multiplier effect extends beyond direct jobs. Every dollar spent on solar installation generates additional economic activity in local economies through supplier purchases, contractor wages, and indirect services. For rural communities, utility-scale solar farms provide lease income to landowners and tax revenue to local governments — often replacing declining agricultural income.
The 7 Real Disadvantages of Solar Energy in 2026
1. High Upfront Cost Remains the #1 Barrier
Despite a 90% cost decline since 2010, solar still requires a significant capital outlay. A typical 8 kW residential system in the U.S. costs $16,000-24,000 before incentives. After the 30% federal Investment Tax Credit (ITC), the net cost is $11,000-17,000. That is still more than many households can pay in cash.
Financing options exist but add complexity and cost:
- Solar loans spread payments over 10-25 years but add $3,000-8,000 in interest
- Leases require no upfront payment but eliminate ownership benefits and property value increases
- Power Purchase Agreements (PPAs) lock in a fixed rate but the homeowner owns nothing at term end
- Home equity loans offer lower interest rates but put the home at risk
The upfront cost is particularly prohibitive in developing markets. In India, where government subsidies reduce costs significantly, a 5 kW system still requires INR 175,000-245,000 ($2,000-2,800) out of pocket after subsidies. For rural households with limited savings, this remains a major hurdle. Read more about 5kW Solar Panel Price in India.
Battery storage compounds the cost issue. A Tesla Powerwall 3 adds $7,000-10,000 to the system price. Two batteries for whole-home backup can add $15,000-20,000. While battery prices have fallen 80% since 2010, they still represent a significant additional investment that many homeowners skip — leaving them without backup power during outages.
2. Solar Only Works When the Sun Shines
Intermittency is solar’s fundamental physical limitation. Panels produce zero power at night. On cloudy days, output drops to 10-25% of rated capacity. Seasonal variation means December production can be 60-80% lower than June production at mid-latitudes.
This intermittency creates the duck curve — the chart of net electricity demand after solar generation is subtracted. In California, the duck curve shows a steep ramp-up in grid demand in the late afternoon as solar output declines just as people return home and turn on appliances. The curve’s belly (midday low demand) and neck (evening ramp) create grid management challenges that require fast-ramping natural gas plants or battery storage to address.
For individual homeowners, intermittency means grid dependence. A standard grid-tied solar system shuts down during grid outages for safety reasons — even when the sun is shining. This counterintuitive behavior protects utility workers but means solar alone does not provide energy security. Only systems with battery backup and islanding inverters maintain power during outages.
Capacity factor quantifies intermittency’s impact. A solar plant in Arizona operates at approximately 26% capacity factor — it produces 26% of its theoretical maximum output over a year. In Germany, the capacity factor is approximately 11%. In the UK, it is approximately 10%. These numbers do not mean solar is bad; they mean system sizing and financial projections must account for realistic production, not nameplate capacity.
The Capacity Factor Reality
A 10 kW solar system does not produce 10 kW continuously. In Arizona, it averages 2.6 kW over the year. In Germany, it averages 1.1 kW. These are not defects. They are physics. Good solar design software accounts for capacity factor automatically when sizing systems.
3. Not Every Roof or Property Is Suitable
Solar requires adequate unshaded roof area, suitable orientation, and structural integrity. Not every property meets these criteria.
Roof orientation and tilt: In the Northern Hemisphere, south-facing roofs at a tilt close to latitude capture the most annual insolation. East- and west-facing roofs produce 15-20% less annually. North-facing roofs are generally unsuitable. Flat roofs work but require tilted racking systems that add cost.
Shading: Even partial shading from trees, chimneys, or neighboring buildings can dramatically reduce system output. A single shaded module in a string can drag down the entire string’s performance unless optimizers or microinverters are installed. Shade analysis using solar shadow analysis software is essential before any installation commitment.
Roof condition: Solar panels add 2-4 pounds per square foot of distributed load. Aging roofs may need replacement before panel installation. Removing and reinstalling panels to replace a roof costs $2,000-5,000 — an expense that can be avoided by replacing the roof first.
Space requirements: A typical 6 kW residential system requires 20-28 square meters of roof area. Smaller homes, townhouses with shared roofs, and properties with complex roof geometries may not have enough suitable space. Ground-mount systems are an alternative but require additional land.
HOA and aesthetic restrictions: Some homeowners associations restrict visible solar installations. Historic districts and conservation areas may prohibit panel mounting altogether. These restrictions are declining as solar becomes mainstream, but they still block installations in some communities.
4. Energy Storage Adds Significant Cost
Batteries solve solar’s intermittency problem but introduce their own costs and complexities. A residential lithium-ion battery system adds $7,000-15,000 to the project cost, extending payback periods by 3-5 years.
Battery lifespans are shorter than panel lifespans. Lithium iron phosphate (LFP) batteries — the dominant chemistry for residential storage — typically last 10-15 years with 4,000-6,000 cycles. This means a homeowner who installs panels with a 25-year warranty will likely replace the battery once during the system’s life.
Battery degradation is also a factor. After 10 years, an LFP battery may retain only 80% of its original capacity. This gradual decline reduces the backup duration and the economic value of time-shifting energy from low-rate to high-rate periods.
For commercial and utility-scale systems, storage costs are lower per kWh but still significant. Utility-scale lithium-ion battery storage costs approximately $300-600 per kWh installed. A 100 MW / 400 MWh system costs $120-240 million. These costs are falling — down 70% since 2015 — but they remain a major component of any solar-plus-storage project.
The economics of storage depend heavily on local rate structures. In markets with time-of-use rates and high peak pricing (California, Hawaii, parts of Australia), batteries can pay for themselves by shifting solar generation from midday (low rates) to evening (high rates). In markets with flat rates, the economic case for batteries is weaker unless backup power is the primary motivation. For Australia-specific compliance details, see Australia comparisons/lgc-vs-stc.
5. Manufacturing Has an Environmental Footprint
Solar panels are not born clean. Their production involves energy-intensive processes, mining of raw materials, and the use of toxic chemicals. The silicon purification process requires temperatures exceeding 1,400°C. Aluminum frames require bauxite mining and smelting. Silver pastes for electrical contacts require silver mining.
The carbon debt of panel manufacturing varies by manufacturing location. Panels made in China, where coal dominates the electricity mix, have a higher manufacturing carbon footprint than panels made in Europe or the U.S. with cleaner grids. The energy payback time ranges from 1 year for high-efficiency European panels to 4 years for standard Chinese panels in coal-heavy manufacturing regions. Also see: European Solar Incentives.
Chemical use in manufacturing includes hydrofluoric acid, trichloroethane, and cadmium compounds in some thin-film technologies. While modern facilities have strict waste management protocols, accidents and improper disposal in less regulated regions have caused localized environmental damage.
Mining impacts extend beyond carbon. Quartz mining for silicon, silver mining for conductive pastes, and aluminum mining for frames all disturb land, consume water, and generate waste rock. The total material intensity of solar is lower than coal per unit of energy generated over a lifecycle basis, but it is not zero.
The counterargument is quantitative: over a 25-year lifespan, a solar panel generates 6-25 times more energy than was consumed in its manufacture. The net environmental balance is overwhelmingly positive. But the manufacturing footprint is real, and it is concentrated in the first year of the panel’s life rather than spread over decades like fossil fuel emissions.
6. Grid Integration Costs Are Rising
As solar penetration increases, the costs of integrating it into the electrical grid grow. These costs do not appear on a homeowner’s solar quote but are paid by all ratepayers through utility bills and grid infrastructure investments.
Transmission upgrades: Solar-rich regions often lack sufficient transmission capacity to move power from where it is generated (deserts, rural areas) to where it is consumed (cities). Building new transmission lines costs $1-4 million per mile and faces years of permitting delays.
Curtailment: When solar generation exceeds local demand and transmission capacity, grid operators curtail — disconnect — solar farms. California curtailed over 2.4 million MWh of solar in 2024, enough to power 350,000 homes for a year. Every curtailed MWh represents wasted investment.
Ancillary services: The duck curve requires fast-ramping resources to balance the grid. These services — frequency regulation, voltage support, spinning reserves — have costs that increase as solar penetration rises. In California, the evening ramp requirement now exceeds 14 GW in summer months, requiring gas peaker plants or massive battery installations.
Distribution system upgrades: High concentrations of rooftop solar in residential neighborhoods can create voltage rise on distribution feeders. Utilities must upgrade transformers, capacitors, and switchgear to handle bidirectional power flows. These costs are socialized across all ratepayers, including those without solar.
These integration challenges are solvable. They require storage, demand response, upgraded transmission, and smarter grid management. But solving them costs money, and that money must come from somewhere. The hidden grid integration costs of high solar penetration are a legitimate concern that pro-solar advocates sometimes gloss over.
7. End-of-Life Panel Waste Is a Growing Problem
Solar panels last 25-30 years, which means the first waves of installed panels are approaching retirement. By 2050, the International Renewable Energy Agency (IRENA) projects the world could have 78 million tonnes of cumulative solar panel waste if recycling infrastructure does not scale.
Panels are 90-95% recyclable by weight. Glass constitutes 70-80% of panel weight and is easily recyclable. Aluminum frames are nearly 100% recyclable. Silicon cells can be chemically processed and reused. Silver, copper, and other metals can be recovered. The technology for recycling exists. The economics do not always work.
Current recycling costs exceed the value of recovered materials in most markets. A recycled panel yields $3-12 worth of materials but costs $15-45 to process. This negative economics means most decommissioned panels today end up in landfills rather than recycling facilities.
The European Union leads on this front. The WEEE directive mandates solar panel recycling and requires manufacturers to finance end-of-life collection and processing. Several EU countries have operational recycling facilities. The U.S. has no federal panel recycling mandate, though some states (Washington, California) are developing frameworks.
The waste problem is manageable if addressed proactively. Panel design standards can mandate recyclability. Extended producer responsibility (EPR) programs can fund recycling infrastructure. Chemical recycling technologies can improve material recovery rates and economics. But doing nothing leads to a waste stream that undermines solar’s environmental credibility.
How Solar Compares to Other Energy Sources
Solar vs. Wind
Wind and solar are the two dominant renewable energy sources, and they complement each other well. Wind tends to be stronger at night and in winter — exactly when solar is weakest. Hybrid wind-solar projects are increasingly common.
| Factor | Solar | Wind |
|---|---|---|
| Capacity Factor | 10-26% | 25-45% |
| Resource Availability | Predictable by latitude | Highly site-specific |
| Land Use | 3.5-10 acres per MW | 30-141 acres per MW (including spacing) |
| Maintenance | Minimal (no moving parts) | Moderate (gearboxes, blades, turbines) |
| Noise | Silent | 35-45 dB at 500m |
| Visual Impact | Low profile on roofs | Highly visible turbines |
| Wildlife Impact | Minimal | Bird and bat collisions |
| Cost (LCOE) | 4-6 cents/kWh | 3-5 cents/kWh |
| Scalability | Residential to utility | Utility-scale dominates |
Solar wins on distributed generation, silent operation, and minimal wildlife impact. Wind wins on capacity factor, land efficiency per MW of generation, and lower LCOE at utility scale. The best renewable strategy often combines both.
Solar vs. Fossil Fuels
The economic comparison between solar and fossil fuels has shifted dramatically. In 2026, new utility-scale solar is cheaper than new coal, new natural gas, and even existing coal in many markets.
| Technology | LCOE (cents/kWh) | Fuel Cost Risk | Carbon Emissions (g CO2/kWh) |
|---|---|---|---|
| Utility Solar | 4-6 | None | 40-50 (lifecycle) |
| Onshore Wind | 3-5 | None | 10-15 (lifecycle) |
| Natural Gas Combined-Cycle | 5-8 | High (volatile) | 490 |
| Coal | 8-18 | Moderate | 820 |
| Nuclear | 13-20 | Low (uranium) | 12-15 (lifecycle) |
Solar’s zero fuel cost means its LCOE is locked in at installation. A gas plant’s LCOE depends on natural gas prices, which have ranged from $2 to $15 per MMBtu over the past decade. When gas prices spike, solar’s cost advantage widens. When gas prices fall, the gap narrows. But solar’s cost trajectory is downward while fossil fuel costs are volatile with an upward long-term trend.
The comparison is more nuanced for existing fossil fuel plants. A coal plant that is already built and depreciated may produce power at 3-4 cents/kWh in operating costs. Retiring it early to build solar requires writing off the remaining capital, which utilities resist. This is why regulatory mandates and carbon pricing are often necessary to accelerate the transition.
Solar vs. Nuclear
Nuclear provides baseload power with zero carbon emissions during operation — an attractive combination. But nuclear has its own challenges that make it a poor fit for many applications.
Nuclear plants cost $6,000-10,000 per kW to build — 3-5 times more than utility-scale solar. Construction takes 5-10 years versus 6-18 months for solar. Cost overruns are common: the Vogtle plant in Georgia cost $35 billion for 2.2 GW, more than double its original budget. Small modular reactors (SMRs) promise lower costs but remain unproven at commercial scale.
Nuclear’s advantage is reliability. A nuclear plant runs at 90%+ capacity factor, 24 hours a day, regardless of weather. Solar’s capacity factor is 10-26% and varies by season and cloud cover. For grids that need consistent baseload, nuclear fills a role that solar cannot without massive storage.
The practical choice is not either/or. France generates 70% of its electricity from nuclear and is adding solar to diversify. China is building both nuclear and solar at record pace. For residential and commercial applications, solar is the only practical choice — no one puts a nuclear reactor on their roof. Also see: France solar feed-in tariffs.
Emerging Solutions to Solar’s Drawbacks
Agrivoltaics: Farming and Energy on the Same Land
Agrivoltaics — elevating solar panels above crops — turns solar’s land-use challenge into a dual-benefit opportunity. Panels mounted 3-5 meters above the ground generate electricity while crops grow underneath. The partial shade reduces evaporation, improves water efficiency, and can increase yields for shade-tolerant crops like lettuce, tomatoes, and berries.
Research from the University of Arizona found that cherry tomatoes grown under agrivoltaic panels produced 65% more fruit while using 65% less water. The panels provided shade that reduced heat stress on the plants. In Japan, where land is scarce, over 2,000 agrivoltaic installations are operational, mostly on rice paddies and fruit orchards.
The economics work because the land generates two revenue streams: crop sales and electricity sales. For farmers facing volatile commodity prices, the electricity income provides a stable base. For solar developers, agricultural land is often cheaper and more available than industrial or desert sites.
Challenges include higher installation costs for elevated structures, reduced panel density per hectare, and the need to match panel spacing to crop requirements and equipment access. But agrivoltaics is scaling rapidly, with pilot projects across Europe, the U.S., and Asia demonstrating viability for multiple crop types.
Floating Solar Opens New Surfaces
Floating photovoltaic (FPV) systems mount panels on reservoirs, lakes, and ponds. They address land scarcity without competing for agricultural or development space.
The global floating solar market exceeded 5.5 GW by the end of 2025. China leads with the 320 MW Anhui FPV plant on a former coal mining subsidence lake. India has mandated FPV on existing hydropower reservoirs. Southeast Asia is adding FPV on irrigation reservoirs.
Floating solar has unexpected benefits. Water cooling improves panel efficiency by 5-15% compared to land-mounted systems. Reduced evaporation from covered reservoirs conserves water — critical in drought-prone regions. The floating platforms reduce algae growth by blocking sunlight penetration.
The technology is mature. HDPE floating platforms, corrosion-resistant anchoring systems, and cable management designed for wet environments have been proven over a decade of deployments. Costs are 10-20% higher than ground-mount but falling as standardized systems emerge.
Building-Integrated Photovoltaics Remove Aesthetic Concerns
Building-integrated photovoltaics (BIPV) replace conventional building materials with solar-generating equivalents. Solar roof tiles replace asphalt shingles. Solar facades replace cladding panels. Solar canopies replace parking lot covers.
BIPV addresses the aesthetic objection that keeps some homeowners and architects from embracing solar. A Tesla Solar Roof looks like a premium roof from the street while generating electricity. Solar facades on commercial buildings turn walls into power generators without the visual impact of bolt-on panels.
The tradeoff is cost. BIPV systems cost 30-100% more per watt than standard rack-mounted panels. Solar roof tiles cost $15-25 per square foot installed, compared to $4-8 per square foot for standard panels. The gap is narrowing as manufacturing scales and building codes increasingly mandate solar-ready construction.
For new construction, BIPV often makes financial sense. The incremental cost over conventional materials is smaller than the full replacement cost of retrofitting. In California, where new homes must include solar, BIPV options are becoming standard offerings from major builders.
Advanced Recycling Tackles End-of-Life Waste
New recycling technologies promise to make panel recycling economically viable. Veolia opened Europe’s first dedicated solar panel recycling plant in France in 2018, processing 1,800 tonnes per year. ROSI Solar in France uses advanced pyrolysis to recover high-purity silicon and silver from decommissioned panels.
The key innovation is moving beyond mechanical shredding — which destroys valuable materials — to chemical and thermal processes that separate components intact. Silicon wafers can be cleaned and reused in new cells. Silver can be recovered at 95%+ purity. Glass can be recycled into new panels or construction materials.
Regulatory pressure is driving investment. The EU’s WEEE directive requires 85% recycling and 80% recovery rates for solar panels. As the first generation of panels reaches end of life in the late 2020s and 2030s, economies of scale will improve recycling economics. By 2040, recycled materials could supply 10-20% of solar manufacturing inputs.
Smart Inverters and Grid Services Address Intermittency
Modern inverters do more than convert DC to AC. Smart inverters provide grid services that help integrate high solar penetration without destabilizing the system.
For more details, see our guide on virtual power plant design.
Volt-VAR control: Smart inverters adjust reactive power output to maintain voltage within acceptable ranges on distribution feeders. This reduces the need for utility capacitor banks and voltage regulators.
Frequency-Watt response: Inverters can reduce output when grid frequency rises above nominal, preventing over-frequency conditions during high solar, low-demand periods.
Ramp rate control: Inverters can limit how quickly output changes when clouds pass, reducing the volatility that grid operators must manage.
Grid-forming capability: Advanced inverters can establish and stabilize grid voltage and frequency during outages, enabling microgrids and improving resilience.
These capabilities are increasingly mandated by grid codes. California’s Rule 21, Hawaii’s Rule 14H, and similar standards in Germany and Australia require smart inverter functions. As distributed solar grows, these grid services become essential to maintaining power quality and reliability.
Design Solar Projects with Confidence
SurgePV’s solar design platform integrates insolation data, shading analysis, and financial modeling in one platform. Size systems accurately, model production realistically, and generate proposals that close deals.
Book a DemoNo commitment required · 20 minutes · Live project walkthrough
For a direct comparison, see Arka 360 vs SurgePV.
Is Solar Worth It? A Decision Framework
Solar is not the right choice for everyone. Use this framework to evaluate whether it makes sense for a specific property and owner.
Geographic Suitability
| Factor | Good for Solar | Poor for Solar |
|---|---|---|
| Annual insolation | Above 1,300 kWh/m²/year | Below 1,000 kWh/m²/year |
| Peak sun hours | Above 3.5 hours/day | Below 2.5 hours/day |
| Cloud cover | Mostly clear, occasional clouds | Persistent heavy cloud cover |
| Latitude | 15-40° (optimal) | Above 60° or equatorial with heavy monsoon |
Use the Global Solar Atlas or NREL’s PVWatts to check insolation for any address. Do not rely on regional averages. A property on a sunny hillside 5 km from a foggy coastal town can have 20% more insolation than the town itself.
Financial Checklist
- Do you own the property? Renters generally cannot install solar. Some jurisdictions allow portable or balcony solar for renters, but output is limited.
- Will you stay 7+ years? If you plan to move within 5 years, you may not achieve payback unless the solar premium increases your sale price enough to recover the investment.
- What are your current electricity rates? At $0.08 per kWh (parts of the U.S. Midwest), solar economics are marginal. At $0.25+ per kWh (California, Hawaii, Germany, Denmark), solar is compelling.
- Do you have access to incentives? The 30% U.S. federal ITC, state rebates, SRECs, and net metering policies significantly improve economics. Check Database of State Incentives for Renewables and Efficiency (DSIRE) for U.S. incentives.
- Can you afford the upfront cost or qualify for financing? Cash purchase delivers the best returns. Loans add interest but still yield positive cash flow in most markets. Leases and PPAs offer lower returns but require no capital.
Property Assessment Criteria
- Roof age and condition: If the roof needs replacement within 10 years, replace it before installing solar.
- Roof orientation and tilt: South-facing within 30° of true south is ideal. East and west work at 15-20% lower annual yield. North-facing is generally unsuitable in the Northern Hemisphere.
- Shading: Walk the property at different times of day. Trees grow — a sapling that casts no shade today may block significant production in 10 years. Use professional solar shadow analysis software for accurate assessment.
- Roof space: Count available unobstructed area. A 6 kW system needs 20-28 square meters. An 8 kW system needs 28-38 square meters.
- Structural capacity: Most modern roofs can handle solar loads, but older or damaged roofs may need reinforcement.
When Solar Does NOT Make Sense
- Renters without landlord permission or properties with short-term leases
- Heavily shaded properties where tree removal is not an option
- North-facing roofs in the Northern Hemisphere with no alternative mounting
- Properties with very low electricity rates (under $0.08/kWh) and low insolation
- Homeowners planning to move within 3-5 years who cannot recover value
- Properties with HOA or historic district restrictions that prohibit visible panels
- Owners who cannot afford upfront costs and cannot qualify for favorable financing
When Solar Is a Clear Win
- Homeowners in high-rate markets ($0.20+/kWh) with good sun exposure
- Properties with south-facing roofs and minimal shading
- Owners planning to stay 10+ years who can capture full payback and post-payback savings
- Businesses with high daytime electricity consumption that aligns with solar production
- Rural properties with unreliable grid access where solar-plus-battery provides energy security
- Environmental-motivated buyers who value emission reductions alongside financial returns
The Bottom Line
Solar energy is the fastest-growing power source in human history. In 2025, the world added 511 GW of solar — more than the total installed capacity of every country except China. Costs have dropped 90% since 2010. Panel efficiency has climbed from 15% to 22-24%. Payback periods have fallen from 15-20 years to 6-10 years. The technology is mature, proven, and economically dominant. The IEA’s Electricity 2026 report confirms that renewables will overtake coal as the world’s top source of electricity by 2026 at the latest.
The advantages are substantial: electricity bill savings of $1,000-1,500 per year, property value increases of 4-6%, energy independence from volatile utility rates, zero operational emissions, minimal maintenance, and a thriving job market. For most property owners with adequate sun exposure, solar is one of the best investments available in 2026.
The disadvantages are real but increasingly manageable. Upfront costs remain high but are offset by financing options and strong returns. Intermittency is addressed by grid integration, battery storage, and complementary technologies. Manufacturing impacts are offset within 1-4 years of operation. End-of-life waste is a solvable problem with emerging recycling infrastructure.
The honest verdict: solar is not perfect, but it is better than the alternatives for most applications. The disadvantages are engineering and economics problems with known solutions. The disadvantages of not going solar — continued exposure to rising rates and ongoing carbon emissions — are problems that compound indefinitely.
Three actions to take from this guide:
-
Check your property’s solar potential. Use Global Solar Atlas or PVWatts to find your location’s insolation. Walk your roof and assess shading, orientation, and available space. The data takes 10 minutes to gather and determines everything else.
-
Run the numbers for your specific situation. Do not rely on national averages. Calculate payback using your actual electricity rate, your actual consumption, and available local incentives. If payback exceeds 12 years, consider waiting for further cost declines or focus on efficiency improvements first.
-
Get multiple quotes and compare apples to apples. Quotes vary widely in equipment quality, warranty terms, and installation practices. A $15,000 quote with premium panels and a 25-year warranty may deliver better value than a $12,000 quote with lower-tier equipment and a 10-year warranty. Ask about panel degradation rates, inverter warranties, and monitoring capabilities.
If you design or sell solar for a living, accurate production estimates and professional proposals are your competitive edge. solar proposal software that integrates real insolation data, shading analysis, and financial modeling helps you deliver quotes that win deals and hold up over 25 years.
Frequently Asked Questions
What are the main advantages of solar energy?
Solar energy reduces electricity bills by $1,000-1,500 per year on average, pays for itself in 6-10 years, increases property value by 4-6%, produces zero emissions during operation, requires minimal maintenance, and creates energy independence from grid price volatility.
What are the main disadvantages of solar energy?
The upfront cost of $15,000-25,000 for a residential system is the biggest barrier. Solar only generates power during daylight hours, output drops 60-90% on cloudy days, not all roofs are suitable, battery storage adds $7,000-15,000, and panel manufacturing creates a carbon debt that takes 1-4 years to offset.
Is solar energy worth it in 2026?
For most homeowners with adequate sun exposure who plan to stay 7+ years, solar is worth it. Costs have dropped 90% since 2010, payback periods average 6-10 years, and electricity rates continue rising 3-5% annually. The exceptions are renters, homes with heavy shading, and properties with north-facing roofs in the Northern Hemisphere.
How long do solar panels last?
Quality solar panels last 25-30 years with minimal degradation. Most manufacturers guarantee at least 80% of original output after 25 years. Inverters typically need replacement after 10-15 years. The physical panels often continue producing at reduced capacity well beyond their warranty period.
Does solar work on cloudy days?
Yes, but at reduced output. Solar panels produce 10-25% of rated capacity on heavily overcast days because diffuse sky radiation still reaches the cells. In cloudy climates like the UK or Pacific Northwest, annual production is lower but systems remain economically viable due to high retail electricity rates.
How much does solar cost in 2026?
In the United States, a typical 8 kW residential system costs $16,000-24,000 before incentives and $11,000-17,000 after the 30% federal tax credit. In the UK, an 8 kW system runs £8,000-15,000. Utility-scale solar costs approximately 4-6 cents per kWh, cheaper than new coal or gas plants.
For more details, see our guide on solar LCOE by country.
Can solar panels increase my home value?
Yes. Studies show homes with solar sell for 4.1-6.9% more than comparable non-solar homes and sell 20% faster on average. The premium varies by location, with higher-value markets like California and Hawaii seeing the largest increases.
What happens to solar panels at end of life?
Solar panels are 90-95% recyclable by weight. Glass, aluminum frames, and silicon cells can be recovered and reused. However, recycling infrastructure is still developing. The EU mandates panel recycling under the WEEE directive. By 2050, the world could have 78 million tonnes of cumulative solar waste if recycling does not scale.


