Solar assets only generate returns when they are running. Yet many fleets still rely on scattered manufacturer apps, delayed email alerts, and spreadsheets to track performance. A PV monitoring platform solves this by pulling production, environmental, and fault data into one place so operators can spot issues fast and prove performance to owners, lenders, and insurers.
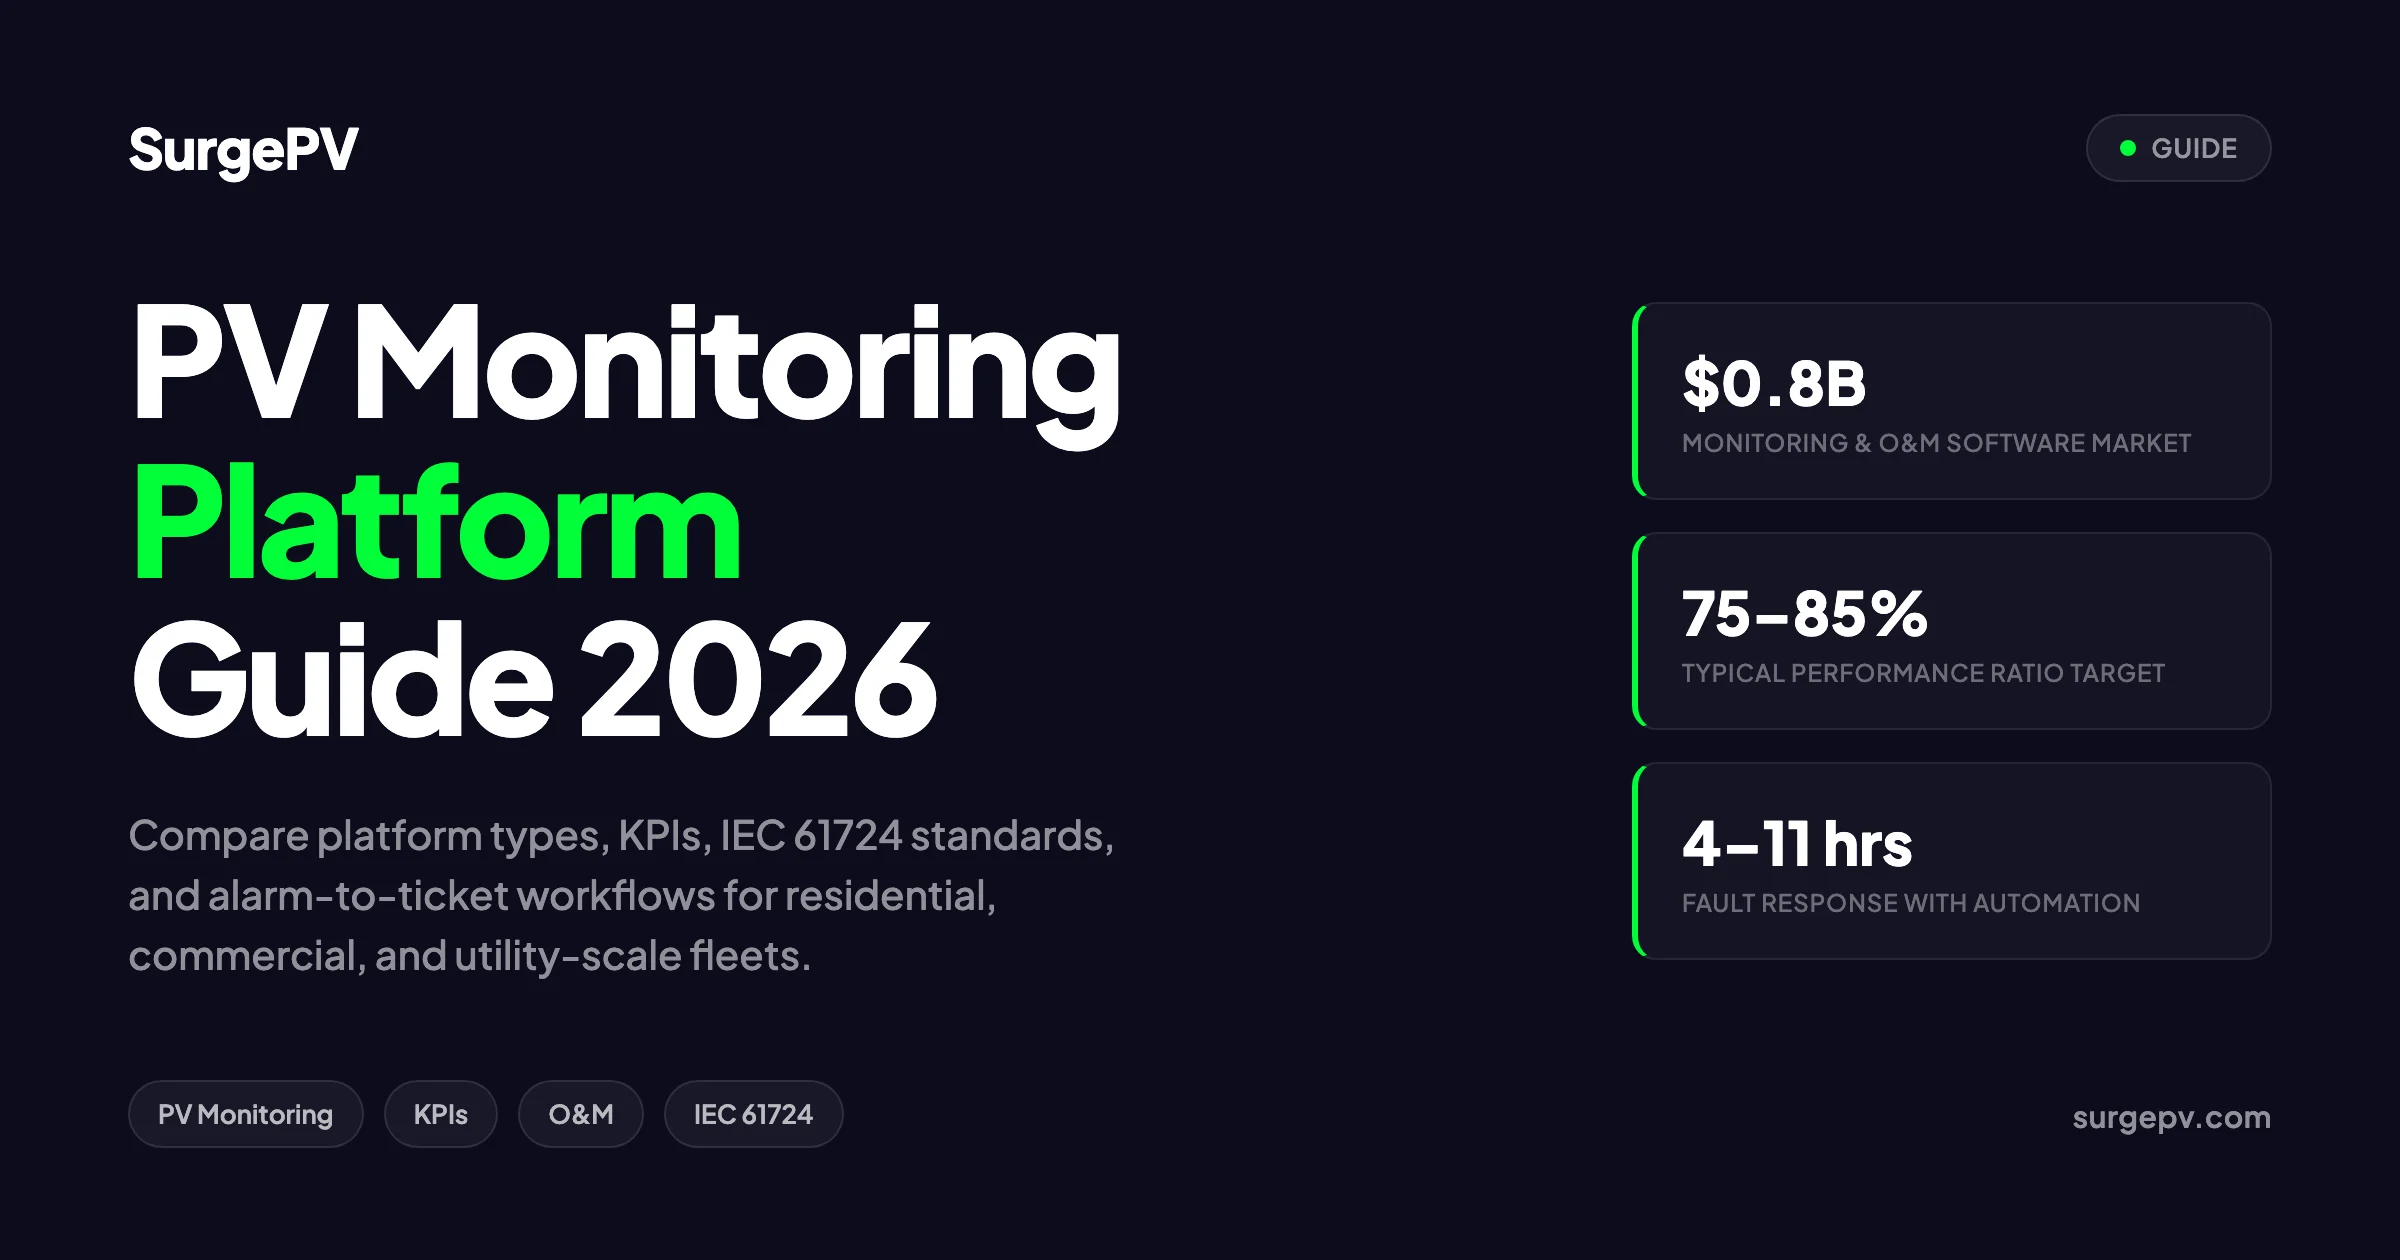
In 2026, the monitoring and O&M software segment is worth roughly $0.8 billion and is growing at about 11.9% per year. The reason is simple: as solar fleets scale, manual oversight breaks down. Installers with 30, 100, or 500 sites need standardized KPIs, automated alarms, and closed-loop maintenance workflows.
This guide explains what a PV monitoring platform does, how to compare options, what IEC 61724 compliance means in practice, and how to choose the right setup for residential, commercial, or utility-scale fleets. If you are designing or selling solar systems, pairing monitoring with solar design software from the start makes commissioning and handover much cleaner.
Quick Answer — PV Monitoring Platform 2026
A PV monitoring platform collects real-time data from inverters, meters, and weather sensors to track production, calculate KPIs like Performance Ratio, and turn faults into maintenance tickets. Choose manufacturer-locked platforms for single-brand fleets, platform-agnostic tools for mixed hardware, and IEC 61724 Class A or B setups for bankable reporting.
In this guide:
- Latest 2026 trends in PV monitoring platforms
- What a PV monitoring platform does — core functions explained
- Key KPIs: Performance Ratio, yield, availability, degradation
- IEC 61724 monitoring classes and what they mean
- Platform types: manufacturer-locked vs. platform-agnostic
- Feature checklist for 2026
- Pricing and cost guidance
- Alarm-to-ticket O&M workflow
- How to choose the right platform
- FAQ
Latest Updates: PV Monitoring Platforms 2026
The PV monitoring market is consolidating around three trends: platform-agnostic dashboards, AI-driven fault detection, and tighter integration between monitoring and O&M ticketing.
PV Monitoring Platform Trends — 2026
| Trend | Impact |
|---|---|
| Platform-agnostic aggregation | Installers can manage SolarEdge, Enphase, SMA, Fronius, Huawei, and Sungrow in one dashboard |
| AI fault detection | Pattern recognition reduces false alarms and groups related faults into single tickets |
| Alarm-to-ticket automation | Monitoring platforms now create CMMS work orders directly, cutting response times |
| IEC 61724 reporting | Standardized PR and yield reports are becoming default for commercial and utility projects |
| Mobile-first workflows | Technicians receive tickets, photos, and GPS routing through native apps |
| Satellite irradiance integration | Platforms like Solargis and Solcast feed weather-corrected benchmarks into dashboards |
Why This Matters Now
Module prices have fallen, but labor and financing costs have not. The easiest way to protect project returns is to minimize downtime and prove performance. Monitoring platforms are no longer a nice-to-have add-on; they are part of the standard commissioning package for commercial and utility projects.
Pro Tip
Specify the monitoring platform during the design phase, not after installation. Choosing hardware with open APIs or native integrations avoids expensive retrofit data loggers and ensures the owner receives a complete handover. Use a cloud solar design platform to document sensor placement, inverter layout, and expected yield before construction starts.
What Is a PV Monitoring Platform?
A PV monitoring platform is cloud-based software that connects to solar hardware and displays what the system is doing in real time. It reads data from inverters, string combiners, revenue meters, weather stations, and sometimes module-level power electronics. It then calculates performance metrics, triggers alarms, and stores historical data for reporting.
The goal is to answer four questions:
- Is the system producing what it should?
- Where are the faults?
- How much money is being lost?
- What maintenance action should happen next?
Core Functions
| Function | What It Does |
|---|---|
| Data acquisition | Pulls inverter, meter, and sensor data via APIs, Modbus, or data loggers |
| Visualization | Shows production curves, maps, and device-level dashboards |
| KPI calculation | Computes PR, specific yield, availability, and degradation |
| Alarm management | Detects underperformance, offline devices, and threshold breaches |
| Ticketing | Converts alarms into maintenance tickets or work orders |
| Reporting | Generates owner, lender, and warranty reports |
| Forecasting | Compares actual output to modeled or satellite-derived expected output |
For installers, the platform is also a sales and retention tool. A customer portal with clean charts and savings numbers reduces support calls and makes annual maintenance contracts easier to sell.
Key KPIs Tracked by PV Monitoring Platforms
Professional monitoring revolves around a small set of standardized metrics. Understanding them is essential before comparing platforms.
Performance Ratio (PR)
PR is the most widely used KPI. It compares actual AC energy output to the theoretical maximum based on irradiance.
Formula:
PR = E_AC / (H_POA × P_STC / 1000)Where:
- E_AC = actual AC energy delivered (kWh)
- H_POA = plane-of-array irradiation (kWh/m²)
- P_STC = installed DC power at standard test conditions (kWp)
A well-performing fixed-tilt system typically runs a PR of 75–85%. Lower values point to soiling, shading, inverter clipping, wiring losses, or hardware faults.
Other Essential KPIs
| KPI | Definition | Typical Target |
|---|---|---|
| Specific yield | kWh produced per kWp installed | 1,200–1,700 kWh/kWp/year, location-dependent |
| Availability | Percentage of time the system is operational | 98.5–99.5% |
| Degradation rate | Annual loss in output | 0.5–0.8% per year |
| Soiling loss | Production lost to dirt and dust | 2–7% annually, higher in dry climates |
| Performance index | Measured output vs. expected output | 95–105% |
| Energy yield | Total energy produced over a period | Project-specific |
Key Takeaway — KPIs
PR tells you how efficiently the system converts sunlight into electricity. Specific yield tells you how productive the site is overall. Availability tells you how reliable it is. Use all three together; a high PR with low yield may mean the site is simply not sunny, while low PR with normal irradiance signals a technical problem.
IEC 61724 Monitoring Classes Explained
IEC 61724 is the international standard for PV system monitoring and performance assessment. It has three parts:
- IEC 61724-1: Monitoring — measurement, data exchange, and analysis
- IEC 61724-2: Capacity evaluation method
- IEC 61724-3: Energy evaluation method
For most operational monitoring, IEC 61724-1 is the relevant part. It defines three monitoring accuracy classes.
Monitoring Accuracy Classes
| Class | Use Case | Typical Hardware |
|---|---|---|
| Class A | Bankable reporting, lender review, warranty disputes | ISO 9060 Class A pyranometer, Class 0.2S revenue meter, 1-minute data |
| Class B | Operational monitoring and O&M | Calibrated reference cell, Class 0.5 meter, 5-minute data |
| Class C | Basic production tracking | Inverter data only, no irradiance sensor |
Class A is the most expensive but is often required by independent engineers and project financiers. Class B is sufficient for most commercial O&M contracts. Class C is common for residential systems where the goal is simple production visibility.
Why IEC 61724 Matters
Using inverter production counters alone can produce PR values with poor accuracy. Calibrated meters and irradiance sensors are needed for credible, dispute-resistant reports. If you plan to sell a project or raise financing, specify Class A or Class B monitoring from day one.
Types of PV Monitoring Platforms
Not every platform fits every project. The market splits into four broad categories.
1. Manufacturer-Locked Platforms
These come free or bundled with specific hardware. They work well when the entire fleet uses one brand.
| Platform | Hardware | Best For |
|---|---|---|
| SolarEdge Monitoring | SolarEdge inverters and optimizers | Residential and small commercial fleets with module-level visibility |
| Enphase Enlighten | Enphase microinverters | Microinverter residential systems |
| SMA Sunny Portal | SMA inverters | SMA-only fleets and community comparisons |
| Fronius Solar.web | Fronius inverters | Premium string inverter projects |
| Tigo Energy Intelligence | Tigo MLPE and rapid shutdown | Safety-critical and module-level projects |
2. Platform-Agnostic Commercial Platforms
These connect mixed hardware brands and add O&M, reporting, and fleet management.
| Platform | Key Strength |
|---|---|
| SurgePV | Unified multi-brand dashboard with IEC 61724 KPIs, alarm-to-ticket workflows, and P50/P90 forecasts |
| Amperecloud | Intelligent alarm grouping and automated ticket creation |
| Solytic | Hardware-independent monitoring with physical digital twin modeling |
| Solar-Log WEB Enerest | Long-established European platform with broad inverter support |
| meteocontrol VCOM | Strong ticketing and CMMS integration |
3. Utility-Scale Enterprise Platforms
Built for large portfolios, SCADA integration, and lender-grade reporting.
| Platform | Key Strength |
|---|---|
| AlsoEnergy PowerTrack | Industry standard for utility-scale and high-definition visualization |
| Power Factors | Enterprise asset management and analytics |
| Inaccess Unity | SCADA and control-room-grade monitoring |
| Prediktor | Industrial IoT and predictive analytics |
4. Open-Source and DIY Options
Home Assistant with integrations like Predbat is popular among tech-savvy homeowners, especially those on dynamic tariffs. It offers flexibility but requires significant setup and maintenance.
Decision Framework
Single-brand residential installer → manufacturer-locked platform. Multi-brand commercial fleet → platform-agnostic tool like SurgePV or Amperecloud. Utility-scale plant → enterprise platform with SCADA and bankable reports. DIY homeowner → Home Assistant if you have the technical skills.
PV Monitoring Platform Feature Checklist for 2026
Use this checklist when evaluating platforms.
| Feature | Why It Matters |
|---|---|
| Multi-brand inverter support | Avoids juggling separate apps for mixed fleets |
| Real-time and historical data | Needed for troubleshooting and trend analysis |
| Device-level diagnostics | Pinpoints faults to inverter, string, or MPP tracker |
| Weather and irradiance integration | Enables PR calculation and weather-corrected benchmarking |
| KPI reports (PR, yield, availability) | Standard reporting for owners and lenders |
| Financial calculations | Tracks revenue, savings, and value of lost production |
| Alarms and notifications | Email, SMS, or push alerts for faults |
| Maintenance ticketing | Converts alarms into trackable work orders |
| Mobile app | Field technicians need access on-site |
| API and integrations | Connects to CRM, CMMS, billing, and SCADA |
| Document management | Stores as-builts, warranties, and O&M contracts |
| User roles and permissions | Controls access across large teams and customers |
The best platforms do not just collect data. They close the loop from detection to resolution.
PV Monitoring Platform Pricing and Costs
Pricing varies by system size, feature set, and whether the platform is bundled with hardware.
Software Pricing Examples
| Segment | Typical Cost |
|---|---|
| Residential/small commercial (under 100 kW) | $0–$100/year, often free with inverter |
| Typical federal facility platform | ~$1,000/year |
| Commercial platform-agnostic (example) | ~$1,899/year for 3 users |
| Per-capacity pricing | €0.20/kWp/year to €1,600/MWp/year depending on provider |
| Utility-scale plant (~100 MW) | ~$50,000/year |
Hardware and Instrumentation Budget
For bankable monitoring, budget for sensors and meters in addition to software.
| Component | Approximate Cost |
|---|---|
| Single-phase 240 VAC meter | ~$1,800 |
| Three-phase 480 VAC meter | ~$3,800 |
| Complete instrumentation package | ~$5,000 |
| Class A irradiance sensor and temperature sensors | $2,000–$5,000 |
The upfront instrumentation cost is small compared to the value of catching underperformance early. A 1% improvement in availability on a 500 kW commercial system can be worth thousands of dollars per year.
Alarm-to-Ticket O&M Workflow
The real value of a monitoring platform shows up when something goes wrong. Modern platforms automate the path from fault detection to field resolution.
The Six-Step Workflow
- Fault detection. The platform reads device data and flags anomalies such as zero production, low PR, or communication loss.
- Incident creation. A transient event is logged but not yet escalated.
- Alarm escalation. If the incident persists beyond a configured delay, it becomes an alarm.
- Ticket creation. The alarm generates a ticket with fault type, error code, affected asset, severity, and recommended action.
- Work order assignment. The ticket is assigned to a technician based on location, skill, or workload.
- Resolution and close. The technician resolves the fault, documents the work, and the ticket closes automatically when data confirms the fix.
Benefits of Automation
| Benefit | Typical Improvement |
|---|---|
| Response time | From 48–72 hours to 4–11 hours |
| Truck rolls | Reduced through remote diagnostics |
| SLA compliance | Improved with automatic timestamps |
| Warranty claims | Supported by documented maintenance history |
| Customer retention | Proactive fixes reduce owner complaints |
Monitor Your Fleet in One Dashboard
SurgePV connects SolarEdge, Enphase, SMA, Fronius, and more into a single platform with IEC 61724 KPIs, automated alarms, and built-in O&M tickets.
Book a DemoNo commitment required · 20 minutes · Live project walkthrough
How to Choose the Right PV Monitoring Platform
Selection depends on fleet size, hardware mix, reporting needs, and budget.
Decision Checklist
| Question | If Yes | Consider |
|---|---|---|
| All systems use one inverter brand? | Manufacturer-locked platform | SolarEdge, Enphase, SMA, Fronius |
| Mixed hardware across many sites? | Platform-agnostic dashboard | SurgePV, Amperecloud, Solytic |
| Need lender-grade reports? | IEC 61724 Class A/B setup | AlsoEnergy, Power Factors, SurgePV |
| Heavy O&M workload? | Alarm-to-ticket automation | SurgePV, meteocontrol, Amperecloud |
| Utility-scale or SCADA integration? | Enterprise platform | AlsoEnergy, Inaccess, Prediktor |
| Budget-sensitive residential? | Free inverter app | SolarEdge, Enphase, SMA |
Red Flags to Avoid
- Platforms that lock you out of your own data
- No API or export options
- Nuisance alarms that cannot be tuned
- No mobile app for technicians
- Hidden per-site or per-inverter fees
Implementation Tips
- Define KPIs and reporting requirements in the EPC contract.
- Install revenue-grade meters and irradiance sensors during construction.
- Configure alarm thresholds based on site conditions, not defaults.
- Train technicians on the mobile app before go-live.
- Review monthly PR trends to catch gradual degradation.
Frequently Asked Questions
What is a PV monitoring platform?
A PV monitoring platform is software that collects real-time data from solar inverters, meters, weather stations, and sensors to track energy production, detect faults, and report performance KPIs. It helps installers, asset managers, and owners manage fleets, reduce downtime, and prove ROI.
What are the main KPIs tracked by a PV monitoring platform?
The main KPIs are Performance Ratio (PR), specific yield (kWh/kWp), system availability, degradation rate, soiling losses, and weather-corrected performance index. IEC 61724-1 defines the standard methods for calculating PR and reporting.
How much does a PV monitoring platform cost?
Residential and small commercial monitoring is often free with inverter hardware or costs $0–$100 per year. Commercial platform-agnostic solutions range from roughly €0.20/kWp/year to €1,600/MWp/year depending on features. Utility-scale plants can spend around $50,000 per year for enterprise monitoring.
What is the difference between manufacturer-locked and platform-agnostic monitoring?
Manufacturer-locked platforms only work with one brand of inverters or power electronics, such as SolarEdge, Enphase, or SMA. Platform-agnostic monitoring connects mixed hardware brands into one dashboard, which is essential for installers and asset managers running multi-brand fleets.
What is IEC 61724 and why does it matter for monitoring?
IEC 61724 is the international standard for photovoltaic system monitoring and performance assessment. Part 1 defines monitoring accuracy classes A, B, and C, plus the Performance Ratio calculation. Bankable reports and warranty claims usually require Class A or B compliance with calibrated meters and irradiance sensors.
How does alarm-to-ticket workflow work in PV monitoring?
The platform detects a fault from device data, escalates persistent incidents into alarms, then converts alarms into maintenance tickets. Tickets contain fault type, affected asset, severity, and diagnostics. Technicians receive work orders, resolve the issue, and the ticket auto-closes when the fault clears.
Can a PV monitoring platform improve O&M costs?
Yes. Automated fault detection and ticket creation reduce response times from days to hours, cut unnecessary truck rolls through remote diagnostics, and improve SLA compliance. Fleet-wide KPI benchmarking also helps prioritize sites with the biggest performance gaps.
What hardware is needed for a PV monitoring platform?
At minimum, production data from the inverter. For bankable reporting, add a revenue-grade meter, plane-of-array irradiance sensor, module temperature sensor, and ambient temperature sensor. Data loggers, gateways, or cellular modems connect hardware to the cloud platform.


