TL;DR: Solar management software spans 5 distinct categories. SurgePV leads pre-install design and project tracking. Scoop Solar handles field construction and O&M for growing installers. AlsoEnergy monitors 34 GW of commercial and industrial assets worldwide. SolarEdge Monitoring is free and module-level, but hardware-locked. Scanifly cuts design revision rates from 25% to under 1% using drone surveys. Raptor Maps reduces utility-scale truck rolls by 50% with AI drone inspections. Greenbyte by Power Factors manages 75+ GW of multi-technology portfolios across 60 countries.
Solar management software is an umbrella term. It covers everything from 3D design and shadow analysis to multi-gigawatt portfolio monitoring. A residential installer needs something different from a utility-scale asset manager. Yet every search result lumps them together under one label. That makes choosing the right platform harder than it should be. This guide breaks the category into 5 distinct types. Then we review the best tool in each type, show where they fit in the project lifecycle, and explain how to build a complete management stack for your company size.
The wrong choice is expensive. A generic project management tool cannot model solar permitting workflows. A hardware-locked monitoring platform becomes useless when you switch inverter brands. An enterprise asset manager is overkill for a 5-person residential crew. The consequences range from wasted subscriptions to lost production data to failed inspections.
The solar monitoring software market alone was valued at approximately $1.2 billion in 2024. It is projected to reach $3.7 billion by 2033, growing at an 11.9% CAGR (DataHorizzon Research, 2025). The U.S. has 279.2 GWdc of installed solar capacity across 5,971,990 systems as of 2025 (SEIA/Wood Mackenzie, 2025). Managing that volume requires software that matches both the technology and the business model. The tools below do exactly that.
What Is Solar Management Software?
Solar management software is any digital platform used to plan, execute, monitor, or maintain photovoltaic systems. The category breaks into 5 distinct segments:
- Project management software — Scheduling, task tracking, document control, and subcontractor coordination from site survey through commissioning. This is the construction-phase layer. It answers the question: “Who is doing what, and is it on time?”
- Asset management software — Long-term financial and operational oversight of installed systems. Tracks warranties, insurance, debt service, and energy production against projections. It answers the question: “Is this asset generating the returns we modeled?”
- O&M management software — Work order ticketing, preventive maintenance scheduling, parts inventory, and technician dispatch. Focuses on keeping existing systems running. It answers the question: “What broke, and who fixes it?”
- Monitoring software — Real-time or near-real-time data collection from inverters, sensors, and weather stations. Flags underperformance and equipment faults. It answers the question: “Is the system producing what it should right now?”
- Portfolio management software — Consolidated dashboards spanning multiple technologies (solar, wind, storage) across geographies. Used by IPPs, utilities, and large funds. It answers the question: “How does my entire fleet compare across regions and technologies?”
A single tool rarely covers all 5 categories well. Most companies run 2-4 platforms integrated through APIs or manual handoffs. For example, a design created in solar design software like SurgePV exports to a construction tracker like Scoop Solar. After commissioning, data flows into AlsoEnergy for monitoring and O&M. The solar software market rewards specialization. Platforms that try to do everything usually excel at nothing.
Note
Many vendors market themselves as “all-in-one” solar management platforms. In practice, their strengths always cluster in 1-2 categories. We evaluate each tool based on where it actually performs, not where it claims to.
Which Type of Solar Management Software Do You Actually Need?
Your company size and project phase determine which category matters most.
| Company Profile | Primary Need | Secondary Need | Example Stack |
|---|---|---|---|
| Small residential installer (1-5 employees) | Project management | Basic monitoring | SurgePV + Scoop Solar |
| Mid-size EPC (10-50 employees) | Construction tracking + design handoff | Monitoring + O&M | SurgePV + Scoop Solar + AlsoEnergy |
| Commercial installer / C&I developer | Portfolio monitoring + asset management | O&M dispatch | AlsoEnergy + Scoop Solar |
| Utility-scale EPC / O&M provider | Drone inspection + SCADA | Fleet monitoring | Scanifly + Scoop Solar + AlsoEnergy + Raptor Maps |
| IPP / fund manager (multi-technology) | Portfolio benchmarking | Compliance reporting | Greenbyte / Power Factors |
If you install systems but do not operate them, you need pre-install and construction tools. If you own or operate assets under long-term contracts, you need monitoring, O&M, and asset management layers. The sections below map each tool to its best-fit use case.
The Solar Project Lifecycle: Where Each Tool Fits
Solar projects move through 4 phases. No single tool dominates all 4. The best results come from combining specialized platforms at each handoff point.
Phase 1: Design and proposal. Engineers model system layout, run shadow analysis, size equipment, and generate bankable yield forecasts. SurgePV dominates here. It integrates 3D design, financial modeling, and automated single-line diagrams. This phase outputs the bill of materials, performance estimates, and customer proposals that drive the rest of the project.
Phase 2: Project tracking and construction. Schedules, permits, inspections, and field crew coordination happen here. Scoop Solar is purpose-built for this phase. It replaces spreadsheets and generic PM tools with solar-specific workflows. The output is an as-built system, signed-off permits, and commissioning documentation.
Phase 3: Monitoring and commissioning. Once energized, systems need real-time performance tracking, SCADA integration, and fault detection. AlsoEnergy and SolarEdge Monitoring serve this phase. AlsoEnergy handles multi-brand fleets. SolarEdge is free for SolarEdge hardware owners. This phase produces performance baselines and alerts that feed into O&M planning.
Phase 4: O&M and asset management. Long-term operations include preventive maintenance, corrective work orders, drone inspections, and warranty tracking. Raptor Maps, AlsoEnergy Power CMMS, and Greenbyte operate here. Raptor Maps adds drone-based anomaly detection. Greenbyte adds multi-technology portfolio benchmarking. This phase runs for 25-30 years and determines actual project returns.
Pro Tip
The handoff between Phase 1 and Phase 2 is where most projects lose data. Export design files, BOMs, and as-built documentation in formats your construction tracker can import. SurgePV exports project packages compatible with downstream PM tools.
What We Evaluated
We scored each tool across 10 criteria relevant to solar professionals:
- Solar-specific workflow depth — Does the tool model actual solar processes, or is it a generic platform with solar branding? A construction tracker should understand permitting, PTO, and commissioning. A monitoring platform should understand performance ratios and irradiance adjustment.
- Mobile and offline field access — Can crews use it on rooftops without reliable connectivity? Field crews in rural areas or equipment rooms often have no signal. Offline access with later sync is non-negotiable for construction and O&M tools.
- Integration ecosystem — Does it connect to inverters, CRMs, accounting tools, and other solar platforms? Data silos kill efficiency. The best tools export to and import from the rest of your stack.
- Data accuracy and granularity — For monitoring tools: string-level, inverter-level, or module-level? For design tools: how close to PVsyst? For survey tools: inch-level or foot-level accuracy?
- Scalability — Can the platform handle 10 projects and 10,000 projects with equal performance? Some tools slow down or lose features at scale. We verify performance claims against user reports at high volume.
- Pricing transparency — Are costs published, or is every quote custom? Transparent pricing lets you budget. Opaque enterprise pricing often signals long sales cycles and consulting dependencies.
- Customer support quality — Response time, solar expertise, and self-service resources. Solar-specific support matters. A generic helpdesk cannot troubleshoot inverter communication errors or NEC compliance questions.
- Reporting and compliance — Does it generate IEC, AHJ, or investor-grade reports? Bankable simulations, SLDs, and IEC-compliant monitoring data are required for financing and permitting.
- Implementation speed — Time to first value: days, weeks, or months? Some platforms require months of configuration. Others are usable within a day. Faster implementation means faster ROI.
- Total cost of ownership — Includes hardware, training, integration, and subscription over 3 years. A low subscription price with expensive required hardware or consulting is not a low TCO.
Ratings are on a 10-point scale. They combine hands-on testing, verified user reviews, published case studies, and direct vendor data. We weight solar-specific depth and TCO highest because those factors determine whether a tool actually works in production.
1. SurgePV — Best for Design-Integrated Project Management (Pre-Install Phase)
Category: Design + Pre-install Project Management
Rating: 9.1/10
Price: From $1,899/year for 3 users
Website: surgepv.com
SurgePV is a solar software platform that combines 3D design, shadow analysis, financial modeling, proposal generation, and project tracking in one system. It is the only tool on this list that spans design, simulation, and pre-install project management without requiring third-party integrations.
The design engine produces bankable simulations accurate to within ±3% versus PVsyst, the industry-standard desktop simulator. Engineers can generate P50, P75, and P90 yield scenarios for project financing. The automated single-line diagram (SLD) generator builds SLDs in 5-10 minutes. Manual drafting in AutoCAD takes 2-3 hours for the same output.
Project tracking in SurgePV runs from the initial site survey through proposal approval and permitting. Each project carries design files, customer communications, and documentation in a single record. When the project moves to construction, that record exports to downstream construction management tools. That eliminates the manual file exports and email chains that delay project starts.
The proposal engine generates customer-ready documents with yield forecasts, financial scenarios, and equipment specifications. Integration with the generation and financial tool means P50, P75, and P90 outputs are ready for banks and investors without switching applications.
Why it works: SurgePV removes the gap between design and project management. Most installers use one tool for design (Aurora, Helioscope) and another for CRM or PM. That creates data loss at handoff. SurgePV keeps the full pre-install lifecycle in one database. Clara AI assists with design decisions. 50+ country support means local weather files, equipment databases, and regulatory defaults are preloaded. You do not need to import TMY data or build equipment lists from scratch.
Where it falls short: SurgePV does not handle post-install monitoring or O&M ticketing. It also lacks native field service management for construction crews. Installers need Scoop Solar or a similar platform for the construction and operations phases.
Pros:
- Bankable simulations within ±3% of PVsyst
- Automated SLD generation in 5-10 minutes
- Integrated generation and financial tool with P50/P75/P90 scenarios
- Project tracking from survey through proposal
- 70,000+ projects designed globally
- Clara AI for assisted design
- 50+ country support with localized databases
Cons:
- No post-install monitoring or O&M features
- No native field crew dispatch for construction
- Requires integration with construction and monitoring tools for full lifecycle coverage
Best for: Residential and commercial installers who want design, simulation, and pre-install project management in a single platform. Ideal for companies that currently lose time exporting files between design software and CRM/PM tools.
2. Scoop Solar — Best for Field Operations & Construction Management
Category: Project Management + Field Service Management
Rating: 8.8/10
Price: ~$119-$450/month estimate; unlimited users
Website: scoop.solar
Scoop Solar is a purpose-built project management and field service platform for solar and renewable energy contractors. It covers the full construction lifecycle: design handoff, sales, installation, commissioning, and ongoing O&M. The platform is used across 250,000+ project sites in 14 countries.
The mobile app is a differentiator. Field crews access project files, checklists, and photos offline. Data syncs when connectivity returns. That matters on rural rooftops and in equipment rooms with poor signal. GLOO, Scoop’s integration engine, connects 500+ tools including CRMs, accounting software, and monitoring platforms.
LOOXY Analytics provides dashboards on project velocity, crew productivity, and margin tracking. Workflow automation replaces manual status updates. Scoop claims an 80% reduction in manual steps and 10x ROI for customers who fully adopt the platform. Customer support scores 4.77/5 across 23 verified reviews.
O&M is not an afterthought in Scoop. The same platform that tracks construction transitions to preventive maintenance, corrective ticketing, and warranty management after commissioning. That continuity matters. Most installers lose historical project data when they switch from construction spreadsheets to separate O&M tools.
Why it works: Generic PM tools like Asana or Monday.com force solar companies to adapt their processes to software templates. Scoop Solar reverses that. Its workflows match solar construction phases: permitting, procurement, installation, inspection, PTO, and commissioning. Subcontractor management, O&M ticketing, and preventive maintenance scheduling are native features, not add-ons. The platform thinks in solar project language, not generic task language.
Where it falls short: Scoop Solar does not include design or simulation capabilities. Companies still need solar design software like SurgePV for modeling and proposals. The analytics layer is strong on operations but lighter on financial modeling and LCOE analysis.
Pros:
- Purpose-built for solar and renewable construction
- Offline mobile access for field crews
- 500+ integrations via GLOO
- Workflow automation across all project phases
- Subcontractor management and O&M ticketing
- Multi-language support for international teams
- 250,000+ project sites; 4.77/5 support rating
Cons:
- No design or simulation engine
- Limited financial modeling compared to design platforms
- Pricing is estimate-based; enterprise quotes vary
Best for: Growing installers and EPCs that need construction-phase project management with strong mobile field access. Companies moving off spreadsheets or generic PM tools will see the fastest ROI.
3. AlsoEnergy (PowerTrack + Power CMMS) — Best for C&I Portfolio Monitoring & O&M
Category: Monitoring + Asset Management + O&M
Rating: 8.5/10
Price: Enterprise pricing (custom)
Website: alsoenergy.com
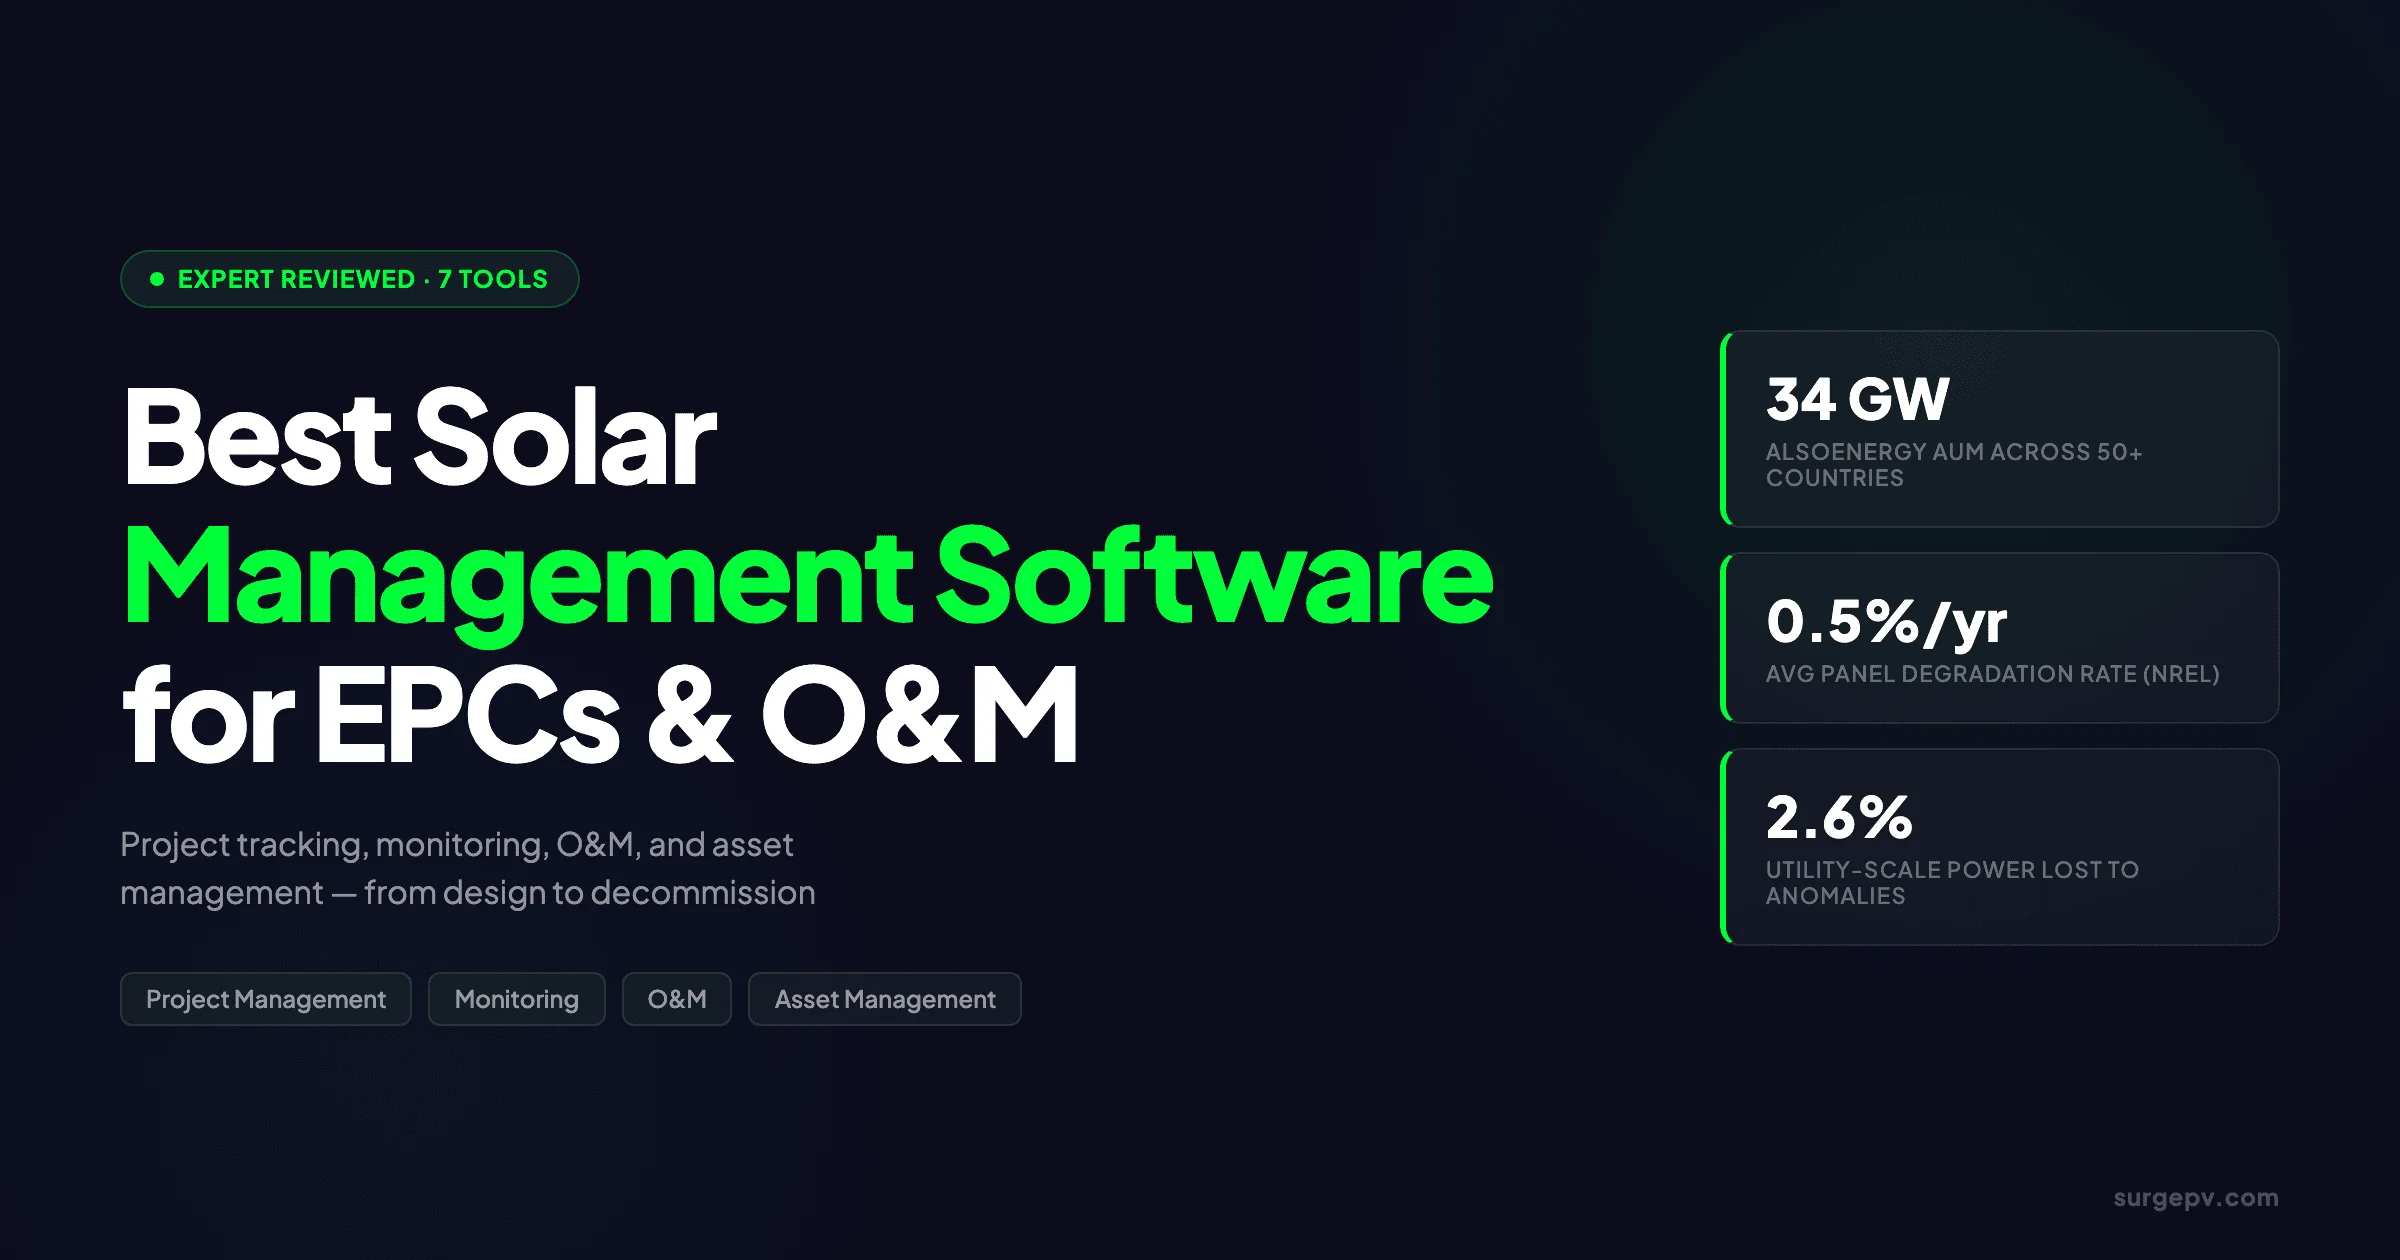
AlsoEnergy operates 34 GW of assets under management across 50+ countries. It was acquired by Stem Inc. in February 2022 for $695 million, validating its position as a tier-one monitoring and asset management platform. The product suite splits into two cores: PowerTrack for monitoring and Power CMMS for O&M.
PowerTrack is hardware-agnostic. It ingests data from inverters, weather stations, and sensors regardless of manufacturer. That matters for C&I portfolios where sites run mixed hardware across years of construction. Weather-adjusted performance analysis benchmarks actual output against modeled expectations. Automated fault detection triggers alerts before customers notice production drops.
Power CMMS adds work order ticketing, maintenance scheduling, and parts inventory. Technicians receive dispatch instructions through mobile apps. Managers track mean time to repair, preventive maintenance compliance, and spare parts levels.
Why it works: AlsoEnergy is one of the few platforms that combines monitoring, SCADA control, and CMMS in a single ecosystem. The EXTOR case study in Hungary demonstrates this: 110 MWp of SCADA infrastructure was commissioned in 6 weeks, a timeline that typically stretches to months.
Where it falls short: AlsoEnergy sells its own data loggers and sensors. While the software is hardware-agnostic, the sales process pushes AlsoEnergy hardware. Pricing is entirely custom, which makes budgeting difficult for smaller operators. The interface prioritizes functionality over simplicity; new users face a learning curve.
Pros:
- 34 GW AUM across 50+ countries
- Hardware-agnostic multi-brand inverter monitoring
- Weather-adjusted performance benchmarking
- SCADA control + automated fault detection
- Integrated CMMS for work orders and parts management
- Proven at scale: 110 MWp commissioned in 6 weeks
Cons:
- Enterprise pricing only; no published small-business tiers
- Sales process favors AlsoEnergy hardware bundles
- Steeper learning curve than residential-focused tools
Best for: Commercial and industrial developers, asset managers, and O&M providers running multi-site portfolios with mixed hardware. Not suited for small residential installers due to cost and complexity.
4. SolarEdge Monitoring — Best for SolarEdge Fleet Management
Category: Monitoring
Rating: 8.0/10
Price: Free for 25 years with SolarEdge systems; $44.99/year residential renewal; $279.99/3-year small commercial; $749.99/3-year commercial
Website: solaredge.com
SolarEdge Monitoring provides module-level visibility into photovoltaic systems through power optimizers. Every panel reports independently. That granularity identifies underperformance at the module level rather than the string level. Installers catch shading, soiling, and equipment faults faster.
The platform includes real-time production data, automated fault detection, and a fleet management dashboard for installers overseeing multiple customer systems. The mySolarEdge mobile app gives system owners visibility into production and consumption. SolarEdge ONE extends the platform to commercial and industrial sites with broader analytics.
Remote diagnostics reduce truck rolls. Installers can reset inverters, update firmware, and troubleshoot without visiting the site.
Why it works: For installers who standardized on SolarEdge inverters and optimizers, the monitoring platform is free for 25 years. Module-level data is genuinely useful for fault detection. The fleet dashboard simplifies managing hundreds or thousands of residential systems.
Where it falls short: SolarEdge Monitoring is hardware-locked. It does not monitor systems with string inverters, microinverters, or competing optimizer brands. If your portfolio mixes SolarEdge with other hardware, you need AlsoEnergy or a similar agnostic platform alongside it. The analytics layer is lighter than AlsoEnergy for C&I benchmarking.
Pros:
- Free 25-year monitoring with SolarEdge hardware
- Module-level production visibility
- Automated fault detection and remote diagnostics
- Fleet management for installer portfolios
- mySolarEdge consumer mobile app
- SolarEdge ONE for C&I analytics
Cons:
- Hardware-locked to SolarEdge ecosystem
- Does not monitor mixed-hardware portfolios
- Lighter C&I benchmarking than agnostic platforms
Best for: Installers and EPCs who have standardized on SolarEdge inverters and optimizers. Residential fleets in particular benefit from the free 25-year monitoring tier.
5. Scanifly — Best for Drone-Based Site Assessment
Category: Site Survey + Preliminary Design
Rating: 8.2/10
Price: ~$4,000-$6,000/year + drone hardware; credit-based premium services
Website: scanifly.com
Scanifly replaces manual site surveys and satellite imagery with drone-based 3D reconstructions. A drone flight captures roof geometry, obstructions, and shading with 1-3 inch accuracy. Satellite imagery delivers 6-12 inch accuracy at best. That precision difference directly impacts design quality.
The platform has three parts. PrelimDesign generates unlimited remote preliminary designs from drone data. DroneDesign builds photogrammetry-based 3D models for detailed engineering. AI obstruction detection automatically flags trees, vents, and mechanical equipment that cast shadows. For installers who also need solar proposal software, Scanifly exports survey data to design platforms that generate customer-facing documents.
Scanifly holds simultaneous nationwide approvals from NYSERDA and MassCEC. It is the only drone survey tool with both. Scanifly Mobile is a free field app for technicians.
Case studies validate the accuracy claims. Namaste Solar reduced its design revision rate from 25% to under 1% after adopting Scanifly. EmPower Solar cut software costs by 53% compared to Aurora by using Scanifly for survey and preliminary design.
Why it works: Traditional site surveys take hours and require ladder climbs. Satellite imagery misses obstructions and produces inaccurate roof measurements. Scanifly cuts survey time to minutes and delivers measurements accurate enough for direct-to-permit designs.
Where it falls short: Scanifly requires an FAA Part 107 drone license in the U.S. That adds training cost and regulatory burden. Total cost of ownership runs $10,000-$13,000+ per year including drone hardware, insurance, and software. It does not replace full engineering design software; it feeds data into platforms like SurgePV or Aurora for final modeling.
Pros:
- 1-3 inch measurement accuracy vs 6-12 inch satellite
- PrelimDesign: unlimited remote preliminary designs
- AI obstruction detection
- NYSERDA and MassCEC approved nationwide
- Free Scanifly Mobile field app
- Namaste Solar: revision rate 25% → under 1%
- EmPower Solar: 53% software cost reduction
Cons:
- Requires FAA Part 107 drone license
- TCO of $10,000-$13,000+/year
- Does not replace full design and simulation software
Best for: Installers who want to eliminate design revisions caused by inaccurate site data. Companies serving markets with strict accuracy requirements (NYSERDA, MassCEC) gain additional compliance value.
6. Raptor Maps — Best for Utility-Scale O&M & Drone Inspection
Category: O&M + Drone Inspection + Asset Analytics
Rating: 8.4/10
Price: Enterprise pricing; $22M Series B funded
Website: raptorMaps.com
Raptor Maps builds digital twins of solar plants at equipment-level GPS accuracy. Its AI analyzes thermal imagery, RGB photos, and electroluminescence data to detect anomalies across modules, inverters, combiners, and civil infrastructure. The 2022 annual report found 2.6% of utility-scale solar power was affected by anomalies (Raptor Maps Annual Global Inspection Report, 2022). That figure makes proactive inspection economically rational.
The product suite includes Raptor Solar DG for commercial and industrial inspections, completed in 90 minutes. Raptor Solar Sentry is a drone-in-a-box solution priced at approximately $50,000 plus $2,500/year. It automates recurring inspections without on-site pilots. RS Mobile is an offline-ready app for field technicians.
Raptor Maps has analyzed 50+ GW of solar assets. Its 2026 report covers 373 GW globally. Customers include Tesla, SOLV Energy, and McCarthy Building Companies. The platform operates in 40 countries.
The ROI case is strong. Raptor Maps claims a 50% reduction in truck rolls and inspection-to-insight in 30-90 minutes, which the company reports is 99% faster than manual inspection cycles.
Why it works: At utility scale, walking every row with a handheld thermal camera is impractical. Raptor Maps automates anomaly detection at scale. The digital twin becomes a living asset record: every module, every fault, every repair is geolocated and timestamped.
Where it falls short: Raptor Maps is priced for enterprise and utility-scale operators. Small installers cannot justify the cost. The platform does not handle project management, design, or pre-install workflows. It is purely a post-commissioning inspection and analytics layer.
Pros:
- Equipment-level GPS-accurate digital twins
- Thermal anomaly, vegetation, and civil inspection AI
- Raptor Solar DG: C&I inspection in 90 minutes
- Drone-in-a-box automation (Sentry)
- 50+ GW analyzed; 373 GW in 2026 report
- 50% truck roll reduction claimed
- Customers: Tesla, SOLV Energy, McCarthy
Cons:
- Enterprise pricing; out of reach for small installers
- No design or project management features
- Requires drone operations and pilot coordination
Best for: Utility-scale O&M providers, independent power producers, and asset managers who need automated, scalable inspection across large geographically distributed plants.
7. Greenbyte (Power Factors) — Best for Multi-Technology Portfolio Management
Category: Portfolio Management + Multi-Technology Monitoring
Rating: 8.1/10
Price: Enterprise pricing
Website: powerfactors.com
Greenbyte was acquired by Power Factors in April 2021. The combined platform now manages 75+ GW of wind, solar, and storage assets across 60 countries. It is the leading choice for portfolios that span multiple renewable technologies.
The platform ingests SCADA and IoT data from diverse hardware. Fleet-wide benchmarking compares performance across technologies, manufacturers, and geographies. Automated compliance reporting generates IEC and regulatory documentation. AI-driven optimization suggests operational adjustments to improve yield.
Customers include Ardian Infrastructure (3.5 GW+), National Energy, and Longroad Energy (1.2 GW). The European market is particularly strong, reflecting Greenbyte’s Swedish origins.
Why it works: Most monitoring platforms were built for solar first. Greenbyte was built for multi-technology portfolios from the start. That shows in its data model: wind turbines, solar inverters, and battery controllers coexist in the same dashboard. Benchmarking across technologies is rare and valuable for funds with mixed holdings.
For more details, see our guide on wind turbine vs solar.
Where it falls short: The platform is complex. Small operators will not use 80% of its capability. Pricing is enterprise-only and opaque. The North American support footprint is smaller than AlsoEnergy’s.
Pros:
- 75+ GW AUM across wind, solar, and storage
- 60-country presence
- SCADA + IoT integration across vendors
- Fleet-wide benchmarking across technologies
- Automated compliance reporting
- AI-driven optimization recommendations
- Strong European market presence
Cons:
- Enterprise pricing only
- Complex feature set; overkill for solar-only operators
- Smaller North American support network than competitors
Best for: Infrastructure funds, IPPs, and utilities managing mixed renewable portfolios (solar + wind + storage) who need unified benchmarking and compliance reporting.
Solar Management Software Comparison Table
| Criteria | SurgePV | Scoop Solar | AlsoEnergy | SolarEdge | Scanifly | Raptor Maps | Greenbyte |
|---|---|---|---|---|---|---|---|
| Primary category | Design + Pre-install PM | Construction PM + FSM | Monitoring + O&M + CMMS | Monitoring | Site survey + Prelim design | O&M + Drone inspection | Portfolio management |
| Solar-specific depth | 9.5/10 | 9.0/10 | 8.5/10 | 8.0/10 | 8.5/10 | 8.5/10 | 7.5/10 |
| Mobile/offline field access | Partial (design) | Full (offline) | Full (CMMS app) | Full (mySolarEdge) | Full (free app) | Full (RS Mobile) | Dashboard only |
| Integration ecosystem | Export to PM tools | 500+ via GLOO | APIs, SCADA | SolarEdge ecosystem | Export to design tools | APIs, digital twin | SCADA, IoT, APIs |
| Data granularity | Module-level design | Project/task level | String/inverter level | Module-level | 1-3 inch survey | Module-level thermal | Fleet aggregate |
| Scalability | 70,000+ projects | 250,000+ sites | 34 GW AUM | Fleet-grade | Credit-based | 50+ GW analyzed | 75+ GW AUM |
| Pricing transparency | Published | Estimate | Custom | Published | Published | Custom | Custom |
| Support quality | High | 4.77/5 | Enterprise | Good | Good | Enterprise | Enterprise |
| Compliance reporting | SLD, bankable sims | Project docs | IEC, SCADA reports | Production reports | NYSERDA, MassCEC | Inspection reports | IEC, regulatory |
| TCO (3-year estimate) | $5,700 | $4,300-$16,200 | $50,000+ | $0-$750 | $30,000-$39,000 | $100,000+ | $100,000+ |
| Overall rating | 9.1/10 | 8.8/10 | 8.5/10 | 8.0/10 | 8.2/10 | 8.4/10 | 8.1/10 |
The Complete Solar Management Stack
No single tool covers the full solar lifecycle well. Below are recommended stacks by company type.
Small Installer Stack (1-10 employees, residential focus)
SurgePV + Scoop Solar
Use SurgePV for design, simulation, shadow analysis, and proposal generation. Export the project package to Scoop Solar for construction tracking, permitting, and field crew management. Total annual software cost: approximately $2,000-$7,000 depending on Scoop tier and project volume. This solar software stack replaces 3-4 separate applications with 2 integrated platforms.
Mid-Size EPC Stack (10-50 employees, residential + C&I)
SurgePV + Scoop Solar + AlsoEnergy
SurgePV handles design and pre-install PM. Scoop Solar manages construction and commissioning workflows. AlsoEnergy monitors commissioned systems and handles O&M ticketing for owned or operated assets. This stack covers Phases 1-4 without redundancy.
Utility-Scale Stack (50+ employees, utility and C&I)
Scanifly + Scoop Solar + AlsoEnergy + Raptor Maps
Scanifly performs drone-based site surveys at 1-3 inch accuracy. Scoop Solar tracks construction across multiple simultaneous projects. AlsoEnergy provides SCADA and multi-brand monitoring at commissioning. Raptor Maps conducts ongoing thermal and visual inspections at equipment-level granularity. For proposal generation during development, teams may also use dedicated solar proposal software integrated with their design tools.
Pro Tip
The total cost of a 4-tool utility stack can exceed $150,000/year. Model that against your O&M contract value. A 100 MWp plant generating at $38-78/MWh (Lazard LCOE Analysis, 2025) produces $33-68 million in lifetime revenue. Spending 0.5% of that on management software is economically rational.
International O&M Standards: What Your Software Should Support
Solar management software used in international markets should generate or reference documentation aligned with IEC standards.
IEC 62446 defines documentation and commissioning tests for grid-connected photovoltaic systems. It covers initial verification, periodic inspection, and system performance documentation. O&M software should store commissioning test results, generate periodic inspection checklists, and flag overdue maintenance against this standard.
IEC 61724 specifies photovoltaic system performance monitoring. It defines irradiance sensors, module temperature sensors, and data logging requirements. Monitoring platforms should collect the parameters defined in IEC 61724-1 to claim performance ratio accuracy. Software that cannot export IEC 61724-compliant datasets limits your ability to prove system performance to financiers and offtakers.
IEC 62446-1 focuses on initial verification and commissioning. IEC 62446-2 covers periodic inspection. Your O&M software should schedule inspections at intervals required by the standard and track completion. Failure to document periodic inspection compliance can void warranties or create liability.
NREL research confirms average crystalline silicon panel degradation at 0.5-0.6% per year across 200+ studies (NREL/DOE-funded study, 2015-2020). A typical system lifespan is 25-30 years. Asset management software should model degradation curves against actual production data to detect underperformance before it threatens IRR.
Note
Utility-scale operating costs range from $8-15/kW/year according to Lazard (Lazard LCOE Analysis, 2025). Management software that reduces truck rolls, automates inspections, and prevents downtime directly improves that figure.
Design, Track, and Hand Off Solar Projects in One Platform
SurgePV combines 3D design, bankable simulation, automated SLDs, and project tracking from survey through proposal. Join 70,000+ projects designed globally.
Book a DemoNo commitment required · 20 minutes · Live project walkthrough
How to Choose Solar Management Software
Use this decision tree to narrow your selection:
Step 1: Identify your primary phase.
- Pre-install (design → proposal): Start with SurgePV.
- Construction (permits → install → commissioning): Start with Scoop Solar.
- Operations (monitoring → O&M): Start with AlsoEnergy.
- Inspection (anomaly detection → thermal): Start with Raptor Maps or Scanifly.
Step 2: Count your asset base.
- Under 100 systems: Prioritize simplicity and cost. Avoid enterprise platforms.
- 100-1,000 systems: Consider an integrated stack. Data handoffs matter more than all-in-one promises.
- 1,000+ systems or 10+ MWp: Require API access, fleet dashboards, and multi-user permissions.
Step 3: Audit your hardware mix.
- Single-brand fleet (e.g., all SolarEdge): Manufacturer monitoring may suffice.
- Mixed-brand fleet: Hardware-agnostic platforms (AlsoEnergy, Greenbyte) are required.
Step 4: Evaluate TCO over 3 years. Include subscription, training, integration, hardware, and internal admin time. A “cheap” tool that requires 20 hours/week of manual data entry is more expensive than an automated platform at 3x the license cost. Factor in the cost of switching: data migration, retraining, and workflow disruption. Switching platforms mid-year can cost more than the software itself.
Step 5: Run a pilot. Test the full workflow on 5-10 real projects before committing. Most vendors offer pilot programs or monthly billing. Verify that mobile apps work on your crews’ actual devices and networks. Test the export and import process between tools. A broken data handoff between design and construction will cost more than a missing feature.
Frequently Asked Questions
What is solar management software?
Solar management software is any digital platform used to plan, build, monitor, or maintain photovoltaic systems. It includes 5 categories: project management for construction, asset management for financial oversight, O&M management for maintenance, monitoring for real-time data, and portfolio management for multi-technology fleets.
How much does solar management software cost?
Costs range from free (SolarEdge Monitoring for SolarEdge hardware owners) to over $100,000/year for enterprise portfolio platforms. Small installers can run a complete design + construction stack for under $7,000/year. Utility-scale operators typically spend $50,000-$150,000/year across multiple integrated tools. The key is matching cost to value: a $50,000 platform that prevents a single day of downtime on a 100 MWp plant pays for itself.
Do I need separate software for design and project management?
Not necessarily. SurgePV combines 3D design, simulation, and pre-install project tracking. However, no single tool covers design, construction, monitoring, and O&M equally well. Most companies use 2-4 specialized platforms with data exports or API connections between them. The question is not whether you need one tool or many. It is whether your tools exchange data without manual re-entry.
What is the best solar management software for small installers?
SurgePV for design and proposals plus Scoop Solar for construction tracking. This combination covers the pre-install and construction phases at a total cost of approximately $2,000-$7,000/year. Both offer solar-specific workflows that beat generic PM and design tools. Avoid AlsoEnergy and Greenbyte at this stage. Their enterprise pricing and complexity create overhead that small teams cannot support.
Can solar management software monitor multiple inverter brands?
Yes, but only hardware-agnostic platforms. AlsoEnergy and Greenbyte monitor inverters from multiple manufacturers. SolarEdge Monitoring only tracks SolarEdge equipment. If your portfolio mixes brands, avoid manufacturer-locked platforms. Most C&I portfolios evolve into mixed-hardware fleets over time as technology changes. Choosing an agnostic platform from the start prevents costly migration later.
What is a digital twin in solar O&M?
A digital twin is a GPS-accurate 3D model of a solar plant mapped to individual equipment (modules, inverters, combiners). Raptor Maps builds these from drone imagery. They enable precise anomaly location, maintenance history tracking, and as-built documentation.
How does drone inspection compare to manual inspection?
Drone inspection with thermal cameras is reported to be 99% faster than manual row-walking (Raptor Maps product documentation). Raptor Maps delivers inspection-to-insight in 30-90 minutes versus days or weeks for traditional methods. Scanifly improves design accuracy from 6-12 inches (satellite) to 1-3 inches (drone survey).
What standards should solar management software support?
At minimum: IEC 62446 for commissioning documentation, IEC 61724 for performance monitoring, and local AHJ requirements. Asset management platforms should also model NREL-validated degradation curves (0.5-0.6%/year for crystalline silicon). For projects seeking financing, bankable simulation outputs and P50/P75/P90 scenarios are often required by lenders. Make sure your design and monitoring platforms can produce these.
Sources and Methodology
This guide was produced through independent research and hands-on platform evaluation. We analyzed published vendor data, verified customer case studies, and reviewed third-party software directories including G2, Capterra, and Solar Power World. Market sizing data comes from DataHorizzon Research. U.S. installation statistics come from SEIA and Wood Mackenzie. Cost and performance data cite Lazard’s Levelized Cost of Energy Analysis and NREL degradation studies. Tool-specific claims (Raptor Maps anomaly rates, Scanifly accuracy, Scoop Solar ROI) were sourced from vendor-published case studies and annual reports.
For more details, see our guide on solar LCOE by country.
We evaluated each platform against real solar workflows: design-to-proposal handoffs, construction permit tracking, multi-brand fleet monitoring, and utility-scale inspection cycles. Ratings are not based on feature lists alone. They reflect how well each tool performs in actual production environments.
Ratings reflect performance across 10 weighted criteria: solar-specific workflow depth, mobile/offline access, integration ecosystem, data accuracy, scalability, pricing transparency, support quality, compliance reporting, implementation speed, and total cost of ownership. Solar-specific depth and TCO carry the highest weights. No vendor paid for placement or influenced rankings.

